E383
Mehmet Ilker Gokce, MD;
1Semih Tangal, MD;
2Nurullah Hamidi, MDS;
1Evren Suer, MD;
1Muhammed Arif Ibis, MD;
1Yasar Beduk, MD
11Department of Urology, Ankara University School of Medicine, Ankara, Turkey; 2Department of Urology, Ufuk University School of Medicine, Ankara, Turkey
Cite as: Can Urol Assoc J 2016;10(11-12):E383-7. http://dx.doi.org/10.5489/cuaj.3550 Published online November 10, 2016.
Abstract
Introduction: Active surveillance (AS) is an option for management
of low-risk prostate cancer (PCa). However, grade and stage pro-gression is an important consideration. Neutrophil-to-lymphocyte ratio (NLR) is a useful marker of cancer-related inflammation. In this study, we aimed to identify the roles of neutrophil count (NC), lymphocyte count (LC), and NLR to predict Gleason score (GS) upgrading, disease upstaging, and biochemical recurrence rates (BCR) in low-risk PCa patients.
Methods: We retrospectively evaluated data of 210 low-risk PCa
patients eligible for AS, but who underwent radical prostatec-tomy. The roles of NC, LC, and NLR on the GS upgrading, disease upstaging, and BCR rates were investigated. Univariate and multi-variate models were used to determine the effect of these parameters.
Results: There were 104 and 106 patients in the NLR <2.5 and
NLR ≥2.5 groups, respectively. GS upgrading in the NLR ≥2.5 group was more common than in the NLR<2.5 group (p=0.04). The NLR ≥2.5 group had significantly higher GS (8‒10; p=0.03). With regard to NLR, the groups were found to have similar rates of disease upstaging (9/104 in NLR <2.5 vs. 16/106 in NLR ≥2.5; p=0.200). BCR rates were also significantly different between groups (p=0.033). NC an LC were not found to be associated with GS upgrading, disease upstaging, or BCR.
Conclusions: NLR is a predictor of GS upgrading and BCR, but
not disease upstaging in patients with low-risk PCa. Furthermore, higher NLR was found to be associated with higher GS PCa. NLR is a cost-effective and easily accessible tool that can be used in the decision-making process for treatment of low-risk PCa cases.
Introduction
Prostate cancer (PCa) is the second most common cancer and the fifth leading cause of cancer death among men worldwide.1 In the era of prostate-specific antigen
(PSA)-based screening, PCa incidence has increased markedly over time, especially low-risk cases.2 Low-risk PCa is
defined as stage T1-T2a, PSA <10ng/ml and Gleason score (GS) ≤6 by the National Comprehensive Cancer Network (NCCN) guidelines.3 Management options for low-risk PCa
are curative treatment or active surveillance (AS); when comparing the advantages and disadvantages of the two options, deciding between them is a dilemma for patients and physicians. Treatment can lead to significant morbidity and functional impairment, such as incontinence and erect-ile dysfunction.4,5 Therefore, delaying curative treatment
until the disease progresses to a more aggressive category without losing the chance for active treatment seems to be favourable.
However, grade and stage progression has been reported from cohorts of men who underwent curative treatment despite being eligible for AS. Rates of upgrading were found to be as high as 23‒35%, which may be either due to disease progression over time or insufficiency of basic diagnostic biopsy.6-9 We need some other biochemical or biological
markers to better stratify patients into risk groups.
Neutrophil-to-lymphocyte ratio (NLR) is a useful marker of cancer-related inflammation and has been shown to be asso-ciated with poor prognosis in various types of cancers.10,11In
the case of PCa, the role of NLR on outcomes was validated, particularly in metastatic PCa, where higher NLR indicates more aggressive disease.12 However, inflammatory process
is mediated by different levels of subtypes of cells in differ-ent phases. For instance, tumour-infiltrating lymphocytes are needed in the early stages of cancers, whereas with increasing stage, systemic inflammation through the increased levels of neutrophils is needed. This has been supported by the find-ings from a recent study by Kwon et al.13 In another recent
study, NLR prior to prostate biopsy was found to be associated with the presence of PCa and higher GS as well.14
In this study, we aimed to identify the roles of neutrophil count (NC), lymphocyte count (LC), and NLR to predict
dis-Role of neutrophil-to-lymphocyte ratio in prediction of Gleason score
upgrading and disease upstaging in low-risk prostate cancer patients
eligible for active surveillance
ease upgrading, disease upstaging, and biochemical recur-rence rates (BCR) in a cohort of low-risk PCa patients eligible for AS, but who underwent radical prostatectomy.
Methods
We retrospectively evaluated the data of 611 men diagnosed with PCa and who underwent radical prostatectomy in our institution between May 2005 and March 2015. Patients were stratified to risk groups of low, intermediate, and high accord-ing to the NCCN guidelines.3 We further defined the patients
who were suitable for AS based on the following criteria: PSA <10 ng/mL, GS ≤6, clinical stage ≤T2a, ≤ 2 positive cores, and ≤50% cancer involvement in each positive core.
Patient charts were reviewed and data regarding age, PSA level, biopsy GS, radical prostatectomy GS, NC, and LC were collected. NLR was calculated by dividing NC by LC. Additionally, data of positive surgical margins, pathologic-al stage, and BCR were collected. BCR was defined as an increase in PSA level on two consecutive measurements after radical prostatectomy, with the last PSA value >0.2 ng/mL. Patients with history of autoimmune or inflammatory dis-eases that may modify the levels of neutrophils and lympho-cytes, clinical suspicion or laboratory signs of bacterial or viral infection at the time of blood collection, and those with history of chemotherapy or radiation therapy at any time of the study were excluded from analysis. Patients with history of regular use of anti-inflammatory drugs or systemic steroids were also excluded from the study.
As there is no universally accepted value of abnormal NLR, NC, and LC, the median values of our low-risk group were accepted as the cutoff values: 2.5 for NLR; 4.2 x 10⁹/L
for NC; and 1.4 x 10⁹/L for LC.
For statistical analysis, SPSS version 21 (IBM Corp, Armonk, NY, U.S.) was used. P value of 0.05 was con-sidered statistically significant. Comparisons between groups were performed using Chi-square tests for categorical vari-ables, and t-tests and analysis of variance were used for continuous variables, depending on the distribution of the data. Univariate and multivariate logistic regression analyses
were conducted to identify variables predictive of upgrading and upstaging. Survival analyses were performed using the Kaplan-Meier method with a log-rank test.
Results
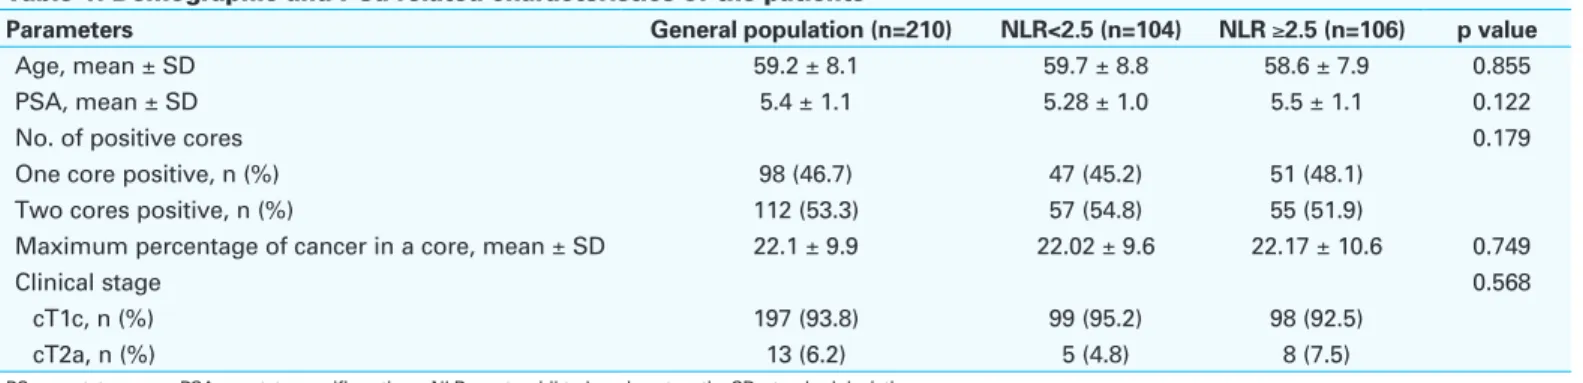
Of the 611 men diagnosed with localized PCa and treated with radical prostatectomy, 210 patients were found to meet the defined AS criteria. The mean age of this population was 59.2 ± 7.1 years and the mean PSA value 5.4 ± 1.1 ng/ml. When these patients are grouped with regard to NLR cutoff level of 2.5, there were 104 and 106 patients in the NLR <2.5 and NLR ≥2.5 groups, respectively. These groups were found to be similar with regard to preoperative demographic and tumour characteristics, with the exception of the NC, LC, and NLR levels (Table 1). Rates of positive surgical mar-gins were also similar in the NLR <2.5 and NLR ≥2.5 groups (11.5% vs. 14.1%, respectively; p=0.68).
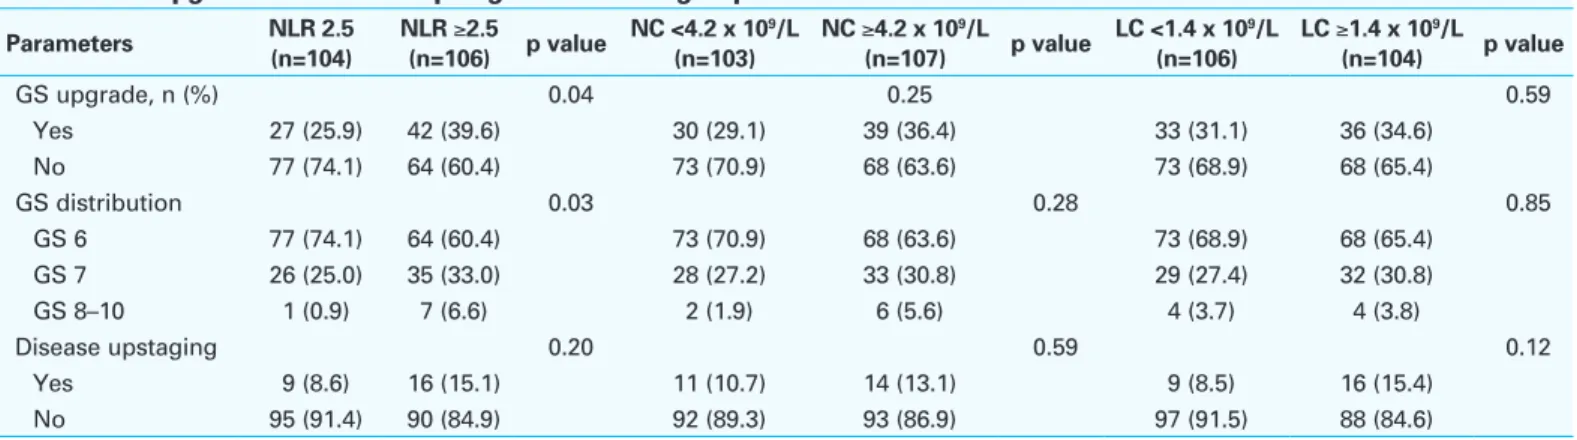
GS upgrading and disease upstaging rates with regard to NLR
GS upgrading was observed in a total of 69 patients (32.8%). When the groups were compared with regard to NLR, there were 27 (25.9%) and 42 (39.6%) patients who had GS upgrading in the NLR <2.5 and NLR ≥2.5 groups, respectively (p=0.04). When the groups were compared for their upgraded GS, the NLR ≥2.5 group had significantly higher GS (8‒10) compared to the NLR <2.5 group (1/104 vs. 7/106; p=0.03). The results are summarized in Table 2. Disease upstaging was observed in a total of 25 patients (11.9%). With regard to NLR, the two groups were found to have similar rates of disease upstaging (9/104 vs. 16/106 patients; p=0.20) (Table 2).
GS upgrading and disease upstaging rates with regard to NC
The population was divided into two with regard to median NC of 4.2 x 10⁹/L; there were 103 and 107 patients in the
NC<4.2 x 10⁹/L and ≥4.2 x 10⁹/L groups, respectively. Rates
of GS upgrade (GS 8‒10) and disease upstage were found to
Table 1. Demographic and PCa-related characteristics of the patients
Parameters General population (n=210) NLR<2.5 (n=104) NLR ≥2.5 (n=106) p value
Age, mean ± SD 59.2 ± 8.1 59.7 ± 8.8 58.6 ± 7.9 0.855
PSA, mean ± SD 5.4 ± 1.1 5.28 ± 1.0 5.5 ± 1.1 0.122
No. of positive cores 0.179
One core positive, n (%) 98 (46.7) 47 (45.2) 51 (48.1)
Two cores positive, n (%) 112 (53.3) 57 (54.8) 55 (51.9)
Maximum percentage of cancer in a core, mean ± SD 22.1 ± 9.9 22.02 ± 9.6 22.17 ± 10.6 0.749
Clinical stage 0.568
cT1c, n (%) 197 (93.8) 99 (95.2) 98 (92.5)
cT2a, n (%) 13 (6.2) 5 (4.8) 8 (7.5)
have tendency to be higher in NC ≥4.2 x 10⁹/L group, but
none of the differences were statistically significant. Results are summarized in Table 2.
GS upgrading and disease upstaging rates with regard to LC
The population was divided in to two with regard to median LC of 1.4 x 10⁹/L; there were 106 and 104 patients in the LC
<1.4 x 10⁹/L and ≥1.4 x 10⁹/L groups, respectively. Rates of
GS upgrade (GS 8‒10) and disease upstage were found to be similar in both groups. Results are summarized in Table 2.
Univariate analysis was performed to determine fac-tors associated with GS upgrading and disease upstaging. Preoperative serum PSA level and NLR were found to be associated with increased risk of GS upgrading. However, none of the factors were found to be associated with higher risk of disease upstaging. The results are summarized in Table 3. Multivariate analysis was performed to determine the independent predictors of GS upgrading. Both higher PSA (odds ratio [OR] 1.384, 95% confidence interval [CI] 1.116‒2.722; p=0.01) and higher NLR (OR 1.821, 95% CI 1.246‒3,255; p=0.007) were found to be significant pre-dictors of GS upgrading.
Results of biochemical recurrence-free survival rates
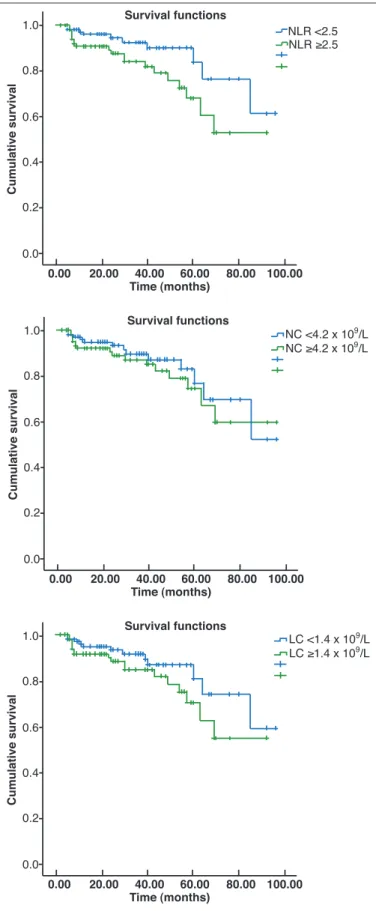
PSA recurrence developed in 30 patients after a median fol-lowup of 27 months (range 3‒98). When the groups were compared with regard to NLR, NC, and LC, the only sig-nificant difference was observed with regard to NLR. The three- and five-year recurrence-free survival rates in the NLR ≥2.5 group were 81.9% and 60.4%, respectively, and these survival rates were significantly lower than their counter-parts in the NLR<2.5 group (89.9% and 76.5%, respectively; p=0.033). The three- and five-year recurrence-free survival rates in the NC <4.2 x 10⁹/L and ≥4.2 x 10⁹/L groups were
87.0% and 76.4% vs. 84.9% and 67.0%, respectively; the difference was not statistically significant (p=0.442). The three- and five-year recurrence-free survival rates in the LC <1.4 x 10⁹/L and ≥1.4 x 10⁹/L groups were 89.4% and 73.9%
vs. 81.8% and 62.5%, respectively; the difference was not statistically significant (p=0.143). The Kaplan-Meier curves of the groups are given in Figs. 1A, 1B, and 1C.
In the multivariate analysis, GS upgrading (OR1 664, 95% CI 1.108–3.118; p=0.006), disease upstaging (OR 1.274, 95% CI 1.005–2.216; p=0.01), and having positive surgical margins (OR 1.815, 95% CI 1.380–4.633; p=0.001) were found to be associated with increased BCR rates. Having a
Table 2. GS upgrade and disease upstage rates of the groups
Parameters NLR 2.5 (n=104) NLR ≥2.5 (n=106) p value NC <4.2 x 10⁹/L (n=103) NC ≥4.2 x 10 9/L (n=107) p value LC <1.4 x 10⁹/L (n=106) LC ≥1.4 x 10 9/L (n=104) p value GS upgrade, n (%) 0.04 0.25 0.59 Yes 27 (25.9) 42 (39.6) 30 (29.1) 39 (36.4) 33 (31.1) 36 (34.6) No 77 (74.1) 64 (60.4) 73 (70.9) 68 (63.6) 73 (68.9) 68 (65.4) GS distribution 0.03 0.28 0.85 GS 6 77 (74.1) 64 (60.4) 73 (70.9) 68 (63.6) 73 (68.9) 68 (65.4) GS 7 26 (25.0) 35 (33.0) 28 (27.2) 33 (30.8) 29 (27.4) 32 (30.8) GS 8–10 1 (0.9) 7 (6.6) 2 (1.9) 6 (5.6) 4 (3.7) 4 (3.8) Disease upstaging 0.20 0.59 0.12 Yes 9 (8.6) 16 (15.1) 11 (10.7) 14 (13.1) 9 (8.5) 16 (15.4) No 95 (91.4) 90 (84.9) 92 (89.3) 93 (86.9) 97 (91.5) 88 (84.6)
GS: Gleason score; LC: lymphocyte count; NC: neutrophil count; NLR: neutrophil-to-lymphocyte ratio.
Table 3. Univariate analysis for GS upgrading and disease upstaging
GS upgrading Disease upstaging
Variables OR 95% CI p value OR 95% CI p value
Age 1.066 0.645–1.316 0.844 1.010 0.326–1.174 0.997
PSA 1.534 1.078–2.544 0.008 1.045 0.555–1.872 0.851
Two positive cores vs. one positive core 1.399 0.680–3,102 0.428 1.148 0.677–1.842 0.812 Maximum percentage of cancer in a core 1.147 0.792–2.889 0.814 1.209 0.804–2.114 0.572 Clinical stage (cT2a vs. cT1c) 1.115 0.398–2.012 0.838 1.015 0.417–1.887 0.894
NLR ≥2.5 2.234 1.131–5.712 0.003 1.122 0.571–1.874 0.667
NC ≥4.2 x 10⁹/L 1.266 0.603–2.655 0.781 1.117 0.566–1.767 0.821
LC ≥1.4 x 10⁹/L 1.205 0.497–2.667 0.821 1.085 0.381–1.884 0.965
NLR ≥2.5 was not found to be an independent risk factor for BCR in the multivariate analysis (OR 1.209, 95% CI 0.804–2.114; p=0.572).
Discussion
AS prevents or at least delays adverse effects related to the treatment of low-risk PCa; however, GS upgrading is an important concern, with rates of as high as 23‒35% shown in contemporary radical prostatectomy series.6-9 GS
upgrading results in delay of definitive treatment in a patient who is actually not in the low-risk group.
Current imaging and biopsy techniques are insufficient to determine low-risk group, therefore, some biochemical or biological markers to better stratify patients into risk groups are needed. Recently, some biochemical markers, such as PCA3 and prostate health index (PHI) (which combines free and total PSA with [-2]proPSA), as well as four kallikrein (4K) protein biomarkers (total PSA, free PSA, intact PSA, and human kallikrein-related peptidase 2) were developed to predict the presence of aggressive PCa.15-17 However, these
tests are expensive and cannot be applied widely, especially in developing countries. Therefore, less expensive and more easily accessible tests are needed. In the current study, we examined the roles of NC, LC, and NLR in the prediction of GS upgrading, disease upstaging, and BCR rates. Our results revealed NLR as a significant predictor of GS upgrading and BCR, but not of disease upstaging.
The immune system responds differently in distinct phases of carcinogenesis and cancer growth.18 Higher NLR indicates
more aggressive disease and poor response to treatment in metastatic PCa patients.12 In a study in early-stage,
low-risk PCa patients, Kwon et al found that LC was associated with GS upgrading and NC was associated with BCR.13 In
their analysis, NLR was not associated with any of the study endpoints. The authors explained this by the hypothesis of significant involvement of tumour-infiltrating lymphocytes in the early phase of PCa.13 Our results revealed that NLR was
associated with GS upgrading and BCR, but neither NC nor LC were associated with any of the study endpoints. NLR and preoperative serum PSA levels were also found to be associated with GS upgrading in the multivariate analysis.
The GS upgrading (32.8%) and disease upstaging (11.9%) rates of our cohort are concordant with the current literature and slightly higher than the cohort of Kwon et al.13 Also,
BCR was observed in 30 of 210 (14.3%) of the patients, which is much higher than the cohort of Kwon et al (6 of 217 patients, 2.8%). This disparity may explain the higher systemic inflammation in our cohort and this might have reflected as increased NLR in patients with BCR.
In our cohort, patients with higher NC and LC have higher rates of GS upgrading and disease upstaging, although this is not statistically significant. This may be due to the fact
0.0 0.2 0.4 0.6 0.8 1.0 Survival functions Cumulative survival 0.00 20.00 40.00 60.00 80.00 100.00 Time (months) 0.0 0.2 0.4 0.6 0.8 1.0 Survival functions Cumulative survival 0.00 20.00 40.00 60.00 80.00 100.00 Time (months) 0.0 0.2 0.4 0.6 0.8 1.0 Survival functions Cumulative survival 0.00 20.00 40.00 60.00 80.00 100.00 Time (months) NLR <2.5 NLR ≥2.5 LC <1.4 x 10⁹/L LC ≥1.4 x 10⁹/L NC <4.2 x 10⁹/L NC ≥4.2 x 10⁹/L
Fig. 1. Kaplan-Meier curves for biochemical recurrence-free survival with
regard to: (A) neutrophil-to-lymphocyte ratio; (B) neutrophil count; and
that in the low-risk, early-stage PCa, significant immune response through these cells might not become obvious yet or our relatively small sample size might have been be underpowered to show a significant association between these parameters. Another important point is the vulner-ability of NC and LC to any other cause of inflammation; imunohistochemical studies to show the concordance of systemic reflection of cell counts on the cancer tissue is necessary to validate these results.
NLR showed a significant association not only with GS upgrading, but also with the distribution of GS. Patients with elevated NLR levels were found to have significantly higher GS (8‒10) compared to those with lower NLR (6.6% vs. 0.9%; p=0,03). In the study of Kwon et al, similarly all GS 8‒10 cases were observed among patients with higher NLR values (p=0.19).13 This finding supports the increased
immune response in patients with higher GS, who have higher tendency for systemic dissemination. To verify these findings, further studies comparing the inflammatory status of low-, intermediate-, and high-risk localized PCa patients are needed, along with immunohistochemical evidence.
The most commonly used parameter to show disease progression in low-risk PCa patients is recurrence-free sur-vival. In our cohort, PSA relapse after surgery was observed in 30 of the 210 patients. In the multivariate analysis, GS upgrading, disease upstaging, and having positive surgical margins were found to be associated with increased BCR rates. However, having a NLR ≥2.5 was not found to be an independent risk factor for BCR in the multivariate analysis.
Limitations of the study
The retrospective nature of our study is the most important limitation. Medical charts of the patients were reviewed to exclude presence of any condition that may be associated with alterations in the white blood cell counts. Our study reflects results of a single tertiary academic centre and can-not reflect the results from a general population. Although the pathologists have considerable experience in evaluation of the radical prostatectomy specimens, central pathological review of the specimens was not performed. Also, there is no evidence of immunohistochemical findings that reflect the immunological findings are solely attributed to PCa.
Conclusions
Our results demonstrated that the NLR is a predictor of GS upgrading and BCR, but not disease upstaging in patients with low-risk PCa eligible for AS. Also, higher NLR was found to be associated with higher GS (8‒10) PCa following radical prostatectomy. NC and LC may also have roles in the inflammatory process of early-stage PCa. NLR is a cost-effective tool that is easily accessible in different healthcare
settings. At our centre, we use it to support decision-making for treatment of low-risk PCa cases. These findings should be further validated with immunohistochemical studies. Competing interests: The authors report no competing personal or financial interests. This paper has been peer-reviewed.
References
1. Prostate cancer estimated incidence, mortality, and prevalence worldwide in 2012. Available at http:// globocan.iarc.fr/old/FactSheets/cancers/prostate-new.asp. Accessed October 4, 2016.
2. Cooperberg MR, Broering JM, Kantoff PW, et al. Contemporary trends in low-risk prostate cancer: Risk assessment and treatment. J Urol 2007;178:S14. http://dx.doi.org/10.1016/j.juro.2007.03.135 3. National Comprehensive Cancer Network. Available at http://www.nccn.org/professionals/physician_
gls/pdf/prostate.pdf. Accessed October 4, 2016.
4. Sanda MG, Dunn RL, Michalski J, et al. Quality of life and satisfaction with outcome among prostate cancer survivors. N Engl J Med 2008;358:1250-61. http://dx.doi.org/10.1056/NEJMoa074311 5. Alemozaffar M, Regan MM, Cooperberg MR, et al. Prediction of erectile function following treatment for
prostate cancer. JAMA 2011;306:1205-14. http://dx.doi.org/10.1001/jama.2011.1333 6. Cooperberg M, Carroll PR, Klotz L. Active surveillance for prostate cancer: Progress and promise. J Clin
Oncol 2011;29:3669-76. http://dx.doi.org/10.1200/JCO.2011.34.9738
7. Sundi D, Ross AE, Humphreys EB, et al. African-American men with very low-risk prostate cancer exhibit adverse oncologic outcomes after radical prostatectomy: Should active surveillance still be an option for them? J Clin Oncol 2013;31:2991-7. http://dx.doi.org/10.1200/JCO.2012.47.0302 8. Schreiber D, Chhabra A, Rineer J, et al. A population-based study of men with low-volume, low-risk
prostate cancer: Does African-American race predict for more aggressive disease? Clin Genitourin Cancer 2015;13:e259-64. http://dx.doi.org/10.1016/j.clgc.2015.02.006
9. Behbahani TE, Ellinger J, Caratozzolo DG, et al. Pathological outcomes of men eligible for active surveillance after undergoing radical prostatectomy: Are results predictable? Clin Genitourin Cancer 2012;10:32-6. http://dx.doi.org/10.1016/j.clgc.2011.09.004
10. Templeton AJ, McNamara MG, Seruga B, et al. Prognostic role of neutrophilto-lymphocyte ratio in solid tumours: A systematic review and meta-analysis. J Natl Cancer Inst 2014;106:dju124. http://dx.doi. org/10.1093/jnci/dju124
11. Ozcan C, Telli O, Ozturk E et al. The prognostic significance of preoperative leukocytosis and neutrophil-to-lymphocyte ratio in patients who underwent radical cystectomy for bladder cancer. Can Urol Assoc J 2015;9:E789-94. http://dx.doi.org/10.5489/cuaj.3061
12. van Soest RJ, Templeton AJ, Vera-Badillo FE, et al. Neutrophil-to-lymphocyte ratio as a prognostic biomarker for men with metastatic castration-resistant prostate cancer receiving first-line chemotherapy: Data from two randomized phase 3 trials. Ann Oncol 2015;26:743-9. http://dx.doi.org/10.1093/annonc/mdu569 13. Kwon YS, Han CS, Yu JW, et al. Neutrophil and lymphocyte counts as clinical markers for stratifying low-risk
prostate cancer. Clin Genitourin Cancer 2016;14:e1-8. http://dx.doi.org/10.1016/j.clgc.2015.07.018 14. Gokce MI, Hamidi N, Suer E, et al. Evaluation of neutrophil-to-lymphocyte ratio prior to prostate biopsy
to predict biopsy histology: Results of 1836 patients. Can Urol Assoc J 2015;9:E761-5. http://dx.doi. org/10.5489/cuaj.3091
15. Cary KC, Cooperberg MR. Biomarkers in prostate cancer surveillance and screening: Past, present, and future. Ther Adv Urol 2013;5:318-29. http://dx.doi.org/10.1177/1756287213495915 16. Catalona WJ, Partin AW, Sanda MG, et al. A multicentre study of [-2]pro-prostate-specific antigen
com-bined with prostate-specific antigen and free prostate-specific antigen 16 for prostate cancer detection in the 2.0 to 10.0 ng/ml prostate-specific antigen range. J Urol 2011;185:1650-5. http://dx.doi. org/10.1016/j.juro.2010.12.032
17. Lilja H, Ulmert D, Vickers AJ. Prostate-specific antigen and prostate cancer: Prediction, detection, and monitoring. Nat Rev Cancer 2008;8:268-78. http://dx.doi.org/10.1038/nrc2351
18. Kim R, Emi M, Tanabe K. Cancer immunoediting from immune surveillance to immune escape. Immunology 2007;121:1-14. http://dx.doi.org/10.1111/j.1365-2567.2007.02587.x
Correspondence: Dr. Mehmet Ilker Gökce, Department of Urology, Ankara University School of Medicine, Ankara, Turkey; [email protected]