T.C. DOĞUŞ UNIVERSITY
INSTITUTE OF SCIENCE AND TECHNOLOGY ENGINEERING AND TECHNOLOGY MANAGEMENT
A STUDY ABOUT PROCESS IMPROVEMENT WITH SIX SIGMA METHODOLOGY IN CUSTOMER SUPPORT DEPARTMENT
MASTER’S THESIS
MURAT CAN ATALAY 201399003
THESIS ADVISOR: PROF. DR. MESUT KUMRU
T.C. DOĞUŞ UNIVERSITY
INSTITUTE OF SCIENCE AND TECHNOLOGY ENGINEERING AND TECHNOLOGY MANAGEMENT
A STUDY ABOUT PROCESS IMPROVEMENT WITH SIX SIGMA METHODOLOGY IN CUSTOMER SUPPORT DEPARTMENT
MASTER’S THESIS
MURAT CAN ATALAY 201399003
THESIS ADVISOR PROF. DR. MESUT KUMRU
COMMITTEE MEMBERS PROF. DR. MESUT KUMRU PROF.DR. ÖZALP VAYVAY
YRD. DOÇ. DR. PERAL TOKTAŞ PALUT
TEZ BİLDİRİMİ
Tez içindeki bütün bilgilerin etik davranış ve akademik kurallar çerçevesinde elde edilerek sunulduğunu, ayrıca tez yazım kurallarına uygun olarak hazırlanan bu çalışmada orijinal olmayan her türlü kaynağa eksiksiz atıf yapıldığını beyan ederim.
CONTENTS PAGE NO PREFACE I ÖZET II ABSTRACT III FIGURES IV TABLES V ABBREVIATIONS VI 1. INTRODUCTION 1 2. LITERATURE REVIEW 2
2.1. SIX SIGMA CONCEPT 9
2.2. FEATURES OF SIX SIGMA 9
2.3. CONCEPTS OF SIX SIGMA 10
2.4. ROLE OF SIX SIGMA 11
2.4.1. SPONSOR 11
2.4.2. CHAMPION 11
2.4.3. MASTER BLACK BELT 12
2.4.4. BLACK BELT 12
2.4.5. PROCESS OWNER 12
2.4.6. EXPERT GREEN BELT 12
2.4.7. GREEN BELT 12
2.5. METHODOLOGY 13
2.5.1. DMAIC METHODOLOGY 13
2.5.2. DMADV METHODOLOGY 14
2.5.3. DFSS METHODOLOGY 14
2.6. THE DEVELOPMENT OF SIX SIGMA CONCEPT 15
2.7. PHASE OF SIX SIGMA 17
2.7.1. DEFINE PHASE 18 2.7.2. MEASURE PHASE 19 2.7.3. ANALYZE PHASE 20 2.7.4. IMPROVE PHASE 20 2.7.5. CONTROL PHASE 21 2.8. TECHNICAL TOOLS 22
2.8.1. SIX SIGMA PROJECT CHARTER 23
2.8.2. VOICE OF THE CUSTOMER (VOC) 23
2.8.3. QUALITY FUNCTION DEPLOYMENT (QFD) 24
2.8.4. SIPOC 25
2.8.5. BENCHMARKING 26
2.8.6. PARETO ANALYSIS 26
2.8.7. THE CAUSE AND EFFECT
(ISHIKAWA DIAGRAM OR FISHBONE) DIAGRAM 26
2.8.8. BRAINSTORMING 28
3. IMPROVEMENT OF SCRAP PARTS TRACKING AND DESTRUCTION
PROCESS FOR WARRANTY SERVICE 30
3.1. DEFINE PHASE 31 3.1.1. PROJECT CHARTER 31 3.1.1.1. BUSINESS CASSE 31 3.1.1.2. OPPORTUNITY STATEMENT 32 3.1.1.3. GOAL STATEMENT 32 3.1.1.4. PROJECT SCOPE 32 3.1.1.5. PROJECT PLAN 33 3.1.1.6. PROJECT TEAM 33 3.1.2. PROCESS MAPS 34
3.1.2.1. MACRO PROCESS MAP 34
3.1.2.2. MICRO PROCESS MAP 35
3.1.3. UNITARY OF THE PROCESS 37
3.1.4. SWIMLANE MAP 39
3.1.5. SIPOC 40
3.2. MEASURE PHASE 40
3.3. ANALYSIS PHASE 42
3.4. IMPROVE AND CONTROL PHASE 45
3.5. CONCLUSION 47
3.5.1 CONCLUSION OF PROJECT 47
3.5.2 RECOMMENDATIONS AND FURTHER DISCUSSIONS 51
BIBLIOGRAPHY 52
APPENDIX 54
I PREFACE
First of all, I would like to express my gratitude to my advisor Prof. Dr. Mesut KUMRU who consider my wishes while helping me to choose the thesis topic. He always set an example of excellence as a researcher, role model, instructor, and mentor. Also, I would like to thank Res. Asst. Aydın TANRIVERDİ for his valuable support to me.
I would also like to thank my manager dear Volkan KUŞ for giving me a chance to design a Six Sigma Project. Furthermore, I like to thank my Six Sigma Black Belt Ali Osman AYDIN and my Project team. Finally, I would like to present my eternal gratitude my mother Muazzez ATALAY and my girlfriend Ece YUNGUL for their valuable support.
II
ÖZET
Bilişim ve teknolojinin çok hızlı ve sürekli olarak gelişmesi sebebi ile kurum ve kuruluşlar, iç ve dış etkenlere bağlı olarak ciddi bir değişim baskısı altındadır. Bu baskı iki tip değişim sürecini ortaya çıkarmıştır. Birincisi bu değişim baskısını spontane şekilde yaşayan kurumlardır. İkincisi ise, değişimi planlı ve programlı bir şekilde gerçekleştirenlerdir. Bu değişimi yönetebilen şirketler istikrarlı bir şekilde büyümektedir ve olası kriz durumları ile kolaylıkla başa çıkabilmektedir. Bu da iş süreçlerinde en etkili yolu izlemeleri ve süreçlerini mükemmele yaklaştırmaya çalışmaları ile olmaktadır. Bütün iş süreçlerinde mükemmeli hedefleyen şirketler yoğunluklu olarak 6Sigma metodolojisini kullanmaktadır. Çıkış noktası üretimde mükemmellik olan 6sigma, günümüzde hem üretim süreçlerinde hem de hizmet süreçlerinde aktif şekilde kullanılmaktadır. Altı Sigma’nın odak noktası, müşteridir. Bu noktasında ilerlerken 6 Sigma projeleri, müşteriye değer katarak, kalite ve verimi artırarak ve israfları minimuma indirerek, müşteri memnuniyetini ve kârı artırmayı, zaman kayıplarını azaltmayı hedefler. Bu sebeple müşteriyi odak noktasına oturtmuş olan kurum ve kuruluşlar için 6 Sigma paha biçilemez bir değerdir.
Ülkemizde önde gelen en büyük 100 şirketinin tamamına yakını 6 Sigma faaliyetlerini aktif bir şekilde yürütmektedir ve çeşitli başarı öykülerine imza atmışlardır.
Bu çalışma ile Altı Sigma metodunun ideolojisi, tarihsel süreçleri ve evrimi incelenerek, Altı Sigma aletlerine ve kullanım alanlarına yer verilmiştir. Ardından ülkemizin iş makinaları sektöründe önde gelen bir firmasında yapılan Altı Sigma uygulamasına yer verilmiştir. Bu kuruluş aynı zamanda Türkiye’de Altı Sigma kültürünü kendi ve holding grup şirketleri arasında yaymış bir firmadır.
Bu Altı Sigma Projesi, Garanti Hizmet sonucu oluşan hurda parçaların kayıtsız stoklanması sonucunda ortaya çıkan parça kayıplarının ve finansal tehditlerin önüne geçmek için yapılmıştır. Garanti hizmeti sonrası, yenisi ile değiştirilen parçaların müşteriden teslim alınarak, imha edilmesine kadar giden süreçte yaşanan sorunların çözümü için Altı Sigma projesi başlatılmıştır. Proje ile hurda parçaların piyasaya düşmesinin engellenmesi, suiistimallerin önlenmesi ve bütün bu parçaların lojistik hareketlerinin kayıt altına alınarak denetlenebilir hale getirilebilmesi hedeflenmiştir. Projemin tamamlanması sonucunda, Uzman Yeşil Kuşak Sertifikası almaya hak kazandım.
III
ABSTRACT
Today, institutions and organizations are under a serious change pressure due to the rapid and continuous development of information and technology depending on internal and external factors. This pressure reveals two types of exchange processes. The first one is the institutions that encounter with this change pressure spontaneously and the second one is that actualize the change in a planned and organized way. If the companies would manage this change, they can consistently expand their company. Also, they would easily overcome potential crisis situations. This solution can come true with the monitoring and processing the business processes. The companies that target excellence in business processes use Six Sigma methodology intensively. Output point of the Six Sigma is the excellence in production and today Six Sigma is used in both production and service processes actively. The focal point of Six Sigma is the customer. At this point, Six Sigma projects aim to increase customer satisfaction and profit and decrease time loss by increasing quality, efficiency. Therefore, for the institutions and organizations that focused on customer, Six Sigma methodology is an invaluable asset.
Nearly all of the top 100 largest companies in Turkey are actively carrying out Six Sigma activities and have made various success stories.
This study examines the ideology, historical processes, and development of the Six Sigma methodology, including Six Sigma tools and their areas of use. Also, an application of Six Sigma methodology from a leading construction machinery organization is examined. This organization is a rare company that spreads Six Sigma methodology among its own and group companies in Turkey.
This Six Sigma Project is designed to avoid machinery piece losses and prevent financial threats arising from unregistered stockpiles of scrap parts resulting from Warranty Service. Six Sigma Project is started to solve the problems experienced in the process that begins with receiving scrap parts from the customer until disposing of that parts after the Warranty Service. It was aimed to prevent the entering of scrap pieces to the market and to record, control the logistic movements of all of these parts. As a result of completing this project, I am honored by Expert Green Belt certificate.
IV
FIGURES
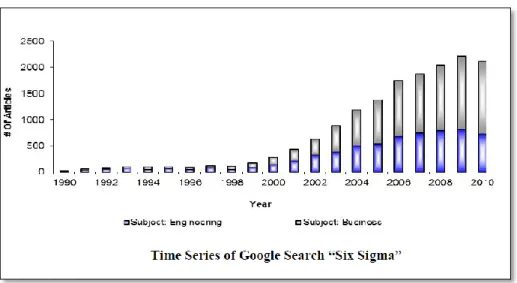
Figure 2.1 Time Series of Google Search “Six Sigma”( Thomas J. Zugelder, 2012) 3
Figure 2.2 Focus areas of Six Sigma publications (Qun Zhang, 2012) 3
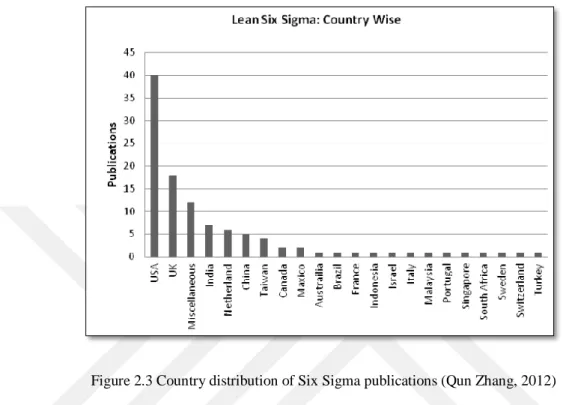
Figure 2.3 Country distribution of Six Sigma publications (Qun Zhang, 2012) 4
Figure 2.4 Usage Industry distribution of Six Sigma (Qun Zhang, 2012) 4
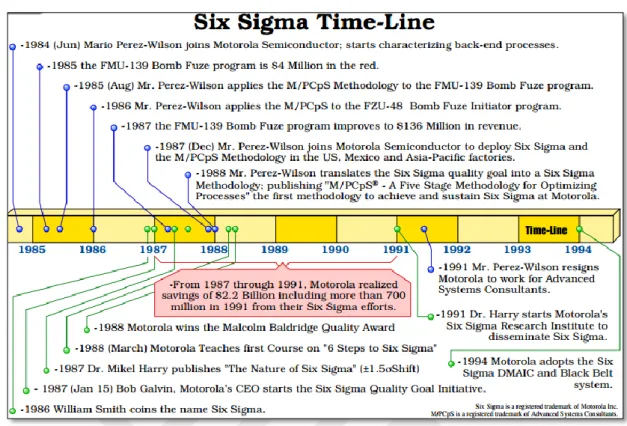
Figure 2.5 Six Sigma Time-Line (Advanced Systems Consultants, 2009) 6
Figure 2.6 6Sigma Normal Distribution (media.licdn.com) 10
Figure 2.7 Sigma Levels 10
Figure 2.8 Concepts of Six Sigma 11
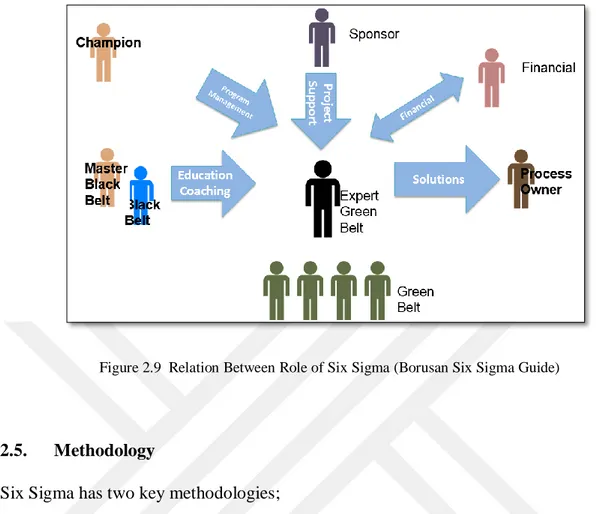
Figure 2.9 Relation between Roles of Six Sigma (Borusan Six Sigma Guide) 13
Figure 2.10 DMAIC five phase (Borusan Six Sigma Guide) 15 Figure 2.11 DMADV five phase (Borusan Six Sigma Guide) 15
Figure 2.12 RELATION OF DMAIC’S five phase (tutorialspoint.com) 17
Figure 2.13 Example of Six Sigma Project Charter (SlideShare) 23
Figure 2.14 Voice of Customer (VOC) Interaction chart (meaningcloud.com) 24
Figure 2.15 Quality House Example 25
Figure 2.16 An Example of Paratoo analyses 27
Figure 2.17 An Example of Fish Bone 28
Figure 3.1 Macro Process Map of the Project 34
Figure 3.2 Micro Process Map of Current Process 36
Figure 3.3 Swimlane Map of the Project 39
Figure 3.4 Why we have financial loss? (Fish Bone) 43
Figure 3.5 What is the root cause of weakness in internal control system? (Fish Bone) 43
Figure 3.6 Problem Statement Chart 44
Figure 3.7 View of New Scrap Parts Label 46
V TABLES
Table 2.1 Example of Company Earnings with Six Sigma Project 2
Table 2.2 Country wise Focus Industry and Focus Area (Muhammad Irfan 2012) 5
Table 2.3 Results of Janet Jacobsen Project (Ford Motor Company, 2012) 8
Table 2.4 Formula of DPMO 19
Table 2.5 Candidate Six Sigma Tools 22
Table 2.6 An Example SIPOC for Automobile Repair 26
Table 3.1 Project Plan Table 33
Table 3.2 Project Team Table 33
Table 3.3 Project charter of the Project 33
Table 3.4 Unitary of the Process (regional) 38
Table 3.5 SIPOC of the Project 40
Table 3.6 Indicators of the Project 40
Table 3.7 Customer Requests table 41
Table 3.8 Measurement decision table 41
Table 3.9 Measure results table of the Project 42
Table 3.10 Sigma level of the current situation 4 2
Table 3.11 Brainstorming results 45
Table 3.12 Classification of brainstorming results 45
Table 3.13 View of new scrap parts warehouse entrance- existence report 45
Table 3.14 KPI lists for this Project 45
Table 3.15 Improvement & Control Implementation Plan 47
Table 3.16 Financial Results of this Project 48
Table 3.17 Efficiency and tracing results of the project (Dec2016-Jan2017) 48
Table 3.18 Transportation cost claims 49
Table 3.19 Waste Scope and Pricing Table Screen Shot 49
Table 3.20 Regional Distribution of Scrap Parts (KG) (2014-2015-2016) 50
Table 3.21 Summary Results Table of the Project 50
VI
ABBREVIATIONS
CPK:Process Capability
DMADV: Define-Measure-Analyze-Design-Verify DMAIC: Define-Measure-Analyze-Improve-Control DPMO: Defective Per Million Opportunities
DFSS: Define-Identify-Design-Optimize-Verify KPI: Key Performance Indicators
SPC:Statistical Process Control
SIPOC: Suppliers-Inputs-Process-Outputs-Customer SIB: Send It Back
SL: Sigma Level
QFD:Quality Function Deployment
TC: Technical communications engineer TEI: Tusas Engine Industry
TQM: Total Quality Managment VOC: Voice of Customer
1. INTRODUCTION
In today’s global markets it is increasingly important that companies work smarter rather than harder in order to stay competitive. Current level of technology enables wide range of data to be collected and analyzed efficiently to gain better knowledge of an organization’s operations and to recognize potential areas for improvements.
This thesis focuses on improving business processes using six sigma methodology. We selected the Six Sigma methodology because Six Sigma is both a methodology and a philosophy that improves quality by analysing data to implement controls and to find the root cause of the quality problems.
The paper is divided into two main parts. The first part examines literature review, the ideology, historical processes, and development of the Six Sigma methodology, including Six Sigma tools and their areas of use. Second part focuses an application of Six Sigma methodology from a leading construction machinery organization is examined. This organization is a rare company that spreads Six Sigma methodology among its own and group companies in Turkey.
2. LITERATURE REVIEW
Six Sigma is a kind of customer-focused methodology. This strategy can drive a surprising change in a business and enhance the customers’ satisfaction.
The widespread process improvement methodology of Six Sigma was introduced by Bill Smith at Motorola in the 1980s. After Motorola, Six Sigma methodology spreads between lots of big and important companies. According to previous literature review about Six Sigma on the Google Academics. Six Sigma project and article increase day by day. If we investigate Six Sigma project results which are published in big companies, lots of big and global firms save their cost and gain big earnings with their results of Six Sigma studies and projects. For example, according to wikipedia.org, we can create a table as “Table 2.1”. These firms gain the millions of dollar in a few years with their Six Sigma projects.
Table 2.1 Example of Company Earnings with Six Sigma Project (Wikipedia.org)
Company Earnings (US $)
Motorola 2,2 Billion 2,6 year
ABB 900 Million 1 year
Allied Signal 1,2 Billion 2 year
GE 2,2 Billion 4 year
Nokia 300 Million 2 year
Sony 100 Million 1 year
For Six Sigma literature research, In 2012, Thomas J. Zugelder, (The Ohio State University) and Qun Zhang and his friends (University of Southern Queensland) have academic research about Six Sigma Literature. According to Zugelder, at the end of the 90s, the number of article about Six Sigma seriously rises. In “Figure 2.1” is showed rise of Six Sigma articles according to Google Search (Thomas J. Zugelder, 2012)
Figure 2.1 Time Series of Google Search “Six Sigma”(Thomas J. Zugelder, 2012)
In addition to this results, Qun Zhang, and his friends handled the subject from the other side and they classified the Six Sigma article and projects. According to their research, out of total 116 Lean Six Sigma relevant found research publications, there was 66 (53%) papers were case study based while 50 (47) % papers were theory based. “Figure 2.2.”Shows the focus area of implementation of Six Sigma mainly has been Process improvement (ijcrb.webs.com)
Also, their second analysis showed that Six Sigma research differs from developed countries and developing countries.
Figure 2.3 Country distribution of Six Sigma publications (Qun Zhang, 2012)
“Figure 2.3” is about Six Sigma Topics. The usage area of the Six Sigma is generally in manufacturing in Turkey. But Six Sigma use in many business sectors in the world, “Figure 2.4” shows the usage Industry distribution of Six Sigma.
Table1.2 Country Focus Industry and Focus Area (Muhammad Irfan 2012)
In “Table 2.2” Country Focus Industry and Focus Area is showed (Muhammad Irfan 2012) According to “Table 2.2”, as we mentioned, Six Sigma project is generally used in the manufacturing sector in Turkey. This is a bias that must be broken today.
Figure 2.5 Six Sigma Time-Line (Advanced Systems Consultants, 2009)
After the widespread of using Six Sigma methods, countless projects has been made in various business sectors. Depending on this spread, the number of academic articles increased in the 90s Six Sigma was only a tool for increasing quality, then it is started to use every process.
Hahn and his friends (1999) mentioned in their articles and books that, using Six Sigma tools provided an advantage in every business sector. These tools provided career development, especially for the statisticians.
Deshpande and his friends (1999) proved that using Six Sigma methods in processes increased the number of the error, improved customer satisfaction and increased market share and employee well-being with their project in chemical industry.
Blakeslee (1999) made a statement in an article, using Six Sigma methodology provided superiority on competitors. He demonstrated this idea with a comparison between two baggage handling processes.
Chen and his friends (1999) used Six Sigma methodology in casting industry to improved product and design quality.
Nevalainen and his friends (2000) used Six Sigma methodology in a pathology laboratory to improve their laboratory performance.
Pande and his Friends (2000) created a road map for many companies to improved Six Sigma in all industry.
De Mast (2000) adapted new statistical methods to Six Sigma ideology and he showed the benefits of these statistical methods.
Wyper and Harrison (2000) used Six Sigma methodology in Human Resource Department for true wage policy, true employment, time management and workload. In result of the project, personal cost %34 reduced and they save 250.000Pound from general expenses. Calcutt (2001) mentioned Six Sigma achievements of big companies in his article such as; Motorola, Signal (Honeywell), ABB, Black&Decker Bombardier, Allied, General Electric. And with his article, he guided the other companies about how they should apply Six Sigma in their businesses.
Hoerl (2001) explained Six Sigma roles such as Master black belt, black belt, green belt and he improve this role.
Neuscheler and Norris (2001) explained five important points to gain financial success on Six Sigma projects.
Gross (2001) explained why all employee should be a participation in the Six Sigma project and he demonstrated the importance of this participation in his article.
Chowdhury (2001) explained 5 steps of Six Sigma and he defended that all steps should be simple and every employee should understand this methodology
Baczewski (2005) compared in his article; Six Sigma, ISO, Benchmarking, Lean Management. Then he showed advantages and disadvantages of these ideologies
Banuelos and his friends (2005) completed a Six Sigma project in the manufacturing sector, they show step by step their project phases and at the end of the project their cost save 50K euro.
Fort Wayne Municipality in India (2005) used Six Sigma in 2005 to improve their municipal service and to reduce the waiting time. This project has selected a successful study in India. D’Angelo and friends (2007) applied the Six Sigma methodology to improve after sales service sector. Their main target was zero error in the service.
Janet Jacobsen (2011) presented a Six Sigma project in Ford Motor Company. Ford’s consumer-driven Six Sigma strategy involved regular analysis of scorecard metrics to detect performance trends. During a routine metrics review, officials at the organization’s Saarlouis, Germany, plant discovered an escalation in basecoat paint consumption. Not only was the upsurge driving production costs higher, but it also pointed toward increased solvent consumption, which in turn led to higher levels of volatile organic compound emissions. An At the end of the project the team exceeded all project goals and they published a exceeded chard. The results of project is showed in “Table 2.3”
Table 3.3 Results of Janet Jacobsen project (Ford Motor Company,2012)
The project earned finalist honors, and team members had the opportunity to present their project at the 2011 World Conference on Quality and Improvement.
Like these examples, a lot of Six Sigma project leader and academicians contribute Six Sigma project spreads. Every after year, the number of Six Sigma project rises very fast, because of today all big companies like Ford, Caterpillar, and other firms, have a Six Sigma department and educate many Green Belts, Black Belts or Master Black Belts. Today, these firms have countless Six Sigma project. In our Country, Turk Firms especially which have foreign partners, use Six Sigma tools and apply their processes.
Borusan was a good example for the spread of Six Sigma culture in Turkey. In 1994, Borusan first met Six Sigma methodology by the agency of Caterpillar. With the decision of Ahmet Kocabıyık who is the Chairman of Borusan, Six Sigma culture spread in Borusan. First projects raised in Borusan Makina ve Güç Sistemleri then, other Borusan group companies
started to use 6 sigma methodology. Today more than 550 projects had already finished in Borusan and these projects provide over 55 Million saving.
According to Agah Uğur who is the CEO of Borusan, the company growth by %36 and the profit increased by %60 after Borusan met the 6Sigma Culture. These in formations was located on Borusan website.
As a conclusion, Six Sigma methodology and tools not only used manufacturing sector but also used very sector. It is enough having a problematic process and an enthusiastic project team for starting a Six Sigma project.
2.1. Six Sigma Concept
Six Sigma is a successful methodology for seeking continuous improvement in consumer loyalty and benefit. It is a management philosophy endeavoring to improve viability and proficiency. Additionally, Six Sigma is an exceedingly trained process that helps us focus on creating and conveying close impeccable items and services. The focal thought behind Six Sigma is that on the off chance that you can gauge what number of " defects" you have in a procedure, you can efficiently make sense of how to dispense with them and get as near " zero defects " as could be allowed.
2.2. Features of Six Sigma
Six Sigma's point is to dispose of waste and inefficiency, in this manner expanding consumer loyalty by delivering what the customer is expecting. Six Sigma follows a structured methodology and has defined roles for the participants. Six Sigma is an information-driven procedure and requires accurate data collection for the processes being analyzed. Six Sigma is about putting comes about on Financial Statements. It is shown normal distribution of Six Sigma “Figure 2.6”
Six Sigma is a business-driven, multi-dimensional organized approach for enhancing forms, bringing down deformities, lessening process changeability, decreasing expenses, and expanding consumer loyalty, expanded benefits, and improving processes.
The word Sigma is a factual term that measures how far a given procedure goes amiss from flawlessness. It is shown sigma levels in “Figure 2.7”
Figure1.6 6 Sigma Normal Distribution (media.licdn.com)
Figure1.7 Sigma Levels
2.3. Concepts of Six Sigma
Critical to Quality: Ascribes most vital to the client. Variation: What the customer feels and sees.
Process Capability: What your procedure can convey. Defect: Neglecting to convey what the client needs.
Design for Six Sigma: Outlining to address client issues and Process ability.
Stable Operations: Guaranteeing steady, unsurprising procedures to enhance what the client sees and feels.
Figure1.8 Concepts of Six Sigma
2.4. Role of Six Sigma
2.4.1. Sponsor
Is usually a high-level or senior business leader or executive who sponsors the Six Sigma engagement. Responsible for articulating the problem statement, defining the team’s objectives and validating the business case in the project charter. Sponsors are the liaison between the team and senior management and thus responsible for securing subject matter experts and non-Six Sigma resources critical to the success of the project. Is looked to for decisions at critical times at the project. The sponsor’s approval is required at DMAIC tollgates.
2.4.2. Champion
Middle or senior executive who sponsor and promote continuous improvement initiatives throughout their organization. Secures training and mentorship for Black Belt candidates and makes sure that resources are available for projects. Resolves any cross-functional team issues that may occur. Trained in the basics of Six Sigma. Sometimes filled by former Black Belts or Master Black Belts. Occasionally the Champion may also Sponsor projects or programs.
2.4.3. Master Black Belt
100% allocated professional with tremendous experience as a Black Belt leading teams and completing projects. A true expert in Six Sigma methodology and tools. Six Sigma Master Black Belts often mentor aspiring black belts and consult and remove obstacles from Black Belt teams. Has a responsibility to champions for keeping a portfolio of initiatives on track. Certifications offered from ASQ, Villanova, and IASSC.
2.4.4. Black Belt
100% allocated professional trained in DMAIC and other problem-solving methodologies. Has project management, statistical and process analysis skill sets. Trained in both the science of and soft skills needed in bringing about change. Responsibilities often include training green belts and other black belt candidates, and leading Six Sigma projects. Black Belts may also serve as internal consultants helping multiple teams at once. Job duties sometimes include training other employees in tools, techniques, and processes.
2.4.5. Process Owner
Professional, often a senior business leader, responsible for the business process that is the target of a Six Sigma project. Sometimes the process owner may be the sponsor of the initiative.
2.4.6. Expert Green Belt
A professional with introductory Six Sigma training partially allocated to an initiative. Maybe a team member on a Black Belt project or lead a smaller project.
2.4.7. Green Belt
Member of the team working directly with the Expert Green Belt. “Figure 1,9” shows the relation between role of Six Sigma
Figure 2.9 Relation Between Role of Six Sigma (Borusan Six Sigma Guide)
2.5. Methodology
Six Sigma has two key methodologies;
2.5.1. DMAIC Methodology
DMAIC: It alludes to an information-drove quality procedure for enhancing processes. This approach is utilized to enhance a current business prepare. This methodology consists of the following five steps. 1-Define > 2-Measure > 3-Analyze > 4-Improve > 5-Control Define: Define the issue or venture objective that should be tended to.
Measure: Measure the issue and process from which it was delivered.
Analyze: Analyze information and procedure to decide underlying driver of imperfections and openings.
Improve: Improve the procedure by discovering answers for settle, decrease, and anticipate future issues.
Control: Implement, control, and manage the change DMAIC five step is shown in “Figure 2.10”
2.5.2. DMADV Methodology
DMADV: It alludes to an information-drove quality technique for outlining items and procedures. This strategy is utilized to make new item plans or process outlines in a manner that it brings about a more unsurprising, develop and deformity free performance. Solutions to keep the procedure on the new course. This technique comprises of five stages:
1-Define > 2-Measure > 3-Analyze > 4-Design > 5-Verify
Define: Define the Problem or Project Goal that should be tended to. Measure: Measure and decide clients' needs and details.
Analyze: Analyze the process to meet the customer needs. Design: Design a procedure that will address clients' issues.
Verify: Verify the outline execution and capacity to address client issues. DMADV five phase is shown in “Figure 2.11”
2.5.3. DFSS Methodology
DFSS is a separate and emerging discipline related to Six Sigma quality processes. This is a systematic methodology utilizing tools, training, and measurements to enable us to design products and processes that meet customer expectations and can be produced at Six Sigma Quality levels. This methodology can have the following five steps.
1-Define > 2-Identify > 3-Design > 4-Optimize > 5-Verify Define: Define what the clients need, or what they don't need. Identify: Identify the client and the venture.
Design: Design a procedure that addresses clients' issues. Optimize: Determine prepare ability and upgrade the outline. Verify: Test, confirm, and approve the plan.
Figure 2.10. DMAIC five phase (Borusan Six Sigma Guide)
Figure 2.11. DMADV five phase (Borusan Six Sigma Guide)
2.6. The Development of Six Sigma Concept
The foundations of Six Sigma as an estimation standard can be followed back to Carl Friedrich Gauss (1777-1855) who presented the idea of the typical bend. Six Sigma as an estimation standard in item variety can be followed back to the 1920's when Walter Shewhart
demonstrated that three sigma from the mean is the point where a procedure requires redress. Numerous estimation models (Cpk, Zero Defects, and so on.) later went ahead of the scene, however, credit for begetting the expression "Six Sigma" goes to a Motorola design named Bill Smith. (By chance, "Six Sigma" is a governmentally enlisted trademark of Motorola). In the early and mid-1980s with Chairman Bob Galvin in charge, Motorola engineers chose that the customary quality levels — measuring absconds in a large number of changes – didn't give enough granularity. Rather, they needed to gauge the imperfections per million open doors. Motorola built up this new standard and made the system and required social change connected with it. Six Sigma helped Motorola acknowledge effective main concern brings about their association – truth be told, they recorded more than $16 Billion in reserve funds therefore of our Six Sigma endeavors.
From that point forward, a huge number of organizations around the globe have embraced Six Sigma as a method for working together. This is an immediate aftereffect of a hefty portion of America's pioneers transparently applauding the advantages of Six Sigma. Pioneers, for example, Larry Bossidy of Allied Signal (now Honeywell), and Jack Welch of General Electric Company. Talk has it that Larry and Jack were playing golf one day and Jack wager Larry that he could execute Six Sigma quicker and with more noteworthy outcomes at GE than Larry did at Allied Signal. The outcomes represent themselves. Six Sigma has advanced after some time. It's more than only a quality framework like TQM or ISO. It's a method for working together. As Geoff Tennant depicts in his book Six Sigma: SPC and TQM in Manufacturing and Services: "Six Sigma is numerous things, and it would maybe be less demanding to run down every one of the things that Six Sigma quality is most certainly not. Six Sigma can be viewed as: a dream, a logic, an image, a metric, an objective, a procedure, a philosophy." We couldn't concur more.
Most of World's leading brands using 6 sigma in your business; this brands such as; Motorola, Caterpillar, 3M, IBM, Volkswagen, Nokia, P&G, John Deere, Ford, Honda, Hitachi, , Jaguar Dupont, Dow Chemical, LG, Johnson & Johnson, Pfizer, Raytheon, , Sun Microsystems, Delphi Bombardier, Rexam, , Cisco, Alcan, Toshiba, General Electric, Allied Signal, Lockheed Martin, , Texas Instruments, General Electric, BMW, Merck Bristol-Myers, , Xerox, HP, Lexmark, Intel, NCR, Oracle, ABB, Squibb , HTC,Apple Computer, Alstom, York International, Autoliv, , Volvo, Boing, Whirlpool Black&Decker, Perkins,
Chevron, SonyEricson, Mercedes-Benz Coca-Cola, Pepsi-Co, McDonald’s, Kellogg, Colgate-Palmolive, Merck Wyeth, Lill, Schering-Plough, Bausch&Lomb, Baxter International, Samsung, GlaxoSmithKline, BP, Shell.
Some example from Turkey Bands; Borusan Grubu, Koç Grubu, Bosch-Profilo, Aselsan, Arçelik, TEBA, TEI (Tusas Motor Sanayi A.S.), , Eczacıbası-Vitra, Kordsa, Klimasan, , BOS (Birlesik Oksijen Sanayi), Ford Türkiye, Petrol Ofisi, , Shell, Kalekim, Çimtas.
2.7. Phase of Six Sigma
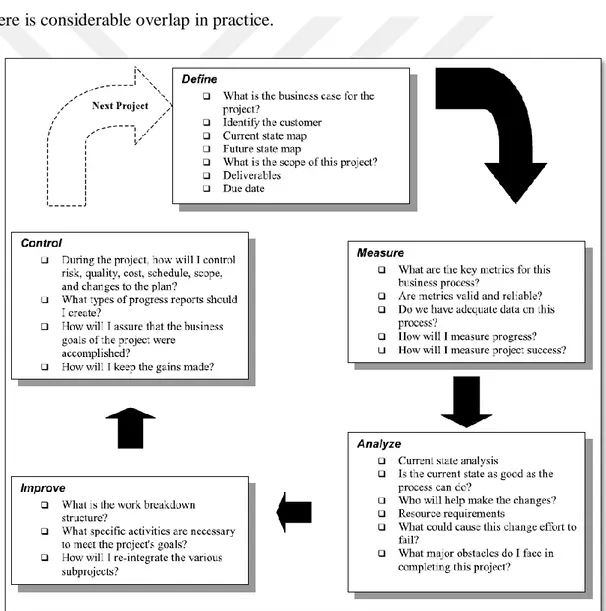
There are five main steps in the implementation of Six Sigma to improve the outputs. “Figure 2.12”shows a partial listing of tools often found to be useful in a given stage of a project. There is considerable overlap in practice.
2.7.1. Define Phase
Define the goals of the improvement activity. The most important goals are obtained from customers. In this phase, the project team defines the scope of project, project goals, inputs, and outputs of the study. Then a project timeline and the chart are submitted. The aims should be realistic and measurable. In this phase mainly tree point should be careful, this points; The selected project should be convenient to the facilities.
The project should be tangible return and improve the quality or productivity. The problems should be well defined.
At the top level, the goals will be the strategic objectives of the organization, such as a higher ROI or greater customer loyalty, greater employee satisfaction or increased market share. At the operations level, an objective may be to build the throughput of a generation division. At the project level, objectives may be to decrease the imperfection level and increment throughput for a specific procedure. Get objectives from direct correspondence with clients, shareholders, and workers. Picking the right team members can be a difficult decision, especially if a project involves a large number of departments. Every project has customers. The customer is the beneficiary of the item or administration of the procedure, focused for development. Every customer has one or multiple needs from their supplier.
At the conclusion of the design phase, you should know who the end-user or the customer is, prerequisites or their resistance issues. The project team should also have a clear understanding of goals in addition to this, the scope of the project should including budget, deadlines and time constraints. The tools used in the identification phase are as follows; Matrix diagram
Process map
SIPOC diagram
Nominal group technique Relationship diagram Product analysis Voice of the customer
2.7.2. Measure Phase
During the Measure Phase, the current performance of the current business process is measured. There are three essential parts of measure phase. Data collection should be prepared to collect the data. What type of data we need to be collect should include in measurement plan. The reason to collect data is to identify areas where current processes need to be improved. The project team should collect data from three main origin: input, process, and output.
Output: Measurements made on the printout (eg: customer complaints) give faster results and have long-term effects (eg: customer satisfaction).
Process: The traceability which is most helpful in determining the process problems of the Six Sigma tool is the step which is much more.
Input: Six Sigma tools need to measure on the inputs since a problem in the inputs will be reflected in the output of the process.
At this stage, with the collected data, the current sigma level can calculate. It gives an approximate number of defects. Sigma level can calculate DPMO formula (Defective Per Million Opportunities)
Table 2.4 Formula of DPMO
Instruments used in the measurement phase; Troll diagram
Pareto scheme Descriptive statistics Z tests
2.7.3. Analyze Phase
In the Analyze Phase, measurement data’s is examined to understand the main problem of the project subject. Basic problem-solving techniques are used in this stage. To find the root causes shows us which problem and rootcauses should be carried to improvement phase. Analyze tools should be; Correlation, T-test, Chi-square test, F-test, Hypothesis tests, Confidence intervals, Analysis of variance (ANOVA), Histogram, Fishbone diagram. We consider five specific types of analyses that help to promote the goals of the project. These are source, process, data, resource, and communication analysis. Now we will see them in detail.
2.7.4. Improve Phase
In the improve phase, improvement activities and changes are determined to create new project process maps in addition to this statistical methods should be used to validate the improvement. The measures which are used for overcoming the root causes of the problem are tried and put into practice. As a result of these applications, good satisfaction, better programming, better equipment should be planed. Identify high gain alternatives:
Create criteria to assess competitor change arrangements. Think efficiently and comprehensively.
Organize and assess the competitor arrangements against the arrangement assessment criteria.
Direct a possibility appraisal for the most noteworthy esteem arrangements.
Create preparatory arrangement courses of events and money saving advantage examination to help in suggestion presentation and future execution arranging.
However, we may need to utilize extra devices too These Tools used in this phase; Creativity
Data collecting Flow diagrams Experimental design Hypothesis testing
2.7.5. Control Phase
At the control phase, implemented the improvement plan, obtained results are evaluated. If these results are desired results, the new process is spread. In control phase, control the future state procedure to guarantee that any deviations from the objective are remedied before they result in imperfections. Implement control systems such as statistical process control, production boards, visual workplaces, and continuously monitor the process. This procedure is rehashed until the sought quality level is acquired.
Quality Control, A definitive reason in control is the general confirmation that an elevated requirement of value is met. Client's desires rely on upon this, so control is characteristically connected with quality. Since the motivation behind Six Sigma is to enhance the general procedure by lessening absconds, quality control is the basic strategy for keeping the entire procedure on track; for empowering us to spot inconvenience and settle it; and for judging how successfully the venture was executed and actualized. Quality is at the heart of Six Sigma rationality. Diminishing imperfections has an inseparable tie to taking a stab at flawlessness.
Standardization, Standardization or institutionalization empowers procedures to go as easily as would be prudent. In an assembling domain, the estimation of institutionalization has been demonstrated again and again.
Control Methods and Alternatives, The advancement of another procedure of any change to a current procedure requires the improvement of techniques to control work process. At the point when a procedure can't be overseen in a typical way, we have to concoct choices, shy of compelling consistency to the institutionalized strategy.
Tools used in control phase;
Control chart
Flow diagram
Data collecting
Quality control
2.8. Technical Tools
Six Sigma tools commonly used in each phase of a project. On “Table 2.5” is shown tool lists of the Six Sigma
2.8.1. Six Sigma Project Charter
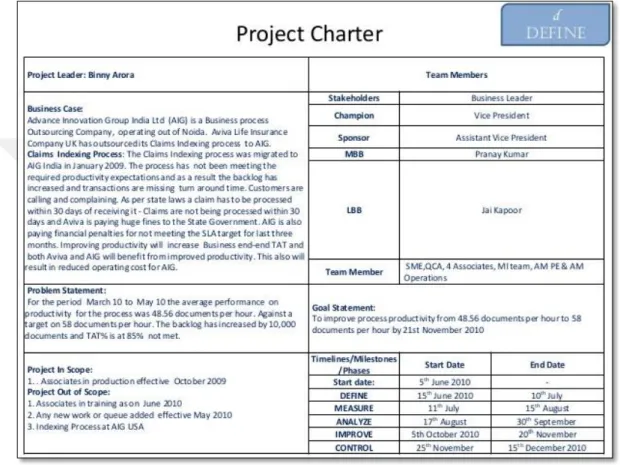
The project charter is the first step in the Six Sigma Project. It is created in the Define of DMAIC and the project charter can represent the deciding moment an accomplished Six Sigma project. It can make it by specifying essential assets and limits that will, in turn, ensure success. In “Figure 2.13” is shown an example of Six Sigma project charter
Figure 2.13. Example of Six Sigma Project Charter (SlideShare.com)
2.8.2. Voice of the Customer (VOC)
The “voice of the customer” is a process used to capture the requirements/feedback from the customer (internal or external) to provide the customers with the best in class service/product quality. This procedure is about being proactive and continually inventive to catch the changing prerequisites of the clients with time.
The “voice of the customer” is the term used to describe the stated and unstated needs or requirements of the customer.
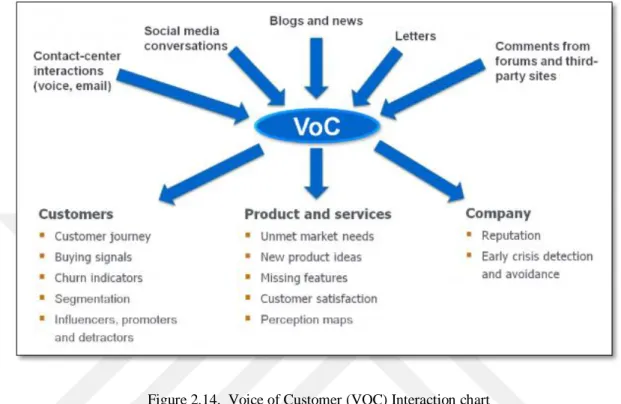
The voice of the customer can be captured in a variety of ways: Interviews or direct discussion, focus groups, surveys, observation, warranty data, customer specifications, complaint logs, field reports, etc. “Figure 2.14” shows the interaction of VOC
Figure 2.14. Voice of Customer (VOC) Interaction chart
(Analyzing the Voice of the Customer at the Sentiment Analysis Symposium-April/2014) 2.8.3. Quality Function Deployment (QFD)
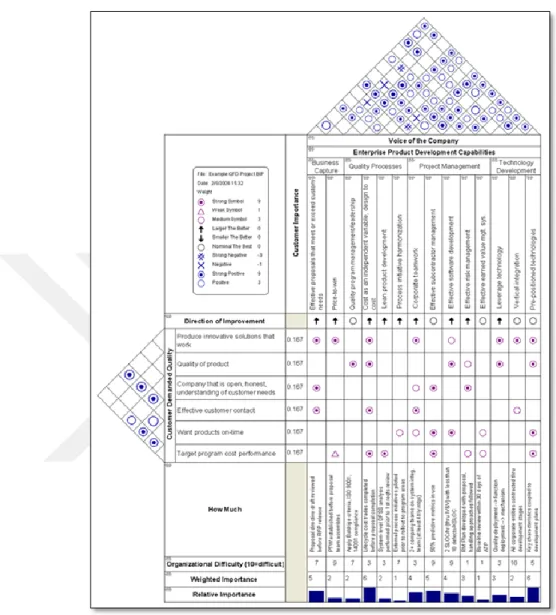
Quality function deployment (QFD) is a method to help transform customer needs (the voice of the customer [VOC]) into engineering characteristics (and appropriate test methods) for a product or service. It helps create operational definitions of the requirements, which may be vague when first expressed. It prioritizes each product or service characteristic while simultaneously setting development targets for the product or service. As described by Yoji Akao, who originally developed QFD in Japan in 1966, it is a "method to transform qualitative user demands into quantitative parameters, to deploy the functions forming quality, and to deploy methods for achieving the design quality into subsystems and component parts, and ultimately to specific elements of the manufacturing process.", The author combined his work in quality assurance and quality control points with function deployment used in value engineering.
QFD is applied in a wide variety of services, consumer products, military needs, and emerging technology products. The technique is also included in the new ISO 9000:2000
standard which focuses on customer satisfaction. An example of Quality House is shown in “Figure 2.15”
Figure 2.15. Quality House Example (House of Quality Matrix Software Example -conceptdraw.com)
2.8.4. SIPOC
In process improvement, a SIPOC (sometimes COPIS) is a tool that summarizes the inputs and outputs of one or more processes in table form.
The SIPOC is frequently introduced at the beginning of process change endeavors, for example, Kaizen occasions or amid the "define" phase of the DMAIC process. It has three ordinary users relying upon the group of project members:
To individuals in define another procedure.
To reacquaint individuals whose recognition with a procedure has blurred or turned out to be outdated because of process changes.
A few parts of the SIPOC that may not be promptly evident are:
The center is around catching the arrangement of sources of info and yields as opposed to the individual strides simultaneously.
Inputs and outputs might be materials, administrations, or data.
Suppliers and clients might be inner or outer to the association that plays out the procedure.
In “Table 2.6” is shown an example SIPOC for automobile repair.
Table 2.6 an example SIPOC for automobile repair
2.8.5. Benchmarking
Benchmarking is use to comparison, to determinate the goal and sampling with other companies. The destinations of benchmarking are to figure out what and where enhancements are called for, to investigate how different associations accomplish their elite levels, and to utilize this data to enhance execution. Robert Camp wrote one of the earliest books on benchmarking in 1989.
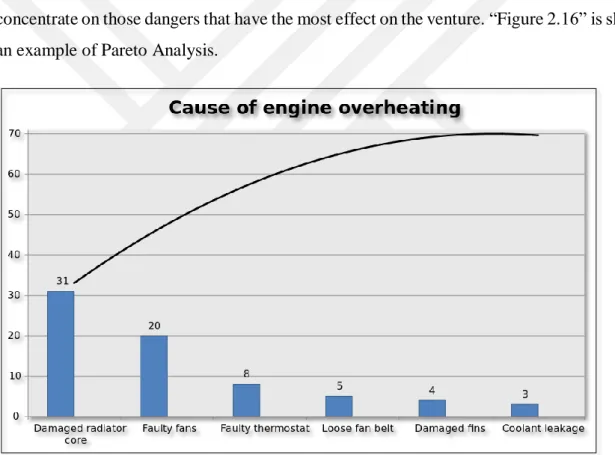
2.8.6. Pareto Analysis
Pareto investigation is a formal procedure valuable where numerous conceivable strategies are going after consideration. Basically, the issue solver gauges the advantage conveyed by every activity, then chooses some of the best activities that convey an aggregate advantage sensibly near the maximal conceivable one.
This system distinguishes the top bit of causes that should be tended to determine the greater part of issues.Management consultant Joseph M. Juran suggested the principle and named it after Italian economist Vilfredo Pareto, who noted the 80/20 connection while at the University of Lausanne in 1896, as published in his first paper, "Cours d'économie politique".
While it is regular to allude to pareto as "80/20" manage, under the supposition that, in all circumstances, 20% of causes decide 80% of issues, this proportion is simply an advantageous dependable guideline and is not nor should it be viewed as the unchanging law of nature.
The use of the Pareto investigation in risk administration permits the administration to concentrate on those dangers that have the most effect on the venture. “Figure 2.16” is shown an example of Pareto Analysis.
Figure 2.16 An Example of Pareto analyses
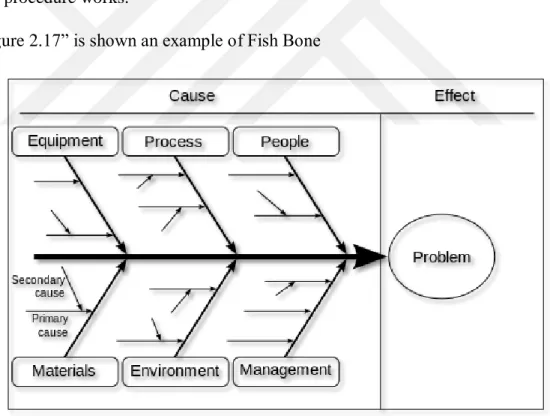
2.8.7. The Cause and Effect (Ishikawa Diagram or Fishbone) Diagram
Ishikawa diagrams (also called fishbone diagrams, herringbone diagrams, cause-and-effect diagrams, or Fishikawa) are causal diagrams created by Kaoru Ishikawa (1968) that show
the causes of a specific event. Basic employments of the Ishikawa graph are item outline and quality deformity counteractive action to recognize potential variables creating a general impact. Every cause or explanation behind defect is a wellspring of variety. Causes are typically gathered into significant classes to recognize these wellsprings of variety. The classifications regularly incorporate;
People: Anyone required with the procedure
Methods: How the procedure is performed and the particular necessities for doing it, for example, strategies, methods, guidelines, directions and laws
Machines: Any equipment, tools, computers, etc. required to accomplish the job Materials: Raw materials, pens, paper, parts etc. on used to create the last item Measurements: Data generated from the process that are used to evaluate its quality Environment: The conditions, for example, area, time, temperature, and culture in which
the procedure works.
In “Figure 2.17” is shown an example of Fish Bone
Figure 2.17 an Example of Fish Bone (timvandevall.com 2013 Dutch Renaissance Press LLC) 2.8.8. Brainstorming
Brainstorming is a gathering inventiveness strategy by which endeavors are made to discover a determination for a particular issue by social event a rundown of thoughts suddenly
contributed by its individuals. The term was advanced by Alex Faickney Osborn in the 1953 book Applied Imagination.
2.8.9. The Process Map
During the Define stage, the venture group makes the first of a few procedure maps. A procedure guide is a photo of the present strides in the process focused on development. A procedure outline five noteworthy classifications of work from the distinguishing proof of the providers of the procedure, the sources of info the providers give, the name of the procedure, the yield of the procedure, and the clients of the procedure. Each of these means is compressed as SIPOC to show the means to the group that must be directed to finish a procedure delineate. In addition, The first structured method for documenting process flow, the flow process chart, was introduced by Frank Gilbreth to members of ASME in 1921 as the presentation “Process Charts—First Steps in Finding the One Best Way”
3. IMPROVEMENT OF SCRAP PARTS TRACKING AND DESTRUCTION PROCESS FOR WARRANTY SERVICE
The “Dealer A” which provides sales and services in the area of the machinery and power systems since 1994 in Turkey.
According to the company regulation, it is forbidden to publish the company name in studies that contain internal data. For this reason, the company name could not be used in this thesis study. The data which is in this study have been revised for this reason. Therefore we used “Dealer-A” nickname for this company.
This Six Sigma project was developed for Warranty Department to improve scrap parts tracking for destruction and aims to prevent certain deficiencies at the warranty process. The warranty process starts with the customer failure notification. Then service team do trouble shooting and prepares the part list. After warranty confirmation, the machine is repaired.
At the end of the warranty processes, the scrap parts are taken from the customer, and the new parts are installed on the machine. The scrap parts should be returned the dealer’s warranty warehouse. Scrap parts are very important for the “Dealer-A” because these scrap parts should not be repaired and not be launched to the market. The dealer does service claims for these part to the manufacturer, using a claim administration system on SAP. All of the scrap parts lists, failure analysis, and work order numbers are added on claiming system. After doing warranty claim to the manufacturer, the cost of scrap parts which are replaced by new parts is paid by the manufacturer. According to the dealer contract the dealer have to destroy the scrap parts. The scrap parts should be stored for 2 months. The manufacturer company sometimes recalls some parts in this two months to investigate the failure. If the dealer couldn’t send the parts back, the manufacturer doesn’t pay the warranty claim payment.
The warranty process is one of the important processes for the dealer because this process both related to the customer, the dealer, and the manufacturer. This coordination should be perfect because this is directly related to the customer satisfaction, cost of warranty and dealer prestige. This is a DMAIC project so that we follows DMAIC five steps; Define > Measure > Analyze > Improve > Control
3.1 Define Phase
In the define phase; the project team, project charter, business cases, opportunity statement and the project plan published. Then, we started to create process maps with the project team. After creation of macro process map, we created micro process map and swimming line process map.
3.1.1. Project charter
The project charter consists of six titles; business cases, opportunity statement, goal statement, project scope, project plan, and project team. “Table 3.3” shows The Project charter this project.
3.1.1.1 Business Cases
The “Dealer-A” has 4 District Office (Ankara-İzmir-Gebze-Adana), 5 Branch Office (Trabzon-Antalya-Trakya-Bursa-Diyarbakır) ve 1 Special Project Area (3rd Airport in Istanbul). Totally, “Dealer-A” has 10 location and one Head Office. Also, “Dealer-A” has ten warranty engineer. At the head office, warranty and technical communication department provide management and coordination to 10 location.All warranty Engineers' KPI, warranty budget, and efficiency is calculated and is managed by head office. The head office has 2 Technical communications engineer (TC) and a warranty analyzer.
Scrap parts tracking and destruction process is an important process for warranty team. Because these scrap parts should be follow up from the “Dealer-A” and should not be repaired and should not launch on the market. The dealer does service claims for these part to the manufacturer, using a claim management system on SAP. All scrap parts lists, related failure stories, and the work order numbers are added to this claim system. After doing warranty claim to the manufacturer, the cost of scrap parts which are replaced by new parts is paid by the manufacturer. According to the dealer contract the dealer have to destroy the scrap parts. The scrap parts should storage only 2 months. The manufacturer company sometimes recall some parts in this two months to investigate the failure. If the dealer couldn’t send the parts to back, the manufacturer didn’t pay the warranty claim payment. The “Dealer-A” have no standard follow-up procedure for scrap parts. The current situation is caused complicated workload for warranty engineers. In addition to this, take a risk for audit processes. Because in current situation warranty engineer is responsible for warranty confirmation and scrap parts. Sometimes, the scrap parts send destruction process
prematurely, so that if the manufacturer company wants to the dealer to send these parts back the dealer wouldn’t send back the scrap parts. In this case, the manufacturer takes back the payment of warranty claim. These issues cause financial losses.
3.1.1.2. Opportunity Statement
Creating a standard and follow the able process for scrap parts tracking and destruction process, avoid to losing the parts, labor cost, and financial losses.
The manufacturer firm back the payment because of missing to send the part back; At 2014: $40.000
At 2015: $45.000
At 2016 3quarter: $35.000
With the new follow-up and control system we reduce these cost. Reducing time releases warranty engineer to do another task. Increase customer, audit department and employee satisfaction.
3.1.1.3 Goal Statement
Y: Excellence of improvement of scrap parts tracking and destruction process for warranty
X1: Personnel resource optimization
X2: Evaluation of electronic record facility (provision of SAP integration)
X3: Improvement of storage conditions
X4: Improvement in referral processes to manufacturer's warehouses with DHL
3.1.1.4. Project Scope
Inside: Machine all regions and branches
3.1.1.5. Project Plan
The project plane is shown in the “Table 3.1”.
Table 3.1 Project Plan Table
PHASE Start Finish Time(day)
Define 25.07.2016 18.08.2016 24 Measure 18.08.2016 10.09.2016 23 Analyse 10.09.2016 30.09.2016 20 Improve 30.09.2016 30.10.2016 30 Control 30.10.2016 19.11.2016 20 3.1.1.6. Project Team
The project team members is shown in “Table 3.2”
Table 3.2 Project Team Table
Adnan K. Sponsor Aybars A. Process Owner
Özgür A. Master Black Belt Ali A. Black Belt
Sina S. Financial representative Murat Can Atalay Expert Green Belt
Gamze K. Green Belt Demet E. Green Belt Pelin A. Green Belt Ali Y. Green Belt Ferhat V. Green Belt Ayfer Ş. Green Belt Yavuz K. Green Belt
Table 3.3 Project charter of the project
Goal Statement
Sponsor
Proje Fazı Start Finish Time(day) Process Owner
Define [D] Tanımlama 25.07.2016 18.08.2016 24 Master Black Belt Measure [M] Ölçüm 18.08.2016 10.09.2016 23 Green Belt Analyze [A] Analiz 10.09.2016 30.09.2016 20 Financial representative Improve [I] Geliştime 30.09.2016 30.10.2016 30 Expert Green Belt
Control [C] Kontrol 30.10.2016 19.11.2016 20 Green Belt Green Belt Green Belt Green Belt Green Belt Green Belt Green Belt Project Scope
Improvement of Scrap Parts Tracking and Destruction Process for Warranty
Business Casse Opportunity Statement
The Dealer-A has 4 District Office (Ankara-İzmir-Gebze-Adana), 5 Branch Office (Trabzon-Antalya-Trakya-Bursa-Diyarbakır) ve 1 Special Project (3rd Airport in Istanbul) totally have 10 location. Also the dealer have a warranty engineer at all locations, totally 10 warranty engineer. The head office warranty and technical communication department provides management and coordination to these 10 location. All KPI’s, warranty budget, warranty excellence programs efficiency is calculate by this department. The head office have 2 Technical communications engineer (TC) and a warranty analyzer. Scrap parts tracking and destruction process is an important process for warranty team. Because these scrap parts should be chased from the firm and should not be repaired and should not launch to the market. The dealer claim this part to manufacturer on a system adding parts list, warranty issue and all the detail about the failure. All scraped parts’ price which changed from the warranty processes take from the producing company and also according to the dealer contract our firma have to destroy the scraped parts. The scraped parts should storage 2 months. The manufacturer company sometimes recall this parts in this two months to investigate the failure. If the dealer couldn’t send the part back, the manufacturer didn’t pay the warranty claim.
The dealer have no standard follow-up procedure, this situation cause heavy and complicated workload to warranty engineer. In addition to this, take risk for audit processes. Because, in current situation warranty engineer is responsible from warranty confirmation and scrap parts.
Sometimes, these scrap parts send destruction process prematurely, so that if the manufacturer company wants to send these part back form the dealer, the dealer wouldn’t sent beck the scrap parts. In this case, the manufacturer take back the payment the warrant claim. These issue cause financial losses.
Creating a standard and followable process for scrap parts tracking and destruction process, avoid to losing the parts, labor cost and financial losses.
The manufacturer firm back the payment because of missing to send the part back; At 2014: $40.000
At 2015: $45.000 At 2016 3quarter: $35.000
With the process new follow-up and control system we reduce these cost. Reducing time releases warranty engineer to do other task. Increase customer, audit department and employee satisfaction.
Y: Excellence of improvement of scrap parts tracking and destruction process for warranty X1: Personnel resource optimization
X2: Evaluation of electronic record facility (provision of SAP integration) X3: Improvement of storage conditions
X4: Improvement in referral processes to manufacturer's warehouses with DHL
Inside: Machine all regions and branches Excluded: Power Systems
Project Plan Project Team
Adnan K. Ali O. Sina S. Aybars A. Özgür A. Demet E. Pelin A. Yavuz K. Ali Y. Ferhat V. Ayfer Ş. Murat Can Atalay
3.1.2. Process Maps
The most important step is the creation of the process maps because it shows that how to moving on the project and it also show the project team where is the main problem.
3.1.2.1 Macro Process Map
The main process map type is macro process map. It shows the main steps of the process. Then, If is needed, the macro process maps transformed micro process map. “Figure 3.1” shows the macro process map of this project.
Figure 3.1 Macro Process Map of the project
The process starts with customer service request. The customer calls the service department to report their machines failure. If the machine in warranty periods, warranty engineer checks the machines information and sends the service team to the customer. Generally, a few customer get their machine directly to the service area. This is very costly and difficult process. Because the heavy duty machines hardly transport from one place to another. After the customer service request, the engineer sends the service team to customer area. The technicians control the machine and define the problem. Technicians decide that is it necessary to take the machine to the service area or they decide can this problem repair on the field. Generally, simple failures can repair in the customer field. If it is not possible to repair on the customer field, the machine is transported he dealer service area. Then, the technicians listed the required part list and start repair process, by the way, the warranty engineer open a warranty work order on SAP system. After the problem solved, the scrap parts are taken from customer machine and deliver to warrant engineer. These scrap parts
Process Subprocess Subprocess Subprocess Failure Report (in Warranty Period) From Customer
Consideration Repair from the customerScrap parts take Wait 2 month in Warranty scrap
part store Destroye Parts
Warranty Control ConsiderationWarranty Check to SIB list from the
manufacturer Destroye Parts
Sent the scrap part to manufacturer
also very important because our firm has to destroy scrap parts according to the dealer contract. Using or repairing these parts strictly prohibited by the manufacturer firm.
All the failure have to report to the manufacturer with claims. The manufacturer sometimes calls these parts back, and they publish a list which is call “Send It Back (SIB List)”. The engineer has to check the SIB List, before destruction. If the parts are included in SIB list, the parts are should send to the manufacturer with DHL firm. If the parts are not included in SIB list in two months, these parts have to be destroyed.
3.1.2.2 Micro Process Map
Micro process map helps the project team to see the most detailed steps. The expert green belt should take all the information about the process and should apply to process map. In addition to this, the team can decide to non-value and value process in that map. At multiple unitary structures, after the creation of micro process map, this map can test at all location. “Figure2.2” shows micro process map of the current process.
Figure2.2 Micro Process Map of Current Process NO NO YE S Ye s Ye s No no ye s Sen d s erv ice to the cus tom er Sen d Fie ld S erv ice Get to the W or ksh op ser vic e li st Sta rt Fa ilu re R ep or t Fr om C us to m er Do Pro du cts in W arra nty Peri od Ou tof W arr ant y Cov era ge -Pai d E m ploy m ent Op en -Tr ou ble shoo tin g -W or kor der İs it su ita ble for th e wa rra nty co ve ra ge ? is t he iss ue su ita ble fo r Re pa iro n th e F ield app rov al for W arr ant y W or kor der Sell the pa rt i n W arr ant y W or kor der ta ke th e ma ch ine at w ork sh op Rep aire d De live r sc rap pa rts to W arr ant y E ngin eer che ck the pa rt l ist Cl os ed the W or k or der Pla ce the sc rap pa rts to wa rra nty wa reh ou se tak e th e k ey of wa rra nty w are hou se from th e W arr ant y En gin er Pas te t he s cra p p arts list on th e sc rap pa rts Pre par e sc ra p p arts lis t fo r th e w arr an ty w are ho us e W ait 2 m on th i n wa rra ny wa reh ou se İs t he re an y SIB fo r th e pa rt Ad d th e D estr uct ion list Pre par e the SIB lab el Par tse nd th e des tru ction com pan y Giv eth e P art DH L fi rm for sen din g to M anu fac tur e Th eP art at t he m anu fac tur er Fir m C laim th e D H L İnv oic e De live rth e m ach ine to Cu stom er Trou bl eS ho otin g F orm Pr ep are clo se d w ork ord er f orm DH L in vo ice SIB Lis t
3.1.3. Unitary of the Process
The Project team wrote all operations step by step. Then all warranty engineers evaluated and compared their process steps to other location. At micro process flow diagram, all the step determined, controlled and checked. We have 29 step in our processes. These steps help the project about create “Swimlane Map”. “Table 3.4 “shows unitary of the process in regional based.
The list of all process in the micro process map;
1. Service request from the customer. ( start the process) 2. Check - Is product in warranty period?
3. Create a work order (trouble shooting work order) 4. Send service to the customer.
5. Prepare trouble shooting form.
6. Check –Is the failure suitable for the warranty coverage?
7. Approval for warranty work order
8. Sell the parts in warranty work order.
9. Check - Is the problem suitable for repair on the field? 10. Send field service.
11. Get to the workshop service list. 12. Take the machine at the workshop. 13. Check the part list.
14. Repaired.
15. Prepare closed work order form.
16. Deliver scrap parts to warranty engineer. 17. Closed the work order.
18. Prepare scrap parts list for the warranty warehouse 19. Paste the scrap parts list on the scrap parts
20. Take the key of warranty warehouse from the warranty engineer 21. Place the scrap parts to warranty warehouse
22. Wait two month in warranty warehouse
23. Check -Is there any sib for the part? 24. Add the parts destruction list 25. Part send the destruction company 26. Prepare the SIB label.
27. Give the part DHL firm for sending to manufacture.
28. Claim the DHL invoice.