SELF-ASSEMBLY OF PEPTIDE
NANOFIBERS AND THEIR MECHANICAL
PROPERTIES
A THESIS
SUBMITTED TO THE MATERIALS SCIENCE AND NANOTECHNOLOGY PROGRAM OF THE GRADUATE SCHOOL OF ENGINEERING AND
SCIENCE
OF BILKENT UNIVERSITY
IN PARTIAL FULLFILMENT OF THE REQUIREMENTS FOR THE DEGREE OF
MASTER OF SCIENCE
By
TURAN SELMAN ERKAL
July, 2012
ii
I certify that I have read this thesis and that in my opinion it is fully adequate, in scope and in quality, as a thesis for the degree of Master of Science.
Assoc. Prof. Dr. Mustafa Özgür Güler (Advisor)
I certify that I have read this thesis and that in my opinion it is fully adequate, in scope and in quality, as a thesis for the degree of Master of Science.
Assoc. Prof. Dr. Aykutlu Dâna (Co-Advisor)
I certify that I have read this thesis and that in my opinion it is fully adequate, in scope and in quality, as a thesis for the degree of Master of Science.
Assist. Prof. Dr. Ayşe Begüm Tekinay
I certify that I have read this thesis and that in my opinion it is fully adequate, in scope and in quality, as a thesis for the degree of Master of Science.
Assist. Prof. Dr. Fatih Büyükserin
Approved for the Graduate School of Engineering and Sciences:
Prof. Dr. Levent Onural
iii
ABSTRACT
SELF-ASSEMBLY OF PEPTIDE NANOFIBERS AND
THEIR MECHANICAL PROPERTIES
Turan Selman Erkal
M.S. in Materials Science and Nanotechnology
Supervisor: Assoc. Prof. Dr. Mustafa Özgür Güler
July 2012
Peptide nanofibers have been drawing attention because of their versatile, tailorable and functional properties in various research areas. The self-assembly mechanism of peptides and peptide amphiphile molecules is generally based on noncovalent interactions like hydrophobic, electrostatic and metal-ligand interactions. In this thesis, I investigated hydrophobic interaction of peptide amphiphiles (PAs) with other hydrophobic molecules and effect of pH change on self-assembly mechanism. The zinc phthalocyanine molecule was used as a hydrophobic probe to be encapsulated by peptide amphiphile molecules, which help to dissolve the molecule in water instead of an organic solvent. Charge neutralization of PAs by pH change led to nanofiber formation, which resulted in encapsulation and organization of zinc phthalocyanine molecules. The degree of self-assembly by pH change determined non-linear optical properties of zinc
phthalocyanine molecule. Besides, morphological, mechanical and
spectroscopic properties of phthalocyanine containing peptide nanofibers were characterized by TEM, SEM, oscillatory rheology, UV-Vis, fluorescence and circular dichroism spectroscopy.
iv
The mechanical properties of peptide and PA hydrogels and nanofibers have an essential place to determine applicability in different areas. Especially, PA and peptide molecules have been widely used in regenerative medicine studies and the stiffness of the extracellular matrix has a significant role on cellular behavior. In this thesis, viscoelastic properties of the peptide and PA gels were studied by oscillatory rheology. In addition to characterization of bulk mechanical properties of peptide gels, adhesion and stiffness of peptide nanofibers were determined by Atomic Force Microscopy.
Keywords: Peptide nanofiber, self-assembly, encapsulation, zinc
phthalocyanine, rheology, Atomic Force Microscopy, nanomechanical properties.
v
ÖZET
PEPTİT NANOFİBERLERİN KENDİLİĞİNDEN
DÜZENLENMESİ VE MEKANİK ÖZELLİKLERİ
Turan Selman Erkal
Malzeme Bilimi ve Nanoteknoloji Yüksek Lisans Tez Yöneticisi: Doç. Dr. Mustafa Özgür Güler
Temmuz 2012
Peptit nanofiberler değişik çalışma alanlarındaki çok yönlü, uyarlanabilir ve fonksiyonel özellikleri ile dikkat çekmektedir. Peptit ve peptit amfifil moleküllerinin kendiliğinden düzenlenme mekanizması genellikle hidrofobik, elektrostatik ve metal-ligand etkileşimleri gibi kovalent olmayan etkileşimlere dayanmaktadır. Bu tezde peptit amfifil moleküllerinin diğer hidrofobik moleküller ile etkileşimi ve pH değişimin kendiliğinden düzenlenme mekanizmasına etkisi incelenmiştir. Çinko ftalosiyanin molekülü peptit amfifillerin etrafını sarması ile kaplanan hidrofobik molekül olarak kullanılmıştır. Peptit amfifiller molekülün etrafını sararak molekülün organik çözücü yerine suda çözünmesini sağlamıştır. Peptit amfifillerin yüklerinin nötrlenmesi pH değişimi ile sağlanarak nanofiber oluşumu gerçekleştirilmiştir. Nanofiber oluşumu çinko ftalosiyanin molekülünün kapsül içinde kalmasını ve organize olmasını sağladı. Kendiliğinden düzenlenme derecesi çinko ftalosiyanin molekülünün doğrusal olmayan optik özelliklerini belirledi. Bunun yanında ftalosiyanin içeren peptit nanofiberlerin morfolojik, mekanik ve spektroskopik özellikleri geçirmeli elektron mikroskobu, taramalı elektron
vi
mikroskobu, salınımlı reoloji, ultraviyole-görünür ışık soğurma, floresans ışıma ve dairesel dikroizm spektroskopi ile karakterize edilmiştir.
Peptit ve peptit amfifil hidrojellerinin ve nanofiberlerinin mekanik özellikleri bu malzemelerin değişik alanlarda uygulanabilirliğinin belirlenmesinde elzem bir yere sahiptir. Özellikle peptit amfifil ve peptit molekülleri rejeneratif tıpta büyük ölçüde kullanılmaktadır ve ekstraselüler matriksin sertliği hücre davranışı üzerinde önemli rol sahibidir. Bu tezde peptit ve peptit amfifil jellerinin elastik özellikleri reoloji ile karakterize edilmiştir. Peptit jellerin genel mekanik özelliklerinin belirlenmesinin yanında peptit nanofiberlerinin yapışma ve sertlik özellikleri atomik kuvvet mikroskobu ile ölçülmüştür.
Anahtar Kelimeler: Peptit nanofiber, kendiliğinden düzenlenme, kapsüllenme, çinko ftalosiyanin, reoloji, Atomik kuvvet mikroskobu, nano mekanik özellikler.
vii
Acknowledgements
I would like to express my gratitude to my advisor Assoc. Prof. Dr. Mustafa Özgür Güler for his guidance, support and patience during this research.
I would also like to express my gratitude to my co-advisor Assoc. Prof. Dr. Aykutlu Dâna for his support and inspiring vision.
I would like to thank to Sezen Tekin, Ruslan Garifullin and Hakan Ceylan for their partnership in this research. I would also like to express my special thanks to Mustafa Ürel and Göksu Çınar for his partnership and extreme contribution in this thesis.
I would like to express my special thanks to Assist. Prof. Dr. Ayşe Begüm Tekinay for her support and sharing her knowledge.
I want to thank to all current and former members of Nanobiotechnology and Biomimetic Materials group for their support, friendship, knowledge and help during this research.
I would also like to thank to Gözde Uzunallı for her friendship and support that help aware of myself.
I would like to specially thank to Yavuz Selim Dağdaş, Ruslan Garifullin and Rashad Mammadov for their friendship and support that kept me vivid during rough times.
viii
LIST OF ABBREVIATIONS
PA: Peptide Amphiphile
FMOC: 9-Fluorenylmethoxycarbonyl
HBTU: 2-(1H-Benzotriazol-1-yl)-1,1,3,3-tetramethyluronium DIEA: N, N-Diisopropylethylamine
DMF: Dimethylformamide TFA: Trifluoroacetic Acid TIS: Triisopropylsilane
LC-MS: Liquid Chromatography-Mass Spectrometry AFM: Atomic Force Microscopy
TEM: Transmission Electron Microscopy
FT-IR: Fourier Transform Infrared Spectroscopy SEM: Scanning Electron Microscopy
ZnPC: Zinc Phthalocyanine
Q-TOF: Quadrupole Time of Flight ESI: Electrospray Ionization
HPLC: High Performance Liquid Chromatography TLC: Thin Layer Chromatography
THF: Tetrahyrofuran
DPBF: Diphenylisobenzofuran
ADMA: 2,2'-(anthracene-9,10-diyl)dimalonic acid CD: Circular Dichroism
ix ECM: Extracellular matrix
x
Table of Contents
ACKNOWLEDGEMENTS ... VII LIST OF ABBREVIATIONS ... VIII
CHAPTER 1. INTRODUCTION ... 2
1.1SELF-ASSEMBLY OF PEPTIDES ... 2
1.2RHEOLOGY ... 3
CHAPTER 2. ENCAPSULATION OF A ZINC PHTHALOCYANINE DERIVATIVE IN SELF-ASSEMBLED PEPTIDE NANOFIBERS ... 8
2.1INTRODUCTION ... 8
2.2EXPERIMENTAL... 9
2.2.1SYNTHESIS AND CHARACTERIZATIONS ... 9
2.2.2IMAGING TECHNIQUES ... 10
2.2.3UV-VIS SPECTROSCOPY AND FLUORESCENCE MEASUREMENTS... 11
2.2.4OSCILLATORY RHEOLOGY ... 11
2.2.5CIRCULAR DICHROISM (CD) ... 12
2.2.6SINGLET OXYGEN MEASUREMENTS ... 12
2.2.7FEMTOSECOND PUMP-PROBE MEASUREMENTS ... 13
2.2.8SAMPLE PREPARATION ... 13
2.3RESULTS AND DISCUSSIONS ... 14
2.3.1MORPHOLOGICAL CHARACTERIZATIONS ... 16
2.3.2SPECTROSCOPIC CHARACTERIZATIONS ... 30
2.4SUMMARY ... 42
CHAPTER 3. CHARACTERIZATION OF PEPTIDE NANOFIBERS’ MECHANICAL PROPERTIES ... 45
3.1INTRODUCTION ... 45
3.2EXPERIMENTAL... 46
3.2.1SYNTHESIS AND CHARACTERIZATIONS ... 46
3.2.2OSCILLATORY RHEOLOGY ... 48
3.2.2SAMPLE PREPARATION ... 49
3.2.3ATOMIC FORCE MICROSCOPY (AFM) AND NANOMECHANICAL CHARACTERIZATION ... 49
3.3RESULTS AND DISCUSSIONS ... 51
3.4SUMMARY ... 76
CHAPTER 4. CONCLUSIONS ... 78
xi
List of Figures
Figure 2.1 Schematic representation of ZnPc (1) encapsulation in PA (2)
nanostructures. ... 15
Figure 2.2 The chemical structure of PA and octakis (hexylthio) phthalocyaninato zinc (II)... 15
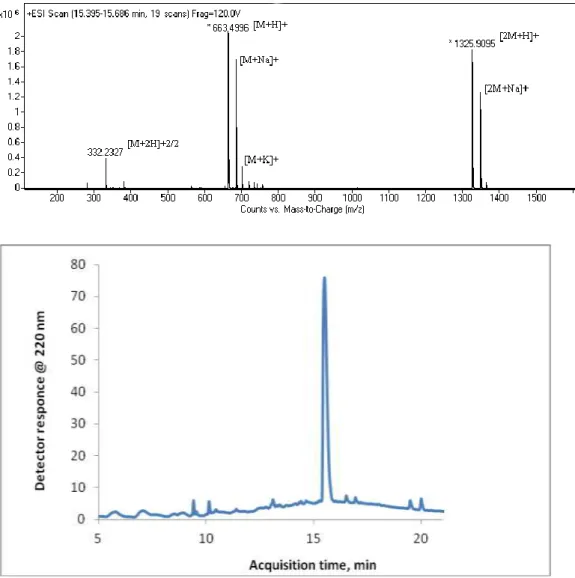
Figure 2.3 Mass spectrum (top) and LC chromatogram (bottom) of the PA molecule 2. ... 16
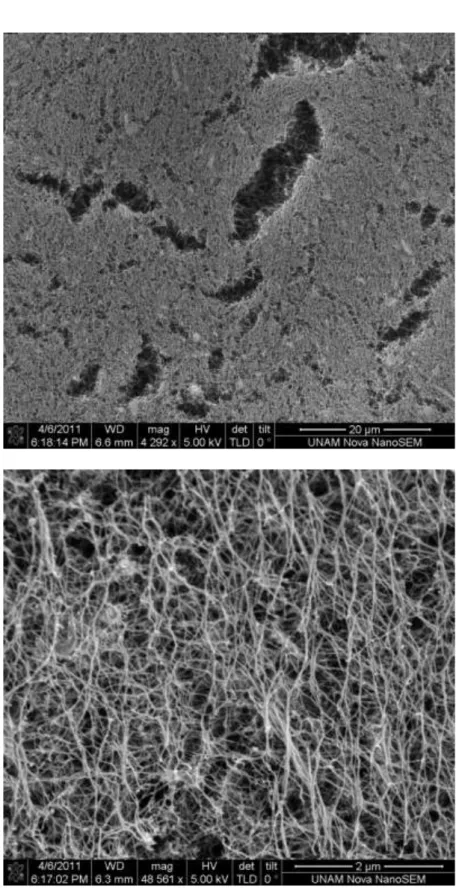
Figure 2.4 TEM (a) and SEM (b) images of the ZnPc – containing PA nanostructures. ... 18
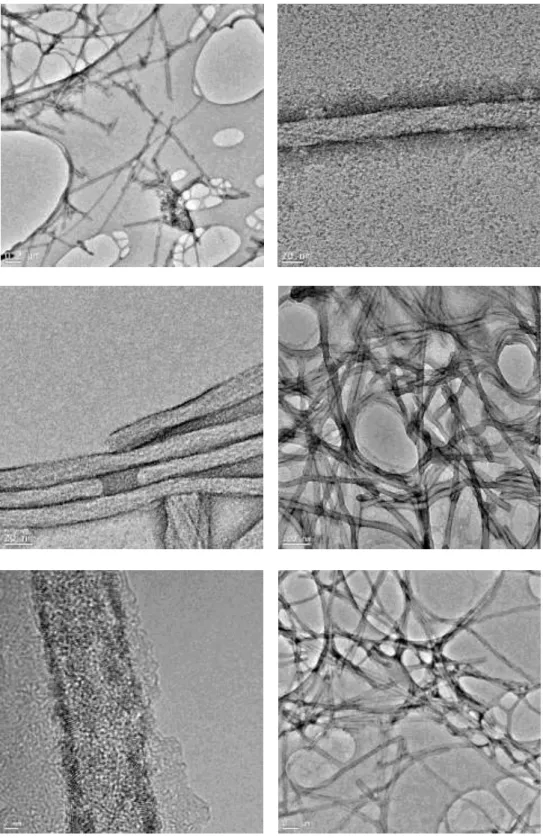
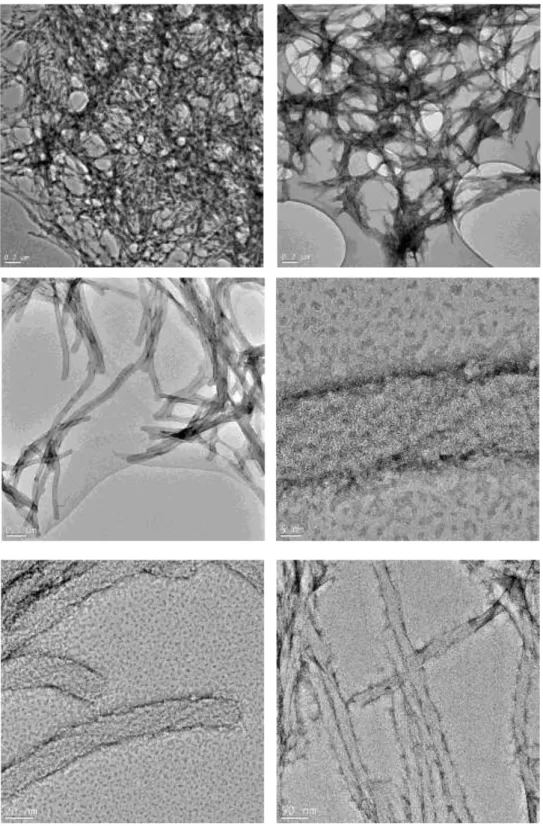
Figure 2.5 TEM images of ZnPc with PA at pH 5 (0.22 wt% PA). ... 19
Figure 2.6 TEM images of ZnPc with PA at pH 8 (0.22 wt% PA). ... 20
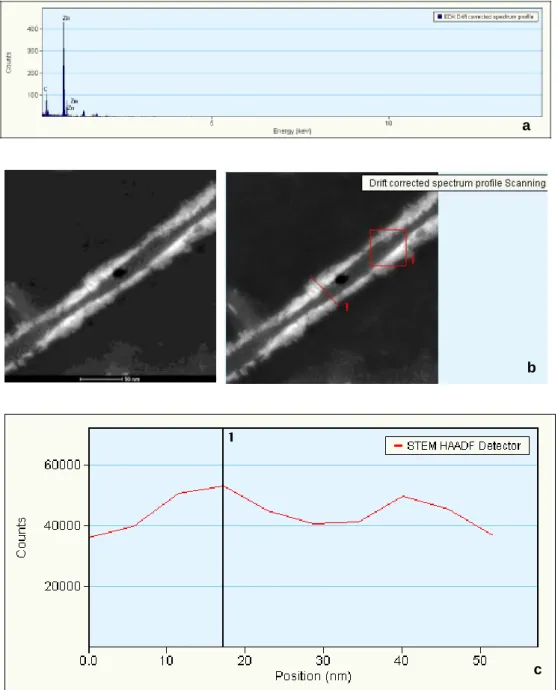
Figure 2.7 a) EDX spectrum of peptide nanofiber surface, b) scanned areas are shown, c) counts versus scan position graph of collected EDX spectrum. 21 Figure 2.8 Singlet oxygen measurement of ZnPc in THF, DPBF in THF, ZnPc within PA in water, ZnPc and DPBF within PA in water. a) DPBF in THF (at 414 nm), b) DPBF+ZnPc in THF (at 414 nm), c) ZnPc+DPBF with PA in water (at 418 nm), and d) ZnPc+PA with ADMA in water (at 381 nm). ... 22
Figure 2.9 Singlet oxygen measurement of ZnPc in THF. ... 22
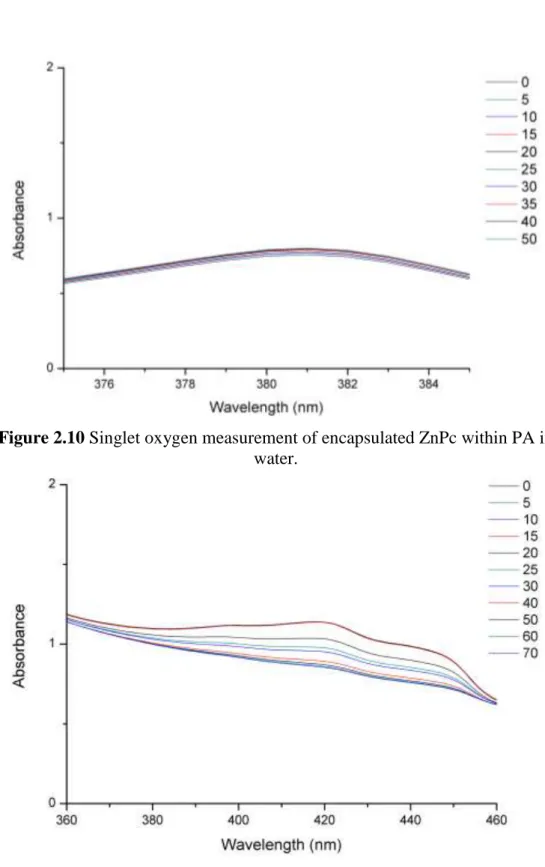
Figure 2.10 Singlet oxygen measurement of encapsulated ZnPc within PA in water. ... 23
Figure 2.11 Singlet oxygen measurement of encapsulated ZnPc and DPBF within PA in water. ... 23
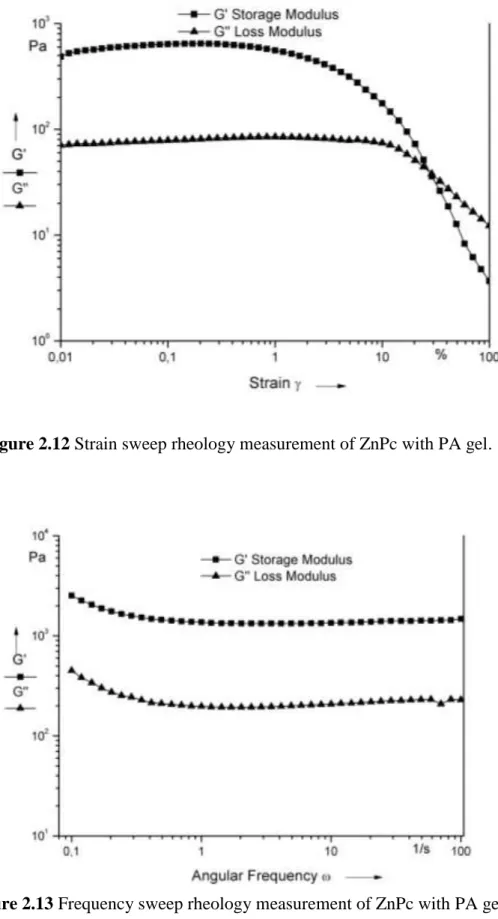
Figure 2.12 Strain sweep rheology measurement of ZnPc with PA gel. ... 25
Figure 2.13 Frequency sweep rheology measurement of ZnPc with PA gel. ... 25
Figure 2.14 Strain sweep rheology measurement of PA gel. ... 26
Figure 2.15 Frequency sweep rheology measurement of PA gel. ... 26
Figure 2.16 Cryo-SEM images of PA at pH 8 (0.1 wt%). ... 27
Figure 2.17 SEM images of critical point dried PA gel at pH 8 (0.6 wt%). ... 28
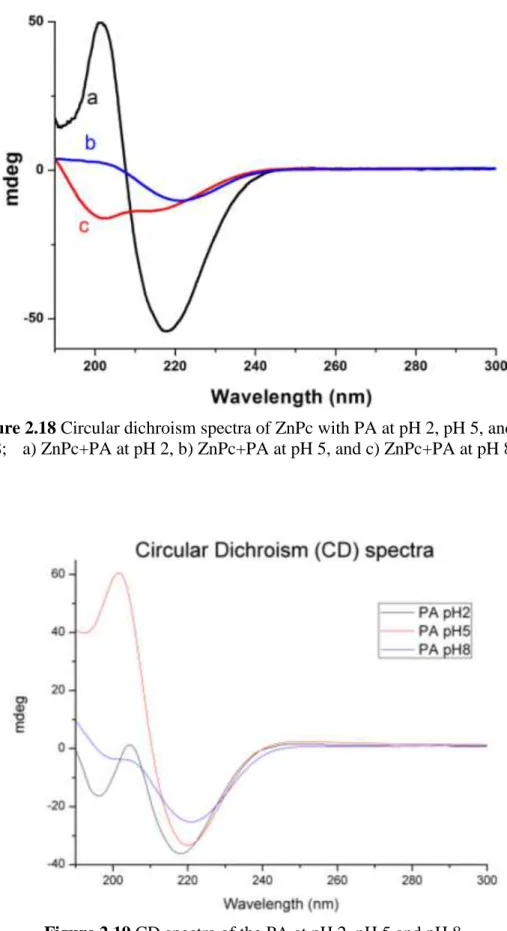
Figure 2.18 Circular dichroism spectra of ZnPc with PA at pH 2, pH 5, and pH 8; .... a) ZnPc+PA at pH 2, b) ZnPc+PA at pH 5, and c) ZnPc+PA at pH 8. 29 Figure 2.19 CD spectra of the PA at pH 2, pH 5 and pH 8. ... 29
Figure 2.20 Absorbance and fluorescence emission spectra of ZnPc with and without the PA molecules. a) ZnPc absorbance in THF, b) ZnPc with PA absorbance in water at pH 2, c) ZnPc with PA absorbance in water at pH 5, d) ZnPc with PA absorbance in water at pH 8, e) ZnPc fluorescence in THF, and f) ZnPc with PA fluorescence in water. ... 32
xii
Figure 2.21 UV-vis spectrum of ZnPc film. ... 33
Figure 2.22 Fluorescence emission of ZnPc in THF (λex = 633 nm). ... 33
Figure 2.23 Fluorescence emission of ZnPc with PA at pH 5 in water (λex = 673 nm). ... 34
Figure 2.24 Fluorescence emission of ZnPc with PA at pH 8 in water (λex = 600 nm). ... 34
Figure 2.25 Fluorescence spectra of ZnPc film (λex = 325 nm). ... 35
Figure 2.26 Fluorescence spectra of ZnPc film (λex = 592 nm). ... 35
Figure 2.27 Fluorescence spectra of ZnPc film (λex = 671 nm). ... 36
Figure 2.28 Time evolution of the nonlinear absorption of ZnPc in THF. ... 38
Figure 2.29 Pump-probe data as a function of time (y) and wavelength (x) for ZnPc in THF. The characteristic features of singlet ESA (A and C), triplet ESA (B) and stimulated emission and bleach (D) are indicated. Pump-probe data for ZnPc in THF revealed broad positive excited state absorption (ESA) bands superimposed with a deep negative signal, due to the ground state bleach and stimulated emission (SE). Similar results were also obtained for zinc phthalocyanine in DMSO and these signals were identified as bleach+SE (D), S1 → Sn1 ESA (C), S1 → Sn2 ESA (A), and T1 → Tn ESA (B). ... 38
Figure 2.30 Pump-probe data as a function of time (y) and wavelength (x) for ZnPc peptide at pH 2. ... 39
Figure 2.31 Pump-probe data as a function of time (y) and wavelength (x) for ZnPc peptide at pH 5. ... 39
Figure 2.32 Pump-probe data as a function of time (y) and wavelength (x) for ZnPc peptide at pH 8. ... 39
Figure 2.33 Transient absorption of sample with pH 5 monitored at 1.31 ps excitation with 690 nm, laser pulses with 1 µJ and 5 µJ energies... 40
Figure 2. 34 Time evolution of the excited state absorption signal at 585 nm of ZnPc in aqueous conditions with PA at different pH values. ... 40
Figure 2.35 Transient spectra of ZnPc. In THF (a), in H2O with PA at pH 2 (b), at pH 5 (c), at pH 8 (d). ... 42
Figure 3.1 The chemical structure of DopaK-PA (a), K-PA (b), E-peptide (c), and K-peptide (d) ... 52
Figure 3.2 Liquid chromatography and mass spectrometry result of DopaK-PA ... 53
Figure 3.3 Liquid chromatography and mass spectrometry result of E-peptide 54 Figure 3.4 Liquid chromatography and mass spectrometry result of K-peptide 55 Figure 3.5 Storage and loss modulus of PA gels ... 57
Figure 3.6 Crosslinking mechanisms of Dopa molecule ... 57
Figure 3.7 Time sweep rheology measurements of PA gels ... 58
Figure 3.8 Frequency sweep rheology measurements of PA gels ... 58
Figure 3.9 Rheology measurement of K-PA gel by changing temperature... 59
Figure 3.10 Rheology measurement of DopaK-PA gel by changing temperature ... 59
xiii
Figure 3.11 Rheology measurement of DopaK-PA/Fe(III) gel by changing
temperature ... 60
Figure 3.12 a) AFM image of K-PA, b) Adhesion map of K-PA, c) Elastic
modulus map of K-PA ... 62
Figure 3.13 a) AFM image of DopaK-PA, b) Adhesion map of DopaK-PA, c)
Elastic modulus map of DopaK-PA ... 63
Figure 3.14 a) AFM image of PA/Fe(III), b) Adhesion map of
DopaK-PA/Fe(III), c) Elastic modulus map of DopaK-PA/Fe(III) ... 64
Figure 3.15 a) AFM image of DopaK-PA 80 oC, b) Adhesion map of DopaK-PA 80 oC, c) Elastic modulus map of DopaK-PA 80 oC ... 65
Figure 3.16 a) AFM image of DopaK-PA/Fe(III) 80 oC, b) Adhesion map of DopaK-PA/Fe(III) 80 oC, c) Elastic modulus map of DopaK-PA/Fe(III) 80 °C ... 66
Figure 3.17 Adhesion Force (nN) Histogram of PA fibers during approach .... 67 Figure 3.18 Adhesion Force (nN) Histogram of PA fibers during retraction.... 67 Figure 3.19 Slope Histogram of PA fibers during approach ... 67 Figure 3.20 Slope Histogram of PA fibers during retraction ... 67 Figure 3.21 Storage and loss modulus of different concentrations of E+K
peptide hydrogels ... 69
Figure 3.22 Frequency sweep analysis of E+K peptide hydrogels (G′:storage
modulus, G′′:loss modulus) ... 70
Figure 3.23 a) AFM image of E+K fibers, b) Adhesion map of E+K fibers, c)
Elastic modulus map of E+K fibers ... 72
Figure 3.24 a) AFM image of E fibers, b) Adhesion map of E fibers, c) Elastic
modulus map of E fibers ... 73
Figure 3.25 a) AFM image of K fibers, b) Adhesion map of K fibers, c) Elastic
modulus map of K fibers ... 74
Figure 3.26 Adhesion Force (nN) Histogram of peptide fibers during approach
... 74
Figure 3.27 Adhesion Force (nN) Histogram of peptide fibers during retraction
... 75
Figure 3.28 Slope Histogram of peptide fibers during approach ... 75 Figure 3.29 Slope Histogram of peptide fibers during retraction ... 75
xiv
List of Tables
Table 2.1 Non-linear absorption decay time constants for ZnPc samples at different pH values. ... 41
1
Chapter 1
2
Chapter 1. Introduction
1.1 Self-assembly of peptides
Nature is an endless source of inspiration for the scientists to develop new materials and make new discoveries. Self-assembly mechanism is one of the important inspirations of nature and a pioneer of new era for synthesizing and designing novel materials, because the reactions in biological system are mostly based on self-assembly mechanism which forms wide variety of complex biological structures.1 Thus, the scientists are trying to understand the self-assembly mechanism and adopt this mechanism to synthesize and design materials. Self-assembly is a spontaneous reaction that take place to get desired structure and based on non-covalent interactions like hydrogen bonds, ionic bonds, hydrophobic and van der Waals interactions.2 Among other molecules peptides have a crucial place to study self-assembly because of their simple structure compared to nucleic acids, proteins and other biomolecules, diverse chemical and physical properties.3 The self-assembly characteristics of peptides based on chemical structure of peptide molecules which can have different amount and sequence of amino acids. Besides, the charged structure which is determined by the chemical structure of peptide molecules also influences the self-assembly characteristics. Since the self-assembly based on non-covalent interactions among peptide molecules, the environment of peptide molecules determines the structure and shape of desired peptidic materials. β-amyloid peptide is known as a source of Alzheimer’s disease because of the aggregation
3
of peptide molecules by forming β-sheet structure and in different solvents the degree of aggregation can be changed effectively.4 The pH of environment also influences the secondary structure of peptide molecules and circular dichroism characterizations indicate the transitions between α-helical and random coil structures.5 In another study the effect of salt on self-assembly of certain type of peptide is characterized by circular dichroism and concluded that by increasing the amount of salt the self-assembly of peptides is induced and transition from unfolded state to β-hairpin structure is observed.6 Moreover, molecular self-assembly of peptides can also be controlled temperature and light. Studies indicate that the effect of temperature on self-assembly can be characterized with the help of circular dichroism and rheology.7 In addition to temperature, Collier et. al presented thermally and photochemically induced self-assembly of peptide hydrogels.8 These different self-assembly mechanisms show the versatility and controllability of assembly of peptides. Due to superior self-assembly characteristics peptides are good candidate to be used as a versatile scaffold in tissue engineering.9-11
1.2 Rheology
The self-assembling of peptide molecules can be applied in different research areas and the characterization of the peptide molecules is very crucial to determine the usage. Thus, the mechanical property of peptide hydrogels can be characterized by rheology. Rheology is the analysis of the flow properties of material. Liquids clearly show their flow properties; additionally other materials can indicate their flow properties under applied stress. Actually, flow properties
4
of a material can be described by viscosity of a material. However, the viscosity of a material can be changed in different conditions. With the help of rheometer, we can determine the mechanical properties of a material under applied force. During rheology experiments rheometer apply shear stress on sample which is squished between two metal plates which may have different geometries according to aim of experiment.
Rheology is important to define flow properties of biological materials, because their flow properties determine the mechanical conditions in living organisms which point out the extra cellular matrix (ECM) of cells whose behavior can differentiate according to the stiffness of ECM.12 For example, rheology can determine the storage and loss modulus changes of porcine eyes by changing frequency; and stress-strain curves of different eyes at different shear rates and we can observe the similarity of loss and storage modulus of eyes.13 Besides, the importance of determining the mechanical properties of different tissues is emphasized and several examples of mechanical characteristics of different tissues were presented.14 As the self-assembled peptide hydrogels are a viable materials to mimic the ECM, rheology was used to determine the mechanical property of peptide hydrogels in many researches.9,11,15-16 These examples indicate the robustness of rheological characterizations to determine mechanical properties of gels.
1.3 Nanomechanical Charazterization
Development of nanomechanical characterization techniques is a requirement since the dimensions of new generation materials and devices becomes smaller
5
and smaller. Especially; molecular biology, genetics, polymer science require effective characterization tools to nature of biological molecules.
The nanomechanical characterization of biological materials consist of proteins, nucleic acids, lipids, carbohydrates, supramolecular complexes, biopolymers, human tissue such as bone and skin, and biological structures whose composite assembly contributes to their overall mesoscopic mechanical properties.17-19 Moreover, the development of nanomechanical characterization techniques for biomolecules is related with the inadequate properties of traditional tensile and compression mechanical tests since these methods are based on a slow, single measurement on large scale samples. In addition to disadvantages of operating at biologically relevant length and force scales (on the order of 10-9 m and 10-9 N), these traditional methods are also incapable of measuring properties in biological microenvironments which is crucial to understand real properties of the samples.20
Nanomechanical characterization techniques include atomic force microscopy (AFM), nanoindentation, nano tensile test. AFM is a member of a broad class of scanning near field tools which are known as Scanning Probe Microscopes (SPMs). The Scanning Tunneling Microscope (STM), first demonstrated in 1981, is predecessor of SPMs which provides provide true atomic resolution of a surface. Although STMs provides atomic resolution of a surface, it requires conductive surfaces and samples for measuring.21 The invention of AFM in 1986 opened the application of this high-resolution imaging technique to electrically insulating surfaces, in contrast to the STM which requires a current
6
flow. Hence, this property of the technique made AFM suitable for the analysis of biological samples which do not have conductive properties. Then, AFM has become very useful tool for direct measurements of intermolecular forces of biological samples with atomic-resolution nanomechanical characterization. One of the advantages of the nanomechanical characterization of AFM is to possibility of not only topological but also mechanical mapping of the biological samples within the natural environment. This advantage of AFM technique provide mapping of nanomechanical properties of live cells such as E. coli, rat tail fibroblast cell and human red blood cell with using multi-harmonic AFM.22
7
Chapter 2
Encapsulation of a Zinc Phthalocyanine
Derivative in Self-Assembled Peptide
Nanofibers
(This work was partially published at Journal of Materials Chemistry, 2012, 22, 2553-2559.)
8
Chapter 2. Encapsulation of a Zinc Phthalocyanine Derivative in Self-Assembled Peptide Nanofibers
2.1 Introduction
Construction of metal complex chromophores (e.g. phthalocyanine and porphyrin) containing nanostructures of well-defined size and shape in water is of great interest because of their attractive photochemical, photophysical and electronic properties.23 Zinc phthalocyanine complexes are interesting examples of chromophoric molecules. Various methods such as metal coordination, electrostatic interactions, hydrogen bonding and host-guest interactions have been previously utilized to organize phthalocyanine molecules.24-28
In this thesis, I present a straight-forward hydrophobic encapsulation method for dissolving zinc phthalocyanine molecule in water and organizing zinc phthalocyanine molecules within peptide nanofibers. Our method exploits the hydrophobic interaction between zinc phthalocyanine molecules and hydrophobic tail of peptide amphiphile (PA) molecules. With the help of this interaction zinc Phthalocyanine molecules were surrounded with PA molecules and dissolved in water owing to hydrophilic part of PAs. In addition to encapsulation of zinc phthalocyanine molecules within PAs, nanofiber formation was achieved through hydrogen bonding. As a result of encapsulation and nanofiber formation, the zinc phthalocyanine molecules aligned and an ultrafast energy transfer phenomenon was observed upon their organization through the peptide nanofiber core. Several successful attempts to mimic the ultrafast energy transfer mechanism were previously performed by using
9
polymers,29 dendrimers,30 porphyrin arrays linked by covalent bonds31-32 and by self-assembled systems.33-35 The ultrafast energy transfer characteristics of zinc phthalocyanine molecules exhibit promising behaviors mimicking the light harvesting mechanism in photosynthetic antenna proteins36-37 and as I observed in this work, it can be tuned with the help of self-assembled peptide nanofibers.
2.2 Experimental
2.2.1 Synthesis and Characterizations
9-Fluorenylmethoxycarbonyl (Fmoc) protected amino acids, Fmoc-Rink Amide MBHA resin, and 2-(1H-Benzotriazol-1-yl)-1,1,3,3-tetramethyluronium hexafluorophosphate (HBTU) were purchased from NovaBiochem and ABCR. The other chemicals were purchased from Fisher, Merck, Alfa Aesar or Aldrich and used as received.
Lauryl-VVAGH-Am peptide amphiphile (PA) was constructed on Fmoc-Rink Amide MBHA resin. Amino acid coupling reactions were performed with 2 equivalents of Fmoc-protected amino acid, 1.95 equivalents of HBTU and 3 equivalents of DIEA for 2 h. The Fmoc protecting group removal was performed with 20 % piperidine/DMF solution for 25 min. Cleavage of the peptides from the resin was carried out with a mixture of TFA:TIS:H2O in ratio
of 95:2.5:2.5 for 2 h. Excess TFA was removed by rotary evaporation. The remaining peptide was triturated with ice-cold diethyl ether and the resulting white precipitate was freeze-dried. The peptide was characterized using an Agilent 1200-6530 quadrupole time of flight (Q-TOF) mass spectrometer with electrospray ionization (ESI) source equipped with reverse-phase analytical high
10
performance liquid chromatography (HPLC) with a Zorbax SB-C8 4.6 x 100 mm column (Figure 1.2). A gradient of 0.1% formic acid/water and 0.1% formic acid/acetonitrile was used as the mobile phase for analytical HPLC.
1,2-di(hexylthio)-4,5-dicyanobenzene and octakis (hexylthio)
phthalocyaninato zinc (II) were synthesized using the reported procedure.38 All other reagents and solvents were obtained from commercial suppliers and dried as described in Perrin and Armarego39 before use. Elemental analyses were obtained using a Thermo Finnigan Flash 1112 Instrument. Mass spectra were obtained using Bruker MicroTOF LC/MS spectrometer using electro spray ionization (ESI) method at Gebze Institute of Technology. Infrared spectra were recorded on a Bio-Rad FTS 175C FT-IR spectrophotometer using KBr pellets. Analytical thin layer chromatography (TLC) was performed on silica gel (Merck, Kieselgel 60, 0.25 mm thickness) with F254 indicator. Column chromatography was performed on silica gel (Merck, Kieselgel 60, 70- 230 mesh; for 3 g crude mixture, 100 g silica gel was used in a column of 3 cm in diameter and 60 cm in length). 1H and 13C NMR spectra were recorded on a Varian INOVA 500 MHz spectrometer using TMS as an internal reference for
1
H- and 13C-NMR. UV-Vis spectra were recorded with a Shimadzu 2001 UV spectrophotometer.
2.2.2 Imaging Techniques
SEM imaging was performed with a FEI Quanta 200 FEG scanning electron microscope. Cryo-SEM samples were prepared on a cryo-SEM stage by decreasing the temperature to -15 °C. Samples for standard imaging were drop
11
cast on silicon wafer and dried in critical point dryer (Autosamdri-815B, Series C). Dried samples were coated with 6 nm Au/Pd.
TEM imaging was performed with FEI Tecnai G2 F30. Diluted samples were placed on a Lacey carbon coated 300 mesh copper grid. 2 wt% uranyl acetate solution was used for staining organic nanostructures. 10 µL of diluted sample solution was dropped on a grid and kept there for 1 min. The excess amount was removed by pipetting. Then, 20 µL of 2 wt% uranyl acetate solution was put on a parafilm sheet. The grid was placed on the top of the drop with its upper side down and kept there for 5 min. Stained grids were dried in the fume hood at room temperature overnight.
2.2.3 UV-vis spectroscopy and fluorescence measurements
1.24 x 10⁻⁶ M octakis (hexylthio) zinc phthalocyanine (ZnPc) in THF solution was prepared and added into a 1 cm quartz cuvette. 3.8x10⁻⁶ M ZnPc and 3.84x10⁻⁴ M PA solution was prepared at different pH values and added into a 1 cm quartz cuvette. A solid ZnPc film was prepared by immersing microscope slide in a solution of ZnPc in THF and letting the sample dry in air. Absorbance measurements were performed on a Varian Cary 5000 UV-Vis-NIR spectrophotometer. Fluorescence measurements were performed on a Varian Cary Eclipse fluorescence spectrophotometer.
2.2.4 Oscillatory rheology
Rheology measurements were performed with an Anton Paar Physica RM301 Rheometer operating with a 25 mm parallel plate configuration at 25 oC. 300 µL of 3.80 x 10⁻⁶ M ZnPc/3.84 x 10-4 M PA and 3.84 x 10⁻⁴ M PA solutions were
12
carefully loaded on the center of the lower plate and 2.6 µL of 1M NaOH solution was added then left untouched for 15 min before measurement. After equilibration, the upper plate was lowered to a gap distance of 0.62 mm. Storage moduli (G’) and loss moduli (G’’) values were scanned in a strain sweep mode and a shear strain value of 0.4% was found to be optimal; frequency sweep measurements were made with a constant shear strain of 0.4%.
2.2.5 Circular dichroism (CD)
A Jasco J-815 CD spectrophotometer was used for CD analysis. Solutions of 3.8x10⁻⁶ M ZnPc and 3.84x10⁻⁴ M PA were formed at different pH values and added into 1 mm quartz cuvette.
2.2.6 Singlet oxygen measurements
Singlet oxygen generating capability of ZnPc in THF and peptide encapsulated ZnPc in water was performed using singlet oxygen trap molecules 1,3-diphenylisobenzofuran (DPBF) and 2,2'-(anthracene-9,10-diyl)dimalonic acid (ADMA), respectively. A 660 nm emitting 3000 mCd lead source was used as light source. A solution containing DPBF (74 μM) and ZnPc (50 nM) was prepared in THF. A control solution was prepared with DPBF (74 μM) alone. A 3.80x10⁻⁶ M solution of ZnPc encapsulated in 3.84x10⁻⁴ M PA was prepared by encapsulation process described in sample preparation section. 115.38 μL of this solution and 5 μL of 1 M HCl solution were added to 1.5 mL of 2.70x10⁻⁴ M ADMA and total volume was brought to 3 mL by addition of water. The control solution of ADMA (135 μM) was prepared in H2O. 2.22x10⁻⁷ moles of DPBF
13
2.22x10⁻⁵ moles of PA in 2 mL of water solution to encapsulate both DPBF and ZnPc molecules. The total volume was brought to 3 mL before singlet oxygen measurement. All solutions were aerated for 5 min. Then, the absorbance spectrum of each solution was taken in 5 min intervals while the solutions were kept in dark for 15 min. After 15 min samples were exposed to 660 nm light from 4 cm distance for a total period of 35 min and absorbance was recorded in 5 min intervals for each solution.
2.2.7 Femtosecond pump-probe measurements
The laser source for the ultrafast pump–probe experiments was a Ti:sapphire laser amplifier–optical parametric amplifier system (Spectra Physics, Spitfire Pro XP,TOPAS). The pulse duration was measured as 100 fs for the experiments. The investigated samples were placed in quartz cuvettes with 1 mm path length.
2.2.8 Sample preparation
The PA is an amphiphilic molecule, which helps to solubilize ZnPc molecules in water by means of encapsulation driven by hydrophobic effect. Three mg of ZnPc was dissolved in 2 mL of THF to obtain stock solution. ZnPc solution was diluted 800 times prior to UV-Vis and fluorescence spectroscopy measurements. ZnPc with PA solution was prepared by mixing 700 µL of 1 mM ZnPc stock solution with 7 mL of 10 mM PA solution (45.42 mg of PA in 7 mL of water). This mixture was ultrasonicated for 45 min. ZnPc with PA solution was diluted 26 times prior to UV-Vis and fluorescence spectroscopy, SEM, TEM, and CD characterizations. The ZnPc thin film was prepared by immersing microscope slide into concentrated ZnPc in THF solution and the sample was air dried.
14
2.3 Results and Discussions
Encapsulation and non-covalent alignment of octakis (hexylthio) zinc phthalocyanine (ZnPc) molecules (1) by using self-assembling peptide amphiphile (PA)40-41 molecule (2) with the sequence of Lauryl-VVAGH-Am (Figures 2.1 and 2.2) were studied. The mass spectrum of PA molecule was consistent with theoretical mass of PA molecule and sharp peak in liquid chromatography of PA indicates the high purity of synthesized molecule (Figure 2.3). Encapsulation of zinc phthalocyanine derivative was performed by hydrophobic interactions between alkylthiol functionalized ZnPc and fatty acid conjugated peptide molecule (Figure 2.1). The peptide amphiphile molecules render ZnPc molecules soluble in water. The histidine residue provides hydrophilic property to the amphiphilic peptide molecules. The nature of the histidine residue determines the self-assembly properties of the PA molecules depending on the pH of the environment. During the encapsulation process, the ZnPc was dissolved in THF and the PA was dissolved in water. These two solutions were mixed and the mixture was ultrasonicated for encapsulation of ZnPc molecules within peptide nanofibers during evaporation of THF. At the end of the encapsulation process, ZnPc molecules were surrounded by the PA molecules (Figure 2.1) which can self-assemble into nanofibers with a hydrophobic core.42
15
Figure 2.1 Schematic representation of ZnPc (1) encapsulation in PA (2)
nanostructures.
Figure 2.2 The chemical structure of PA and octakis (hexylthio)
16
Figure 2.3 Mass spectrum (top) and LC chromatogram (bottom) of the PA
molecule 2.
2.3.1 Morphological characterizations
In this work, hydrophobic ZnPc molecules were located in the hydrophobic core of the self-assembled PA nanofibers due to hydrophobic interactions. In encapsulation setup PA molecules were dissolved in water thanks to their hydrophilic part and ZnPc molecules dissolved in organic solvent. During the encapsulation process at the interface of water and organic solvent because of
17
the hydrophobic interaction between alkyl tail of PA molecules and ZnPc molecule, ZnPc molecules were covered with PA molecules and diffuse into water. First part of the self-assembly of PA molecules was achieved mostly by hydrophobic interaction among molecules. Besides, due to pH change PA molecules can self-assemble into nanofibers through hydrogen bonds. The morphology of the self-assembled nanostructures was studied by means of scanning and transmission electron microscopy techniques. It was observed in SEM and TEM images that ZnPc encapsulated PA yields one-dimensional fibrous nanostructures and a three-dimensional interconnected fibrous network (Figure 2.4). TEM images of the ZnPc–containing peptide nanofibers at two different pH values are shown in Figures 2.5 and 2.6. At pH 8 PA molecules are much prone to self-assemble into nanofibers than at pH 5 (Figure 2.6). In order to verify the presence of ZnPc molecules within the peptide nanofibers, an energy dispersive X-ray spectrum demonstrating the presence of zinc was recorded from an individual peptide nanofiber (Figure 2.7). The singlet oxygen generation capacity of the ZnPc molecules was measured to confirm the encapsulation of ZnPc molecules within the PA nanofibers. The ZnPc molecule and DPBF (a singlet oxygen trap molecule) were dissolved in THF and trap molecule degradation was observed upon irradiation with an appropriate light source (Figure 2.8 and 2.9). As a control of trap degradation, DPBF trap molecule was dissolved in THF without ZnPc molecule and at the end of measurement there was not any significant degradation observed (Figure 2.8). The peptide encapsulated ZnPc sample was mixed with a water soluble singlet
18
oxygen trap molecule (ADMA) and again irradiated, however no detectable trap molecule degradation was observed (Figure 2.10). Based on this observation, it was inferred that ZnPc molecules do not accumulate on the surface of the nanofibers and do not dissolve in the aqueous solution. The ZnPc molecules were co-encapsulated with DPBF molecules, which are soluble in THF and not in water. Upon irradiation of this solution, we observed degradation of DPBF molecules (Figure 2.8 and 2.11). Briefly, singlet oxygen generation and consequent trap molecule degradation were observed only in cases of direct interaction between the ZnPc and trap molecule (Figures 2.8-2.11). This observation supports the idea of encapsulation of the ZnPc molecules in the hydrophobic core of the peptide nanofibers.
Figure 2.4 TEM (a) and SEM (b) images of the ZnPc – containing PA
nanostructures.
19
20
21
Figure 2.7 a) EDX spectrum of peptide nanofiber surface, b) scanned areas are
shown, c) counts versus scan position graph of collected EDX spectrum.
a
b
22
Figure 2.8 Singlet oxygen measurement of ZnPc in THF, DPBF in THF, ZnPc
within PA in water, ZnPc and DPBF within PA in water. a) DPBF in THF (at 414 nm), b) DPBF+ZnPc in THF (at 414 nm), c) ZnPc+DPBF with PA in water
(at 418 nm), and d) ZnPc+PA with ADMA in water (at 381 nm).
23
Figure 2.10 Singlet oxygen measurement of encapsulated ZnPc within PA in
water.
Figure 2.11 Singlet oxygen measurement of encapsulated ZnPc and DPBF
24
A three-dimensional network of the ZnPc–containing peptide nanofibers forms a self-supporting gel at pH 8 upon neutralization of the charges on the peptide sequence. The mechanical properties of the gels were characterized by oscillatory rheology experiments (Figures 2.12-2.15). In strain sweep experiments, we observed that decrease in storage modulus of peptide gel and ZnPc-containing peptide gel began at different strain value. Compared to peptide gel, ZnPc-containing peptide gel’s storage modulus started to decrease in lower strain values (Figure 2.12 and 2.14). Besides, the storage modulus of ZnPc–containing peptide gel was greater than that of peptide only gel; thus, it can be indirectly inferred that self-organized π-stacks of phthalocyanines enhance mechanical properties of the gel and make gel much stiffer and brittle. The frequency sweep measurements of both gels clearly indicate that ZnPc-containing peptide gel has a higher storage modulus than peptide gel (Figure 2.13 and 2.15). The cryo-SEM technique does not show the peptide nanofibers, but revealed peptide network in aqueous solution (Figure 2.16). The critical point dried gels of PA and ZnPc–containing peptide nanofibers were studied by SEM. Well-defined nanofiber networks were observed for both samples (Figures 2.4, 2.17). The morphology of the nanofibers was also studied by circular dichroism spectroscopy, indicating that the self-assembly process involves extended β-sheet structural motif (Figures 2.18 and 2.19).
25
Figure 2.12 Strain sweep rheology measurement of ZnPc with PA gel.
26
Figure 2.14 Strain sweep rheology measurement of PA gel.
27
28
29
Figure 2.18 Circular dichroism spectra of ZnPc with PA at pH 2, pH 5, and pH
8; a) ZnPc+PA at pH 2, b) ZnPc+PA at pH 5, and c) ZnPc+PA at pH 8.
30 2.3.2 Spectroscopic characterizations
Due to the increase in the local concentration of ZnPc molecules in the core of the peptide nanofibers upon hydrophobic encapsulation process, the interactions between ZnPc molecules were enhanced and we observed remarkable changes in the spectroscopic properties of the ZnPc molecules. The remarkable change in spectroscopic properties can be detected in the UV-Vis spectrum of ZnPc molecules dissolved in THF and ZnPc within PA molecules in water (Figure 2.20). The difference in the absorption bands is caused by aggregation of the ZnPc molecules within the PA nanofibers under aqueous conditions.43 Aggregation of ZnPc molecules causes a shift and broadening of the absorption bands.27,43 The Q-band absorption of ZnPc in THF blue-shifts from 705 to 674 nm compared to ZnPc within the PA in water at pH8. A smaller blue-shift was observed for the sample at pH 2 compared to samples at pH 5 and pH 8 because of the formation of extended peptide nanostructures at higher pH (Figure 2.20). In the light of this observation we can deduce that the degree of self-assembly and aggregation of ZnPc molecules can be controlled by pH change. The observed blue-shifts in the Q-band absorption of encapsulated ZnPc upon aggregation in the peptide nanofibers may be caused by formation of H-aggregates (face to face H-aggregates)44-46 with effective π-π interactions. However, the mechanism of chromophore aggregation should be characterized in more detail. Comparison of the spectroscopic behaviors of encapsulated chromophores and chromophores in solid phase became an essential because the ZnPc molecules within PA nanofibers are completely isolated from the solvent and can have a similar behavior to ZnPc in solid phase. For this purpose, a ZnPc
31
thin film was prepared by immersing microscope slide into concentrated ZnPc in THF solution and letting microscope slide dry in hood. The absorption around 670 nm for the ZnPc thin film prepared on a microscope slide surface provided some information about the aggregation state of the chromophoric units in peptide nanofibers (Figure 2.21) analogous to the blue-shifted peaks at around 670 nm for peptide encapsulated ZnPc samples. Encapsulated ZnPc molecules in the nanofiber form revealed solid-like behaviour similar to the ZnPc film. Furthermore, fluorescence spectra of ZnPc in THF (Figure 2.22) and in water with PA molecules (Figures 2.23 and 2.24) differ significantly because of the effect of aggregation and change in the environment of the ZnPc molecules. The fluorescence measurements were performed in different excitation wavelengths to verify quenching. Interestingly, encapsulation of the ZnPc molecules in peptide nanofibers resulted in quenching of the fluorescence emission (Figures 2.20, 2.23, and 2.24). The emission spectra at different excitation wavelengths does not give a proper emission peak; instead, noise was observed in the emission spectra. Additionally, the fluorescence quenching caused by aggregation was observed for ZnPc film as well (Figures 2.25–2.27). The fluorescence emission spectra at different excitation wavelengths gave noisy results except excitation at 325 nm. The peaks in the emission spectrum after excitation at 325 nm were caused by Rayleigh scattering of excitation wavelength, because the peaks were very sharp for a usual emission peak (Figure 2.22). Besides, it is not a coincidence that the peaks are at twice and threefold of the excitation wavelength. The polarity and nature of the
32
environment such as solvent, pH, and temperature are known to have an impact on photophysical properties of fluorescent molecules.47-48
The UV-Vis spectra at different pH values indicate the indirect effect of pH on the photophysical properties of the ZnPc molecules (Figure 2.20). The change in the pH directly affects the polarity and the self-assembly behavior of the PA molecules because of the presence of histidine residue.
Figure 2.20 Absorbance and fluorescence emission spectra of ZnPc with and
without the PA molecules. a) ZnPc absorbance in THF, b) ZnPc with PA absorbance in water at pH 2, c) ZnPc with PA absorbance in water at pH 5, d) ZnPc with PA absorbance in water at pH 8, e) ZnPc fluorescence in THF, and f)
33
Figure 2.21 UV-vis spectrum of ZnPc film.
34
Figure 2.23 Fluorescence emission of ZnPc with PA at pH 5 in water (λex =
673 nm).
Figure 2.24 Fluorescence emission of ZnPc with PA at pH 8 in water (λex =
35
Figure 2.25 Fluorescence spectra of ZnPc film (λex = 325 nm).
36
Figure 2.27 Fluorescence spectra of ZnPc film (λex = 671 nm).
The significant fluorescence quenching observed for encapsulated ZnPc samples can potentially yield fast excited state relaxations due to non-radiative energy transfers between aggregated molecules.49 In order to study the relationship between the aggregation phenomenon and excited state life time of the chromophores in peptide nanofibers, ultrafast pump–probe experiments were utilized (Figures 2.28–2.33). The time evolution of excited state absorption (ESA) signals for ZnPc molecules in THF (Figure 2.28) revealed long-lived excited state relaxation (on the order of ns), because ZnPc molecules were dissolved in THF very effectively and due to lack of aggregation non-radiative energy transfer between molecules would not take place. On the other hand, the time evolution of ESA signals for peptide encapsulated ZnPc samples (Figure 2.34) exhibited very short-lived (on the order of ps and less) excited state
37
relaxation depending on the pH (Table 2.1). At different pH values non-radiative energy transfer and very short excited state life time was observed because of aggregation of ZnPc molecule within PA molecules. However, the degree of aggregation influences the duration of the excited state relaxation and it is known that degree of self-assembly is increased by increasing pH value. Thus, increase in degree self-assembly degree leads to increased aggregation of ZnPc molecules which lower the linear absorption decay time through non-radiative energy transfer between molecules.
38
Figure 2.28 Time evolution of the nonlinear absorption of ZnPc in THF.
Figure 2.29 Pump-probe data as a function of time (y) and wavelength (x) for
ZnPc in THF. The characteristic features of singlet ESA (A and C), triplet ESA (B) and stimulated emission and bleach (D) are indicated. Pump-probe data for
ZnPc in THF revealed broad positive excited state absorption (ESA) bands superimposed with a deep negative signal, due to the ground state bleach and
stimulated emission (SE). Similar results were also obtained for zinc phthalocyanine in DMSO and these signals were identified as bleach+SE (D), S1
39
Figure 2.30 Pump-probe data as a function of time (y) and wavelength (x) for
ZnPc peptide at pH 2.
Figure 2.31 Pump-probe data as a function of time (y) and wavelength (x) for
ZnPc peptide at pH 5.
Figure 2.32 Pump-probe data as a function of time (y) and wavelength (x) for
40
Figure 2.33 Transient absorption of sample with pH 5 monitored at 1.31 ps
excitation with 690 nm, laser pulses with 1 µJ and 5 µJ energies.
Figure 2. 34 Time evolution of the excited state absorption signal at 585 nm of
41
Medium t1 (ps) t2 (ps) t3 (ps)
Aqueous (pH 2) 142 33 0.92
Aqueous (pH 5) 80 6 0.48
Aqueous (pH 8) 100 6 0.47
Table 1.1 Non-linear absorption decay time constants for ZnPc samples at different pH values.
The transient absorption of ZnPc samples for various time delays is shown in Figure 2.35. The ESA signal around 570 nm (T1 → Tn transition) observed for ZnPc in THF decayed until 100 ps, then it increased gradually (Figure 2.35a). The ground state bleach and stimulated emission (SE) signal at 695 nm at earlier time delays shift to 720 nm after a couple of ps time delay due to the Stokes shift of ZnPc in THF. The excited state at various time delays for ZnPc in peptide nanofibers is shown in Figure 2.35b, c and d. A strong scattering signal appeared at 690 nm pump wavelength (gray area in Figure 2.35) due to peptide nanofibers. The pump–probe results as a function of wavelength for encapsulated ZnPc at different pH values (Figure 2.30–2.32) also differ from ZnPc in THF (Figure 2.29). The ESA signal with a long decay time corresponds to transitions between triplet states (T1 → Tn ESA (Figure 2.29B)) of ZnPc in THF (Figure 2.29).50 A long decay time was not observed in peptide encapsulated ZnPc samples because of the intermolecular fast energy transitions (Figure 2.30–2.32). Similar behavior was also observed in several studies with zinc phthalocyanines at high concentrations or with zinc phthalocyanine thin films51-54
. Additionally, a strong stimulated emission signal observed for ZnPc in THF at 720 nm was not observed in peptide encapsulated ZnPc samples, which is consistent with the fluorescence quenching observed in the peptide samples (Figure 2.23 and 2.24).
42
Figure 2.35 Transient spectra of ZnPc. In THF (a), in H2O with PA at pH 2 (b), at pH 5 (c), at pH 8 (d).
Pump–probe experiment results also revealed the effect of pH on ZnPc in the peptide nanofibers. The pH 2 sample shows the slowest decay time, while samples at pH 5 and pH 8 showed similar faster decay times. Based on this observation, it can be inferred that encapsulation of ZnPc in peptide nanofibers not only yields ultrafast energy transfer between chromophores but also provides a route to control the ultrafast decay time by altering the pH of the solution.
2.4 Summary
In summary, encapsulation of zinc coordinated phthalocyanines by peptide amphiphile molecules was achieved under aqueous conditions. The encapsulation process significantly modifies the photophysical properties of the ZnPc molecule and enables pH controlled ultrafast intermolecular energy
43
transfer. The energy transfer mechanism suggests that these systems can be used to mimic light harvesting photosynthetic antenna proteins. Biologically relevant peptide amphiphiles55 can provide a myriad of useful applications such as bio-imaging and medical applications when combined with the properties of various chromophores. This method can also provide a versatile approach for bottom-up fabrication of supramolecular organic electronic devices.
44
Chapter 3
Characterization of Peptide Nanofibers’
Mechanical Properties
45
Chapter 3. Characterization of Peptide Nanofibers’ Mechanical Properties
3.1 Introduction
Extracellular matrix (ECM) and its characteristics are very essential for cell differentiation, cell proliferation and determining cellular mechanism. The properties of ECM are correlated with characteristics of tissues and they differ from each other for different tissues. The differences come from changing amounts and types of collagens, adhesion molecules, proteoglycans, growth factors and cytokines or chemokines.56
The main components of ECM are proteins which are synthesized by cells. According to ECM environment needs, cells produce different kind of proteins and proteoglycans.57 Collagens are protein constituents of ECM and apart from collagen elastin, laminin and fibronectin which are also proteins can be found in ECM.57 In light of this information, peptide amphiphile (PA) molecules are viable materials which construct synthetic ECM because of their amino acid constituents and self-assembling mechanism.58 PAs are used for in vivo tissue engineering applications like neuron regeneration after spinal cord injury and cartilage regeneration.59-60 Apart from tissue engineering applications, PAs have hydrophobic and hydrophilic parts which help encapsulation of hydrophobic molecules which can be dissolved in water within peptide amphiphiles.61 Another considered application for PAs is drug delivery, because they have biologically active parts which can induce biological mechanisms. Instead of pre-determined
46
nature of scaffolds, PAs let cells control the nature of scaffolds.62 In addition to PAs, peptide molecules can also be applied in different research areas like gene delivery,63 drug release,64 catalytic activity65 and tissue engineering.66 Peptide molecules have wide applicability in various research areas and their detailed characterization is worth studying. For example, among protein based materials like silk, collagen and keratin self-assembled amyloid fibers take attention due to their remarkable mechanical properties.67
Mechanical environment of cells is as important as their chemical environment. The one of the most obvious example about effects of mechanical environment on cell differentiation is the study about mesenchymal stem cell differentiation in different matrices which have various elasticity.68 Besides, another study was performed using embryonic stem cells to observe effects of substrate stiffness on early differentiation events.69
In this chapter, we determined the mechanical characteristics of PA and peptide nanofibers that self-assemble into nanofibers which can be the constituents of ECM. These PAs were composed of hydrophilic bioactive peptide sequence and a hydrophobic alkyl tail and peptide molecules were designed to have amyloid-like nanofibers.
3.2 Experimental
3.2.1 Synthesis and Characterizations
9-Fluorenylmethoxycarbonyl (Fmoc) protected amino acids, Fmoc-Rink Amide MBHA resin, and 2-(1H-Benzotriazol-1-yl)-1,1,3,3-tetramethyluronium hexafluorophosphate (HBTU) were purchased from NovaBiochem and ABCR.
47
The other chemicals were purchased from Fisher, Merck, Alfa Aesar or Aldrich and used as received.
Lauryl-VVAGK-DOPA (DopaK-PA), Lauryl-VVAGK-Am (K-PA) peptide amphiphiles and amyloid inspired E (Ac-EFFAAE-Am) and K
(Ac-KFFAAK-Am) peptides were synthesized by using solid phase
9-fluorenylmethoxycarbonyl (Fmoc) peptide synthesis method. The synthesis of peptides and peptide amphiphiles were constructed on Fmoc-Rink Amide MBHA resin. Amino acid coupling reactions were performed with 2 equivalents of Fmoc-protected amino acid, 1.95 equivalents of HBTU and 3 equivalents of DIEA for 2 h. The Fmoc protecting group removal was performed with 20 % piperidine/DMF solution for 25 min. Cleavage of the peptides from the resin was carried out with a mixture of TFA:TIS:H2O in ratio of 95:2.5:2.5 for 2 h.
Excess TFA was removed by rotary evaporation. The remaining peptide was triturated with ice-cold diethyl ether and the resulting white precipitate was freeze-dried. The peptide was characterized using an Agilent 1200-6530 quadrupole time of flight (Q-TOF) mass spectrometer with electrospray ionization (ESI) source equipped with reverse-phase analytical high performance liquid chromatography (HPLC) with a Zorbax SB-C8 4.6 x 100 mm column. A gradient of 0.1% formic acid/water and 0.1% formic acid/acetonitrile was used as the mobile phase for analytical HPLC. K peptide was dissolved in 1 mM HCl solution and then freeze dried again to remove residual TFA.
48 3.2.2 Oscillatory rheology
An Anton Paar Physica RM301 Rheometer operating with a 25 mm parallel plate configuration was used to determine mechanical properties of peptide gels. Except characterizing mechanical property of gels by changing temperature, all measurements were done at 25 oC. Rheology measurements of 1 w% K-PA, DopaK-PA and DopaK-PA/Fe(III) gels were performed by loading 225 μl PA solution on the center of lower plate and addition of 25 μl 0.25 M NaOH to set pH to 10. Molar ratio of DopaK-PA:Fe(III) was 3:1. Additionally, the measuring distance was determined as 0.5 mm. Time sweep tests of each sample was carried out for 1 h. Angular frequency and strain were determined as ω= 10 rad/s and γ=0.01 %, respectively. Frequency sweep of each sample was carried out at equilibrium after 1 h gelation. Angular frequency was changed between ω= 0.1-100 rad/s and strain was kept constant at γ=0.01 %. Thermal properties of the hydrogels were investigated between 20-80 oC, at ω=10 rad/s angular frequency and γ=0.01 % shear strain. Heating and cooling rates were set to 10
o
C/min.
Rheology measurements of the prepared samples 4% (w/v), 3 % (w/v), 2 % (w/v), 1 % (w/v) and 0.5 % (w/v) of E+K peptide mixtures (1:1) were completed to understand mechanical properties of the gels formed by mixture of E and K peptide solutions. The total volumes of the samples were 250 µl (125 µl E + 125 µl K at neutral pH). Additionally, the measuring distance was determined as 0.5 mm. Time sweep tests of each sample was carried out for 1 h. Angular
frequency and strain were determined as ω= 10 rad/s and γ=0.1 %. Data collection was conducted for every 30 s. and 120 data points were obtained in
49
total. Frequency sweep of each sample was carried out for 21 min. Angular frequency was changed between ω= 0.1-100 rad/s and strain was kept constant at γ=0.1 %. 30 data points were collected for each sample.
3.2.2 Sample preparation
AFM sample preparation of K-PA, DopaK-PA, DopaK-PA/Fe(III), DopaK-PA 80 oC and DopaK-PA/Fe(III) 80 oC peptide amphiphiles was done using 0.05 w% PA solutions. All dissolved PA solutions’ pH value increased to 12 to induce self-assembly of PAs. In addition to self-assembly, pH increase initiates crosslinking for DopaK-PA, DopaK-PA/Fe(III), DopaK-PA 80 oC and DopaK-PA/Fe(III) 80 oC. The temperature of solution was increased for DopaK-PA 80
o
C and DopaK-PA/Fe(III) 80 oC samples after pH reached to 12. Silicon wafers were dip coated to solutions in defined conditions and immediately put in liquid nitrogen. Then all samples were freeze-dried.
AFM sample preparation was completed by dilution of 4% (w/v) E+K peptide gel at pH 7 up to 0.05% (w/v) E+K peptide solution by addition of H2O. Then, a
drop of the diluted sample was put onto the silicon wafer and it was waited for drying of the sample. Additionally, the control groups of 0.05 % (w/v) E and K peptide solutions were prepared on silicon surfaces at pH 5 and pH 10.
3.2.3 Atomic Force Microscopy (AFM) and Nanomechanical Characterization The system used in nanomechanical characterization was improved version of a previous work.70 The method was more developed and standardized to measure a series of samples. During the measurement, topography was taken in the first pass, and nanomechanical characterization was done on the second pass when
50
the cantilever was lifted a few nanometers and the sample was oscillated instead of cantilever. Topography was analyzed in the non-contact AFM mode. Sample oscillation signal was provided with a function generator (DS345, Stanford Research System) at 2 kHz. Since the oscillation amplitude of the piezo changes with the weight and position of the sample, the function generator signal amplitude was selected to give nearly 5 nm indentation. Before the measurement, the cantilever was calibrated on a silicon sample. Silicon surface can be either the substrate, if substrate top surface is not fully coated. Otherwise another clean silicon sample is used. This calibration included the spring constant of the cantilever, the deflection in nm per volt, and the amplitude in nm per volt of photodiode response. Calibration method is described in The microscope used is MFP3D Asylum. Force sensing method was laser deflection detection. At the time of scanning, deflection signal was recorded using an oscilloscope. The oscilloscope data was processed to obtain force-distance data necessary for an indentation experiment. The prepared sample was glued on to a piezo bimorph disc.
After calibration of the silicon surface, recorded deflection signal was processed to obtain nanomechanical properties. Force was recorded from the calibrated by calibrating the cantilever deflection versus applied displacement, as well as calibrating the cantilever spring constant. Assuming piezo as a linear system, our sinusoidal signal from function generator should be seen as sinusoidal displacement oscillation in piezo without any other harmonics. Therefore, the oscilloscope data showing the deflections volts vs. time was interpreted
51
accordingly to give out Force-distance data. We used a custom written program to process the obtained data. The software used for this purpose was GNU Octave 3.4.3. Since, piezo itself was a damped system, the phase between the applied sinusoidal function and the piezo oscillation could be found. For this purpose, the recorded oscilloscope data was processed to find out the peaks and the phase between the applied signal and piezo oscillation was calculated. Then, again using our custom program, the unmeaningful force-distance curves were eliminated. Each force distance curve was divided into approach and retraction parts, and their adhesion force, applied maximum force and contact slopes were calculated.
3.3 Results and Discussions
In this chapter, I investigated the mechanical properties of gels and nanofibers which are composed of peptide amphiphile (PA) molecules (Figure 3.1 a,b) and amyloid like peptide molecules (Figure 3.1 c,d) which are very promising materials for tissue engineering and to mimic the natural environment of cells. The chemical difference between two PA molecules is Dopa molecule which is detected in glue proteins of marine mussels71 at the end of the peptide sequence. The Dopa conjugated PA molecule indicated noteworthy results in the mechanical property of PAs. The amyloid like peptides were oppositely charged and upon mixing they self-assembled into nanofibers that make self-supporting gels which had intriguing mechanical properties. The mass spectrum of peptide molecules was consistent with theoretical mass of peptide molecules and sharp
52
peak in liquid chromatography of peptides indicates the high purity of synthesized molecule (Figure 3.2-3.4).
Figure 3.1 The chemical structure of DopaK-PA (a), K-PA (b), E-peptide (c),
53
54
55
56
Oscillatory rheology experiments were done to characterize gelation kinetics of PAs and peptides. First of all, mechanical properties of three different gels that composed of PA molecules were investigated to determine effect of crosslinking Dopa molecule. Since the mechanical property of PA hydrogels based on non-covalent bonds, Dopa molecule was conjugated to PA molecule (Figure 3.1a) to exploit crosslinking ability of Dopa molecule. The effect of crosslinking on the mechanical property of PA gel was observed very clearly (Figure 3.5). K-PA, which did not have Dopa molecule, self-assembled and formed a self-supporting gel. Its storage modulus was around 1000 Pa. Compared to K-PA DopaK-PA and DopaK-PA/Fe(III) gels had around 10000 Pa and 12000 Pa storage modulus, respectively. This means 10 times stronger gel. Dopa molecule has two different crosslinking mechanisms. First mechanism occurs by coordination of Dopa molecules with Fe(III) molecule (Figure 3.6a). Second mechanism includes covalent bonding of Dopa molecules (Figure 3.6b). Although the crosslinked gels have similar storage modulus, due to different crosslinking mechanism, we observed different gelation kinetics between DopaK-PA and DopaK-PA/Fe(III) (Figure 3.7). The frequency sweep rheology measurements of gels do not indicate any difference in storage modulus by changing frequency (Figure 3.8). To observe the effect of temperature on the mechanical property of PA hydrogel, rheology measurements were performed at different temperatures (Figure 3.9-3.11). K-PA showed decrease in storage modulus by increasing temperature (Figure 3.9). Different from K-PA, DopaK-PA first showed slight
57
decrease and increase in storage modulus by increasing temperature (Figure 3.10). DopaK-PA/Fe(III) also behave like DopaK-PA, but it showed much slighter decrease (Figure 3.11).
Figure 3.5 Storage and loss modulus of PA gels
58
Figure 3.7 Time sweep rheology measurements of PA gels
59
Figure 3.9 Rheology measurement of K-PA gel by changing temperature