A STRUCTURAL MACROECONOMETRIC
MODEL OF TURKISH ECONOMY
Submitted by
MUSTAFA KEMAL GÜNDOĞDU
This dissertation is submitted for the degree of Doctor of Philosophy
İstanbul Bilgi University Department of Economics
ABSTRACT
This thesis aims to build a small structural macroeconometric model of the Turkish economy by using quarterly data in the period between 1998 and 2014. The model consists of five blocks which are based national income identity, external trade, monetary market, labor force market and national income in terms of production approach. Within-sample forecasting performance of the model is measured by conventional tools while the out-of-sample forecasting performance is tested using confidence intervals generated by stochastic simulations. The trace performance of the model shows that the model is coherent and compatible with the economic theory. Validity of the model is checked both within-sample and out of the sample cases. Results from validity tests indicate that the model is reasonably useful for forecasting and policy analysis. The policy simulations of the model are based on three sets of assumptions: fx rate shock, fiscal policy shock and monetary policy shock. Simulation results suggested that the Turkish economy is highly vulnerable to external shocks through external trade and money market channels. At this point budget discipline appears to be crucial in improving the resilience of the economy against both international shocks and domestic political uncertainties.
ÖZET
Bu tezde 1998-2014 dönemine ait çeyreklik veriler kullanılarak Türkiye ekonomisinin küçük ölçekli makroekonometrik yapısal modelinin oluşturulması amaçlanmıştır. Model, milli gelir özdeşliğinin yanı sıra dış ticaret, para piyasaları, işgücü piyasası göstergeleri ve üretim yöntemine göre hesaplanan ulusal gelirin yer aldığı beş adet bloktan oluşmaktadır. Örneklem içi tahmin sonuçları geleneksel araçlar kullanılarak ölçülürken, örneklem dışı tahmin sonuçları rassal simülasyonlar ile oluşturulan güven aralıkları ile test edilmiştir. Tahmin performansı modelin tutarlı ve ekonomi teorisi ile uyumlu olduğunu göstermiştir. Modelin geçerliliği gerek örneklem içi gerekse örneklem dışı simülasyonlar ile kontrol edilmiştir. Elde edilen sonuçlar modelin tahmin çalışmaları ile politika analizlerinde kullanılabilir olduğunu teyit etmiştir. Tez kapsamında oluşturulan politika simülasyonları kur, maliye politikası ve para politikası şoku olmak üzere üç farklı varsayım kümesine dayandırılmıştır. Simülasyon sonuçları, ekonomiye para piyasaları ve dış ticaret kanalıyla etki eden dış şoklara karşı Türkiye ekonomisinin kırılganlığının yüksek olduğunu göstermiştir. Bu noktada dış şokların yanı sıra yurt içindeki siyasi belirsizliklere karşı dayanıklılığın tesis edilmesi açısından bütçe disiplininin büyük önem taşıdığı değerlendirilmesi yapılmıştır.
C
ONTENTS
1 INTRODUCTION ... 1
1.1SHORT BRIEF ON TURKISH ECONOMY ... 3
1.2CURRENT CONDITIONS IN GLOBAL ECONOMY ... 8
2 SUPPLEMENTARY STUDIES ... 10
2.1MARSHALL-LERNER CONDITION ... 10
2.1.1 Reformulation of the Marshall-Lerner Condition ... 11
2.1.2 Simultaneity Between Imports and Exports ... 12
2.1.3 Turkish Case: Facts and Results ... 13
2.2EXCHANGE RATE PASS-THROUGH ... 15
2.2.1 Data and Analysis ... 18
2.2.2 Findings ... 19
2.2.3 Final Remarks ... 20
3 THE STRUCTURAL MACROECONOMETRIC MODEL OF TURKISH ECONOMY ... 22
3.1LITERATURE REVIEW ... 25
3.2STRUCTURE AND ESTIMATION OF THE MODEL ... 33
3.2.1 Production Block ... 35
3.2.2 National Income Identity ... 38
3.2.3 External Trade Block ... 44
3.2.4 Monetary Market Block ... 54
4 SIMULATION RESULTS ... 63
4.1SCENARIOS ... 64
4.1.1 1st Scenario ( testing accuracy of the model): ... 65
4.1.2 2nd Scenario (FX shock): ... 70
4.1.3 3rd Scenario (expansionary fiscal policy): ... 74
4.1.4 4th Scenario (tight monetary policy)... 77
4.1.5 5th Scenario (forecast simulation, business-as-usual)... 80
4.1.6 6th Scenario (forecast simulation): ... 82
5 CONCLUSION ... 86
6 REFERENCES ... 88
7 APPENDICES ... 97
7.1TECHNICAL DETAILS ... 97
7.1.1 Variance Inflation Factor (VIF) ... 97
7.1.2 The Lagrange Multiplier Test ... 98
7.1.3 Switching Regression ... 99
7.1.4 Unit root tests, Cointegration and Cointegration Regression Methods ... 101
7.1.5 Seasonal Adjustment ... 107
7.1.6 Structural Break Test ... 109
7.1.7 Iteration Methods ... 109
L
IST OF
T
ABLES
TABLE 2.1JOHANSEN CO-INTEGRATION TEST RESULTS ... 14
TABLE 2.2PASS-THROUGH VECM’S ... 18
TABLE 2.3PASS-THROUGH RESULTS ... 20
TABLE 3.1LIST OF THE KEY VARIABLES IN THE MODEL ... 34
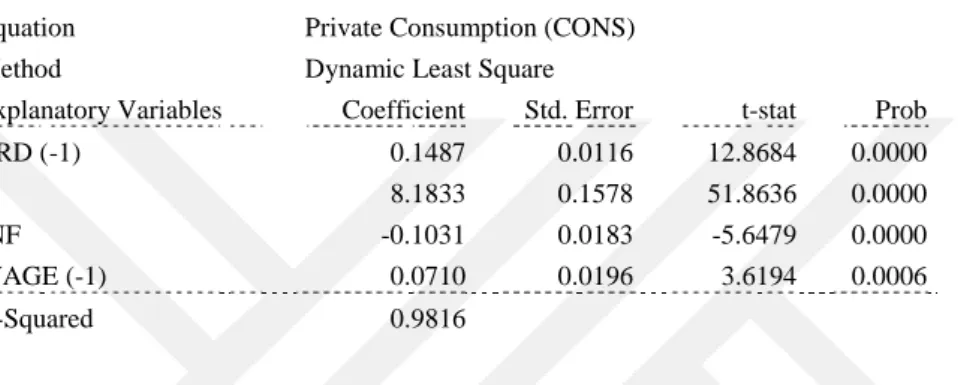
TABLE 3.2ESTIMATION RESULTS FOR THE PRIVATE CONSUMPTION EQUATION ... 40
TABLE 3.3ESTIMATION RESULTS FOR THE INVESTMENT EQUATION ... 42
TABLE 3.4ESTIMATION RESULTS FOR THE SAVINGS EQUATION ... 44
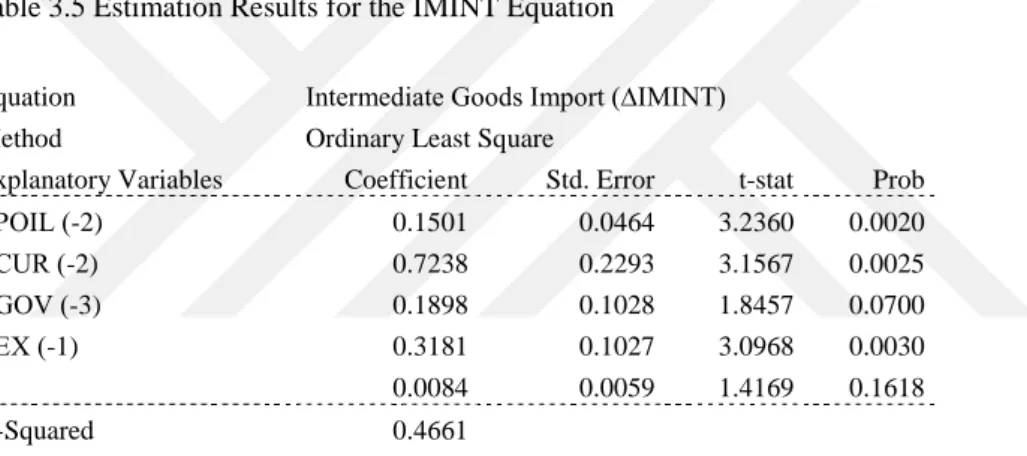
TABLE 3.5ESTIMATION RESULTS FOR THE IMINTEQUATION ... 46
TABLE 3.6ESTIMATION RESULTS FOR THE CONSUMPTION GOODS IMPORT ... 48
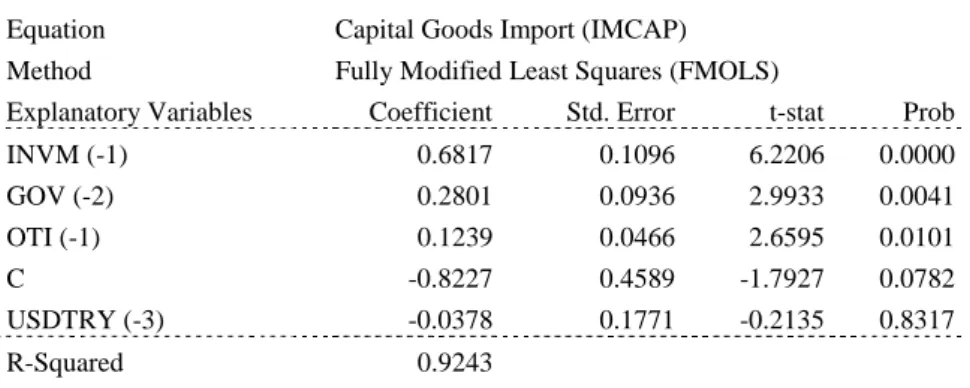
TABLE 3.7ESTIMATION RESULTS FOR THE IMCAPEQUATION ... 49
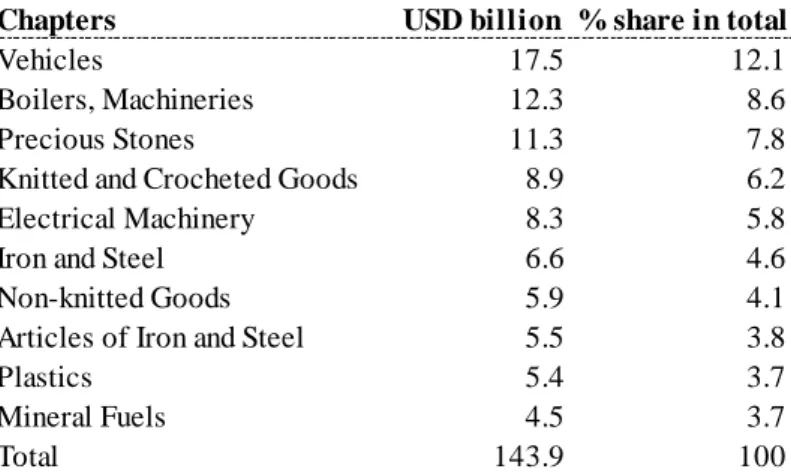
TABLE 3.8EXPORTS BY CHAPTER,2015(GTIP) ... 50
TABLE 3.9ESTIMATION RESULTS FOR THE EXPORTS EQUATION ... 51
TABLE 3.10ESTIMATION RESULTS FOR THE CAD ... 53
TABLE 3.11ESTIMATION RESULTS FOR INFLATION EQUATION ... 56
TABLE 3.12ESTIMATION RESULTS FOR EXPECTED INFLATION EQUATION ... 56
TABLE 3.13ESTIMATION RESULTS FOR THE OTHER INVESTMENT EQUATION ... 57
TABLE 3.14ESTIMATION RESULTS FOR THE PORTFOLIO INVESTMENT ... 58
TABLE 3.15ESTIMATION RESULTS FOR THE BIR ... 59
TABLE 3.16ESTIMATION RESULTS FOR THE CREDIT EQUATION ... 60
TABLE 3.17ESTIMATION RESULTS FOR THE EMPLOYMENT EQUATION ... 61
TABLE 7.1VARIANCE INFLATION FACTORS,VIF>10 IMPLIES MULTICOLLINEARITY ... 112
TABLE 7.2HETEROSKEDASTICITY AND SERIAL CORRELATION TESTS ... 113 TABLE 7.3AUGMENTED DICKEY-FULLER TEST RESULTS ... 114
L
IST OF
F
IGURES
FIGURE 1.1CONTRIBUTION OF NET EXPORTS TO ECONOMIC GROWTH ... 6
FIGURE 1.2IMPORT AND EXPORTS,%YEAR OVER YEAR (YOY) CHANGE ... 7
FIGURE 2.1EXCHANGE RATE PASS-THROUGH DIAGRAM ... 16
FIGURE 3.1CONTRIBUTIONS TO GDPGROWTH,PRODUCTION APPROACH ... 36
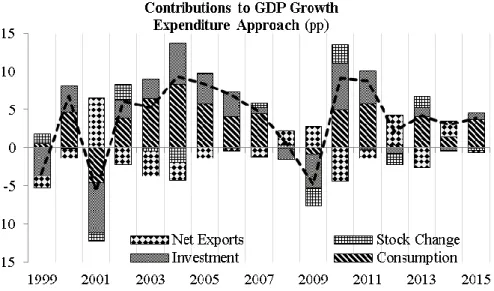
FIGURE 3.2CONTRIBUTION TO GDPEXPENDITURE APPROACH (% POINT) ... 39
FIGURE 3.3CURRENT ACCOUNT DEFICIT AND CREDIT GROWTH ... 51
FIGURE 3.4CURRENT ACCOUNT AND FOREIGN TRADE DEFICITS ... 52
FIGURE 3.5PHILLIPS CURVE FOR TURKISH ECONOMY,2005-2015 PERIODS ... 54
FIGURE 3.6NETWORK OF THE MODEL ... 62
FIGURE 4.1DYNAMIC RESULTS: YOY CHANGE, ESTIMATES VS. ACTUAL VALUES ... 67
FIGURE 4.2DYNAMIC RESULTS, LOG LEVEL, ESTIMATES VS ACTUALS ... 69
FIGURE 4.3RESPONSE OF THE KEY VARIABLES TO FX SHOCK. ... 73
FIGURE 4.4RESPONSE OF KEY VARIABLES TO EXPANSIONARY FISCAL POLICY ... 76
FIGURE 4.5RESPONSE OF KEY VARIABLES TO CONTRACTIONARY MONETARY POLICY ... 79
FIGURE 4.6ESTIMATED OUTPUTGAP ... 80
FIGURE 4.7OUT OF SAMPLE DYNAMIC STOCHASTIC FORECAST RESULTS ... 81
FIGURE 4.8OUT-OF-SAMPLE FX-SHOCK RESULTS ... 83
FIGURE 4.9OUT-OF-SAMPLE FISCAL POLICY SIMULATION RESULTS ... 84
FIGURE 4.10OUT-OF-SAMPLE LOOSE MONETARY POLICY SIMULATION RESULTS ... 85
1 I
NTRODUCTION
Macro-econometric models have been used over the past three decades as important tools of analysis for macroeconomic forecasting and policy assessment (Herve et al. (2011)). Macro-econometric models provide an useful insight into the structural relationship between different key macroeconomic variables. It also helps policymakers with identifying cause-and-effect relationship between the policy and target variables, and helps with making forecasts for the variables. Among the different type of models, macro-econometric models are useful because they illustrate the whole structure of the economy, as well as temporal behavior of the macro-economy. Macro-econometric models also provide an opportunity of tracking the implications of a variety of shocks, (both exogenous and endogenous) and effects of economic policies driven within and between economies and regions (Herve, et al. (2011)).
The concept of macro-econometric modeling was born with the work of Jan Tinbergen in the 1930s. After that many economic institutions and academic researchers have constructed macro-econometric models to illuminate the pattern of domestic output growth and inflation trends, reaction of monetary and fiscal policies in the face of unexpected shocks and the prospects of macroeconomic stability. These models provide frameworks to analyze and observe many aspects of macroeconomic behavior simultaneously and allowing the model builders to study the implications of the economic theories. Attempts to construct macro-econometric model of the Turkish economy have been limited and policy evaluation with the help of macro-econometric models are rarely undertaken. Although one can find small-scale partial econometric models or CGE models based on sector specific relations in Turkish economy, there are
limited numbers works about the general structural macro-econometric models that cover main economic blocks such as consumption, money market, labor market, trade market and so forth…
A structural model is based on mainly 2 sources; economic theory and statistical tools. By analyzing the relationship between the economic variables via statistical tools, the causality of related variables that the economic theory proposed can be tested through an economic data set. Thus, by defining the relationship between the macroeconomic variables it can be determined how and to what extent a change in a variable will reflect to the general economy in medium- and long-term.
Although the estimates obtained from an econometric equation are not always accurate, setting an econometric equation is important since it reflects the set of assumptions of the practitioner and it also provides a basis for projections. Since there are numerous measurable and immeasurable connections between an economic structure, it is difficult to successfully model it by using theoretical equations based on data obtained from questionnaires. But, according to Reiss and Wolak (2007), there are 3 reasons for using the structural modelling.
“First, a structural model can be used in order to estimate the unobserved economic or behavioral parameters that could not otherwise be inferred from nonexperimental data. Second, structural models can be used in order to perform counterfactuals or policy simulations. In counterfactuals, the researcher uses the estimated structural model to predict what would happen if elements of the economic environment change. Finally, structural models can be used to compare the predictive performance of two competing theories. For instance; we could compare the performance of quantity-setting versus price-setting models of competition. It is important to emphasize that these comparisons do not provide unambiguous tests of the underlying economic theories (Reiss and Wolak, (2007)).”
The main macro-economic variables mostly used in structural models are inflation, foreign trade figures, public finance, exchange rates, growth, interest rates, and capital flows. In economy literature, the relations between these variables have been analyzed for many times based on different set of assumptions. In these examinations, generally the partial models have been established, and the inferences have been made regarding the entire economy by using the findings from these examinations. In this thesis also, 3
supplementary studies were involved, and the findings from these researches were used to establish a structural model of Turkish economy.
Since, advanced economies have long-term historical economic data and steady economic institutions; it becomes easier to define the partial economic models for these countries. In developing countries, besides, the continuous transformation in the economic structure makes the linkages between economic data are time-variant. In addition, lack of reliable long-term data in developing countries restricts the economists to establish robust and well-defined economic model. For this reason, the modelers have to be aware of all critical economic and social development in the country to be able to address the structural breaks. So, in an economic modelling process, it is crucial to have detailed knowledge of the historical developments of the economy to define general structure of economy. Since the economic policies that were implemented after the year 1980 and the political events that took place during this period were determinants of the general structure of the economy, Turkish economy was analyzed starting from 1980 in this study
1.1 Short Brief on Turkish Economy
In an economic modelling process, it is crucial to determine the general structure of economy and its historical development. Since the economic policies that were implemented after the year 1980 and the political events that took place during this period were determinants of the general structure of the economy, Turkish economy was analyzed starting from 1980 in this study.
Before 1980, the increase in the oil prices considerably increased the need of FX in Turkey. During this period, since Turkey experienced difficulties to find external funding to import crucial input items for production. To overcome this obstruct in the economy, there was a search for external sources. Thus, World Bank and IMF provided funding resources in return for starting structural reforms. After this, a series of measures called “24th January Decisions” in 1980 was put into practice. With these measures, a transition from “import-oriented” to “export-oriented” economic policy took place. With these regulations, the aim was to increase the openness of the economy, to develop market mechanisms, to ensure fiscal discipline, to get inflation under control and to encourage foreign investors. As a result of these implementations, export rate increased two times more in terms of both nominal value in terms of USD
and the volume. By providing funding resources through the banking sector, private real sector began to get stronger. The ratio of public expenditures to GDP fell, while the ratio of public revenue to GDP arose. On the other hand, the contribution of agriculture to economy continued to decrease during these years, while the weight of service sector in economy became more noticeable.
There was an expansion period in Turkish economy between the years 1984 and 1989. The revival throughout the world economies during this period was in line with Turkey’s export-oriented growth strategy, and this led to an increase in export. However, in 1990, two important external global events that took place that directly affected Turkish economy negatively. These events were the end of Iran-Iraq war and Gulf crisis. These two external phenomena caused the loss of two important markets for Turkey. In addition to these two important events that closely concern and affect Turkey, the global economic activity experienced a contraction in this period. During this period, the increase in the risk perception had a negative impact on the exchange rates, the demand for credit and public debt. The increase in central government budget deficit and ineffective exchange rate policy prepared the atmosphere for 1994 crisis then taking harsh economic measures was inevitable. Although the new program was based on a tight fiscal and monetary policy, it wasn’t implemented effectively due to the early election. Increasing the budget expenditures deteriorated the budged discipline. Then, Turkish economy struggled with the tough and long coalition negotiation after the elections. Finally, the Anayol government was formed. But the problems, however, could not be solved. Political uncertainty caused the delays for measures that had to be taken quickly. IMF officials left Turkey due to this political uncertainty by stating that Turkish economy was worsening. Due to the crisis, banking sector shrank on a real basis and the size of the assets in the sector fell from 44% level of GDP in 1990 to 30% level.
Between 1996 and 1998, due to the fact that the period of short-term governments increased the uncertainty, it was not possible to implement mid- and long-term stabilization programs. On the other hand, due to the base effects of contraction in 1994, Turkey’s economy recorded a rapid grow starting as of 1995. However, the increase in the political uncertainties in Turkey and the outbreak of Asia crisis made the economic outlook gloomier. Treasury’s annual compound interest rate reached 106%, and budget deficits reached a point, which was difficult to handle, and hyper-inflation concerns
prevailed. General election and the devastating earthquake in August 17th worsened the economic condition in year 1999. The new coalition government that was formed in 1999 agreed to negotiate with IMF in order to prevent that negative course and to find external funding. However, the agreement was not considered to be a way of starting a new process but as the continuum of the early stand-by meetings. In the general elections in April, three-party coalition government signed a mid-term stand-by arrangement which encompasses 2000-2002. As a result, in January 2000, “Inflation Reduction Program”, which included tight monetary and exchange rate policies and structural transformations in banking sector, was launched. However, Turkish economy experienced a domestic financial crisis in November 2000 due to the short currency position of banking sector, high amount of capital outflow and rising concerns in stock market. Rapid increase in the interest rates distorted the economic structures of the state and private banks, and market’s confidence about the IMF program worsened. Due to the shortage in liquidity, banking sector Turkish economy faced a currency crisis in February, 2001.
In April, 2001, “The Transition to a Strong Economy Program” prioritizing the economic stability was adopted. This program involved a series of immediate measures about public finance, income policies, privatization, banking, and monetary policy. The three-staged program was constructed by taking the impacts of the November 2000 and February 2001 crisis on financial market and particularly on banking sector into account. These stages were quickly getting out of crisis environment through the measures regarding banking sector, preparing a mid-term perspective for economic units to provide stability in exchange rate and ensuring the sustainable growth by establishing a macro-economic stability. During 2002-2007 period, after 2001 crisis, Turkish economy grew averagely by 6.9% on annual basis in parallel with the stability program. Considering the 6.6% growth rate in the first quarter of 2008 as well, it seen that the economy grew for 25 quarters without interruption. This performance indicates the longest uninterrupted growth period in Turkey’s history.
Global economic condition was influential on the growth performance of Turkish economy during the global financial crisis started in 2008. So, Turkish economy contracted for 4 consecutive quarters starting from the last quarter of 2008 due to the global financial crisis. However, the economy achieved a strong growth performance in parallel with the other developing countries, and it grew averagely by 9% annually
between 2010 and 2011 thanks to the acceleration in capital flow in global market. After the outperformance in economic growth, the average growth fell to 3% in 2012 and 2013 due to the measures taken by BRSA and CBRT to cool the overheating economy and the developments regarding the global liquidity conditions.
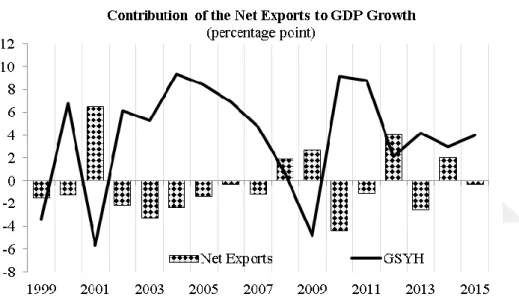
Even if significant achievements have been gained in inflation, public finance, and financial sector regulation in last decade, the current deficit becoming larger because of the enlargement in foreign trade deficit remained in the agenda of economy. While, Turkey’s economy grew by 4.8% during 2003-2014 periods on average, net exports generally limited the economic growth. The exception to this situation was observed in the years 2008, 2009, 2012 and 2014.
Figure 1.1 Contribution of Net Exports to Economic Growth
While analyzing the foreign trade, figures after 2003 revealed that the annual pace of import growth was generally higher than export’s (Figure 1.2). Particularly it is noticeable that the years 2010 and 2011 were the years, when a high rate of growth was achieved and the expansion of foreign trade deficit accelerated. In this period, CPI-based real exchange rate index followed an upwards course and pointed out an appreciation in Turkish Lira. This situation corroborates the ideas that relative appreciation in TRY played a significant role in the expansion of import volume. On the other hand, the fact that export rate increased by over 10% in 2010-2011 was also remarkable. During this period, importance of export market diversification has grown due to the fact that economic activity in Euro-Zone and other major export markets lost momentum. With the impact of the increase in export volume to alternative markets
such as Middle East and North Africa, export performance maintained a positive outlook during this period.
Figure 1.2 Import and Exports, %year over year (yoy) change
Although, a relative revival in domestic demand in European economies, which constitute the biggest export market of Turkey, was expected since 2012, the recovery in European economies couldn’t be stabilized yet as of the year 2015. Thus, relatively weak performance of European economies limited the external trade performance. Besides that, the on-going problems in Iraq and increasing geopolitical risks were considered to be important elements of risks in terms of the external trade.
As a result, Turkish economy went through a significant transformation process after the crisis in year 2001. During this period, public finance showed a stronger performance in terms of both rates of the budget balance and the debt stock to GDP. Exchange rates also fell to lower levels, when compared to 2001, in parallel with the decline in the inflation and ensuring the fiscal discipline. Banking sector achieved a resilient outlook in terms of both its asset/liability structure and risk management with the help of economic and political stability as well as restructuring program. During this period Turkey has also experienced “the demographic opportunity which played an important part in the recent achievements of the Turkish economy. A demographic opportunity window is the period, in which the working-age population is growing and the young cohort decreasing, while the old cohort is still small. This is the period, when the rate of the dependent population that are between 1 and 14 year-old and over 65 year-old, to the total population reduce its lowest level. So, demographic opportunity
window offers a unique opportunity for a country. If proper employment policies are applied, the country is able to record high growth rate during this period and makes significant progress in the level of development. For instance; it is observed that the rapid growth period that Japan experienced during 1960s and many Far East countries experienced in 1970s happened at the same time as the demographic opportunity window (Tansel and Kan (2012)). Turkey’s demographic structure and population projections indicate the fact that Turkish economy had this demographic opportunity window in the last decade.
1.2 Current Conditions in Global Economy
After the global financial crisis in 2008, major central banks’ efforts to stimulate the economy through lower interest rates were accompanied by implying an abandonment of the central bank’s traditional monetary policy practices. The global financial crisis was eight years ago, but major central banks such as Fed, BoJ, ECB, BoE still continue expansionary monetary policies. However, these policies have been subjected to debates in economic literature. Many economists believe that global economy still needs further monetary expansions, and it fails in stimulating the employment in developed countries.
When the performance of global economy is analyzed, it can be seen that a modest and uneven recovery continues in developed countries, with a gradual narrowing of output gaps (WE0, 2015). Thus, in December 2015, the Federal Open Market Committee (FOMC) decided that the economic conditions and the economic outlook warranted the commencement of the policy normalization process. This situation demonstrates that the abundance of global liquidity that developing countries benefited from during the period after the crisis will not exist as much in the following period. Due to the gradual tightening of global liquidity conditions, short-term capital movements to developing countries are expected to fluctuate and lose momentum in the forthcoming period. Indeed developing economies currently are suffering from capital flight already as of first quarter of 2016. Therefore, it is anticipated that the developing economies, including Turkey, will be compelled to grow through trade channel instead of finance channel in the forthcoming period.
On the other hand, ECB, BoJ, BoE and PBOE are still far away from monetary policy normalization. Since the economy in Euro Zone, which came to a standstill after the global crisis, continue to struggle with low inflation and recession problems, ECB
launched an asset purchase program and reduced the deposit rate to negative territory in order to support the economy and to cope with deflation. BoE also keeps policy rate at 0.5% since March 2009 and continues Asset Purchase Programme that helps in sustaining the growth and employment. BoE states that the global growth has fallen back further since the year 2013, as emerging economies generally continued slowly. Similarly, BoJ maintained its extraordinary expansionary monetary policy to fight against the deflation concerns. These accommodative monetary policies limited the contractionary effect of Fed’s normalization process on the global financial market. All these information have significant contributions for building a reliable set of assumption for the model structure. Rest of this study is structured as follows: Section 2 introduces two supplementary studies are enclosed to elucidate the relationship between key macroeconomic variables such as, exchange rate, inflation, foreign trade figures. Basic concepts of modelling, literature review, detailed explanation of model structure and behavioral equations are given in Section 3. Simulation results are presented in Section 4 and Section 5 concludes.
2 S
UPPLEMENTARY STUDIES
Two supplementary studies performed during the doctoral studies to form a on relations between key macroeconomic variables. In the first study, effects of a change in FX rates on foreign trade balance are studied through a new formulation of Marshall Lerner condition. In second one, effects of a change in FX rates on inflation are investigated by using exchange rate pass-through coefficients.
2.1 Marshall-Lerner Condition
Current Account Deficit of Turkey increased in a largest scale of the country history in the last decade. It was argued that one of the remedies of the deficit problem is to decrease the overvalued domestic currency. The effects of currency depreciation on a countries’ trade balance are traditionally analyzed by examining Marshall-Lerner condition (MLC). The MLC suggests that the depreciation of a currency will improve a countries trade balance if the import and export demand price elasticities are greater than one in the long-term.
The economic literature includes number of theoretical and empirical studies of the impact of exchange rate variations on the balance of trade. Some of them are Miles (1979), Bahmani-Oskooee (1998), Wilson (2001), Kale (2001), Mahmud et al (2004), Gomes and Paz (2005), Matesanz and Fugarolas (2009), Çelik and Kaya (2010), Hsing (2010), Yazici and Klasra (2010), Welfens (2012), Sastre (2012) and Soleymani and Chua (2014). Despite their number, they fail in agreeing on the effect of currency devaluation on trade balance.
Kale (2001) employed a long- and short-term methods using quarterly Turkish data between 1984 and 1996. Co-integration test was carried out in order to estimate the long-term elasticities. The study concluded that the real depreciation improves Turkish balance of trade in those years well before the large structural change occurred in Turkey. Çelik and Kaya (2010) analyzed Turkey’s bilateral trade dynamics with respect to a panel data of seven countries for the period 1985Q1 to 2006Q4. They questioned the existence of a J-curvei by analyzing the relationship between real exchange rates, real income and trade balance for Turkey. They concluded that the effect of devaluation in Turkish currency on trade balance is a country specific phenomenon. Yazici and Klasra (2010) used the quarterly data covering the period 1986 and 1998. Their study examined the J-curve effect in two industries (manufacturing and mining) of Turkish economy.1 They highlighted a special structural issue on Turkish economy; the import content of export. They concluded that in both sectors the J-curve exist and the violation of the J-curve effect is more severe in the sector with higher import content. Sastre (2012) focused on the issue of simultaneity between export and import flows for the Spanish economy. The issue is also important for Turkish economy. Sastre (2012) reformulated the ML condition in open economies and argued that, in the long-term, the impact of exchange rate fluctuations on the balance of trade of countries with open economies not only depends on export and import price elasticities but also on the cross elasticity values between export and import.
2.1.1 Reformulation of the Marshall-Lerner Condition
In a standard Marshall-Lerner argument;
lnTB = LnX –LnM (2.1)
where, TB is the trade balance. 𝜕𝑇𝐵
𝜕𝑒 > 0, when (𝜀𝑥,𝑒+ 𝜀𝑚,𝑒) > 0 where 𝜀𝑥,𝑒 and 𝜀𝑚,𝑒
are the export and import demand elasticities, respectively. Sastre (2012)’s reformulation of the Marshall–Lerner condition, according to the classification of
1 The theory of the J curve: as a result of devaluation, the trade balance will first worsen and then after the
countries in relation to cross elasticities between export and import consists of four propositions.
Firstly, if 𝜀𝑚,𝑥= 0 and 𝜀𝑥,𝑚 = 0, where 𝜀𝑚,𝑥 and 𝜀𝑥,𝑚 are cross elasticities of import and export, respectively, Marshall Lerner condition is satisfied when (𝜀𝑥,𝑒+ 𝜀𝑚,𝑒) > 0. In other words, it characterizes an economy that depends slightly on other countries.
Second proposition states that, If 𝜀𝑚,𝑥 ≠ 0 and 𝜀𝑥,𝑚= 0 , 𝜕𝑇𝐵
𝜕𝑒 > 0 when (𝜀𝑥,𝑒(1 +
𝜀𝑚,𝑥) + 𝜀𝑚,𝑒) > 1, this is an economy that the demand for imports depends on exports but demand for exports does not depend on imports. This is the condition applies to those economies, in which many industries import raw materials or intermediate goods more than exporting final goods.
Sastre (2012)’s third proposition considers the case, where export depends on import,
but import would not depend on exports. The proposition outlines that 𝜕𝑇𝐵
𝜕𝑒 > 0 when
(𝜀𝑥,𝑒+ 𝜀𝑚,𝑒(1 + 𝜀𝑥,𝑚)) > 1.
The last case states that exports demand depends on import demand, and vice versa. So, the Marshall Lerner condition is valid when (𝜀𝑥,𝑒(1 + 𝜀𝑚,𝑥) + 𝜀𝑚,𝑒(1 + 𝜀𝑥,𝑚)) > 1.
2.1.2 Simultaneity Between Imports and Exports
This study utilizes quarterly data between the years 1998 and 2014, and uses Sastre’s analytically developed reformulation of the Marshall-Lerner condition for Turkey. Foreign trade data are taken from TURKSTAT, while the source of real exchange rate data is OECD. National investment expenditure, which gave the best result in the analysis as an indicator for domestic demand, is gathered from national income identity. Total GDP of EA-18 countries, which is assumed as a proxy variable for world demand, was taken from EUROSTAT. Before applying the empirical models, the series are transformed into log form and adjusted for seasonality. Deseasonalization is done by using TRAMO/SEATS (Time Series Regression with ARIMA Noise, Missing Observations, and Outliers) method.
Turkish import and export demand equations and their determinants are represented in the following equation:
lnX = f( lnre, lnEAD, lnM) (2.2)
lnM = f( lnre, lnI(tr), lnX) (2.3)
where, M is the volume of imports of goods and services, I(tr) is the national investment expenditure, EAD is the total GDP of Euro Area-18 as a proxy of world (external) demand, and finally lne is the reel exchange rate. The ln stands for logarithm.
Maximum likelihood co-integration procedure proposed by Johansen is used to check if there is a long-term equilibrium relationship between the variables in Eqs. (1) and (2) for Turkey. After obtaining a cointegrated relation between the variables, the residual of the long-term equation is used in the short-term specification as error correction process.
It is required to determine the degree of integration of variables to perform the co-integration analysis. Before conducting the co-co-integration analysis, Augmented Dickey Fuller (ADF, Dickey and Fuller (1979)) and Phillips-Perron (PP, Phillips and Perron (1988)) unit root tests are performed to determine if all variables have same integration order. Test results confirmed that all variables are stationary at their first differences. In addition to that, the trend, intercept and lag options for each co-integration equation are determined by testing all available options. Results indicated that the level export data have no deterministic trends while import data have quadratic deterministic trends
2.1.3 Turkish Case: Facts and Results
Energy dependence of Turkish economy, which is evaluated as a major structural drawback, may lead to obtain vague results from foreign trade models. According to data, share of oil imports in total imports was about 20% between years 1998 and 2014. Considering the necessity of oil demand in developing countries as Turkey, it is expected that price elasticity of oil import is relatively low. So in this study, oil-excluded total imports are also used as an import indicator to specify price elasticity of imports.
Table 2.1 Johansen Co-integration Test Results
(*) Null Hypothesis states that there is no cointegration relations between variables.
(**) Critical values for Oswald-Lenum (95%) were 29.68 for “At most 1”, 15.41 for “At most 2” and 47.21 for “None”.
The results of Johansen both for 2 and 6 lag orders corroborated the hypothesis that there are two co-integrating relationships between imports and exports. Moreover, at least two valid co-integration equations were obtained valid when all variable in equations. (1) and (2), and then included into analysis. Estimated coefficients in co-integration vectors were normalized in order to interpret the results. So, it enables us to read the elasticities directly from co-integrating vectors.
Results indicated that all models have at least 1 integration equation. The co-integration vectors obtained were;
𝑙𝑛𝑋 = 0.99 𝑙𝑛 𝑀 − 0.66𝑙𝑛𝑟𝑒 + 0.59𝑙𝑛𝐸𝐴𝐷 (2.4)
𝑙𝑛𝑀 = 0.49 𝑙𝑛 𝑋 + 0.60𝑙𝑛𝑟𝑒 + 0.44𝑙𝑛𝐼(𝑡𝑟) (2.5)
𝑙𝑛𝑋 = 0.99 𝑙𝑛 𝑂𝐸𝑀 − 0.90𝑙𝑛𝑟𝑒 + 0.96𝑙𝑛𝐸𝐴𝐷 (2.6)
𝑙𝑛𝑂𝐸𝑀 = 0.48 𝑙𝑛 𝑋 + 0.59𝑙𝑛𝑟𝑒 + 0.49𝑙𝑛𝐸𝐴𝐷 (2.7)
The results obtained from the analysis indicate that the coefficients in both of imports model were not statistically different. This result was against the presumptions about distorted effects of oil imports on the import elasticity, and it brings another aspect to the forefront; oil imports exhibited a similar course with the other chapters in imports.
Coefficients of reel exchange rates are statistically significant and economically coherent with the theory in all model. Furthermore, the sum of both import and export
Johansen Co-integration Test Results #ofCoint. Equations* Trace Statistics** Probability 1.lnX=ƒ(lnM,lner,lnEAD) at most 1 30.91 0.03 2.lnM=ƒ(lnX,lner,lnI(tr)) none 37.24 0.03 3.lnX=ƒ(lnOEM,lner,lnEAD) at most 2 16.77 0.03 4.lnOEM=ƒ(lnX,lner,lnI(tr)) none 72.06 0.00
elasticities are greater than 1, indicating that standard Marshall-Lerner condition was valid for Turkish economy in the long-term.
This result contradicts with similar studies previously carried out for Turkish economy. Previous works generally covered the period before the year 2000, when Turkish economy struggled with the high inflation, strict trade tariffs of the neighbors and inadequate financial market regulations. Thanks to the financial sector adjustment and restructuring banking sector implemented in the aftermath of the financial crises during 1999-2001, many economic achievements were attained elaborately in both reel and public sectors. So, it is considered that the distorted effects of the external factors on the relation between foreign trade figures and exchange rate were relatively limited in 2000’s compared to the previous decades.
Results also indicated that the condition expressed in 4th proposition was verified for Turkey. In other words, import and export in Turkey simultaneously are dependent each other and the condition;
(𝜀𝑥,𝑒(1 + 𝜀𝑚,𝑥) + 𝜀𝑚,𝑒(1 + 𝜀𝑥,𝑚)) > 1
(0.66𝑥,𝑒(1 + 0.49𝑚,𝑥) + 0.60𝑚,𝑒(1 + 0.99𝑥,𝑚)) = 2.18.
In the case of Turkey, the long-term estimations of the price elasticities of exports and imports, and the respective cross elasticities, lead us to conclude that currency devaluation would, in the long-term, will improve the balance of trade.
2.2 Exchange Rate Pass-Through
The fluctuations in the exchange rates determine the domestic prices in different ways:
These fluctuations in the exchange rate impact the domestic prices through import goods. The scale of this impact is based on the factors such as the level of the competitiveness of countries and the price elasticity of the import goods. The scale of the shock on exchange rate might impact the pass-through effect.
Sometimes, small changes in exchange rate are not reflected on the prices due to the pricing strategies adopted by foreign trade companies.
Exchange rate regime is considered to be another factor determining the pass-through. During floating exchange rate, the relation between exchange rate and
domestic prices weakens in an economy carrying out inflation-targeting regime. However, in his study, Damar (2010) stated that the exchange rate fluctuation was more effective on inflation before floating exchange rate regime was adopted.
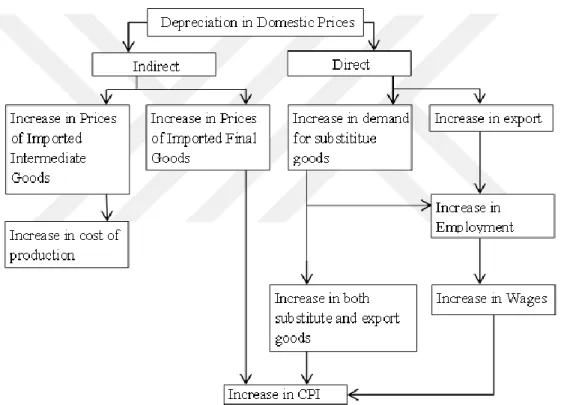
In economics, pass through is generally defined in two ways as direct and indirect. Direct way is associated with the concepts of “Law of One Price” and “Purchasing Power Parity”. According to them, for a particular import price, the changes in exchange rate are reflected on domestic prices. The increase in exchange rate causes domestic goods to be cheaper for foreign customers and thus leads to an increase in the amount of the export and the total demand (Damar (2010)) (Figure 2.1).
Figure 2.1 Exchange Rate Pass-Through Diagram
It is assumed that the exchange rate pass through occurs through indirect way in Turkey. So, the exchange rate pass-through effect also indicates the sensitivity of the producer prices to exchange rate fluctuations in countries highly dependent on import like Turkey. Determining to what extent the fluctuations in producer prices reflect to the consumer prices is important for predicting the course of inflation and the optimal (the most appropriate) monetary policy that will be applied based on the target inflation.
Openness of the economy to global market is another factor, which determines the exchange rate pass through. In economies, which are highly open to global market,
exchange rate shocks result in fluctuations in prices of intermediate goods as well as the final goods. For instance; in countries like Czech Republic, Hungary and Thailand, where the level of openness is high (in these countries, the ratio of foreign trade volume to GDP is over 80%), it is observed that the pass through effect is also high.
Taylor (2000) stated that the commitment to price stability of the inflation targeting (IT) strategy will decrease the pass-through, and this will help with keeping inflation at lower levels. Gagnon and Ihrig (2004) affirmed that the level of pass-through is especially correlated with the implementation of inflation targeting and with the changes in the monetary policy process. Ball and Reyes (2004) stated that the ERPT would decrease as the monetary policy regime becomes credible, inflation becomes more sustainable and the economy approaches to its long term potential growing trend.
Many studies on the impact of exchange rate fluctuations on inflation have been conducted in Turkey. Leigh and Rossi (2002) examined the impacts of exchange rate fluctuations on price index using VAR analysis for Turkey. Findings gathered through the study, which analyzed the period between 1994 and 2000, demonstrated that the impact of exchange rate on prices lasts after a year, yet a great part of this impact is observed in the first four-month period. In addition to this, the findings also indicate that the pass through rate of producer prices is higher than the pass through rate of consumer prices. In the study, it is also stated that the scale of pass through is larger than the one in other developing countries.
In their study, Kara and Öğünç (2005) analyzed the exchange rate pass through in two periods, which are floating and stable exchange rate regimes’ periods. The findings of stable exchange rate period are compatible with those Leigh and Rossi (2002) obtained, and also it was concluded that the impact of this pass through weakened after shifting to floating exchange rate.
Damar (2010) analyzed the pass through by dividing 1995-2000 periods into two categories as floating and stable exchange rate regimes. In his study, the exchange rate pass through into prices was examined separately in terms of both consumer price index inflation and core consumer price index inflation. As a result, the findings indicated that the exchange rate pass through effect into consumer price index inflation were lower than the effect on the core inflation indicator. Damar (2010) stated that in the exchange rate pass through had slackened in years due to the fact that the frequency of external
shocks lowered and the inflation level declined after the transition into inflation targeting period.
2.2.1 Data and Analysis
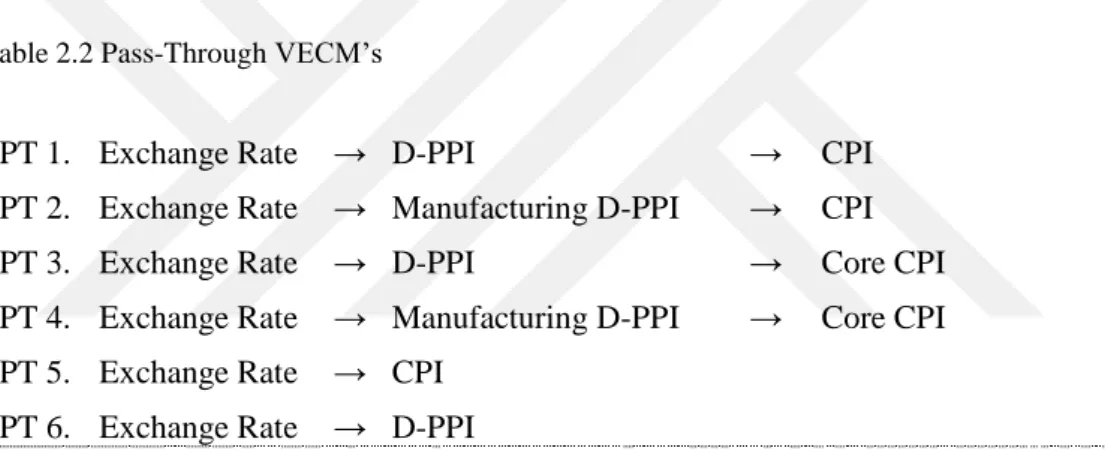
In this study, there is an attempt to determine how exchange rate shocks affected inflation in January 2003 – December 2014 period. For that period, pass through effect is examined in two periods, which are pre-crisis (before January 2009) and post-crisis (January 2009 and later) periods. There are 5 variables in their model (Producer Price Index, Manufacturing Industry Producer Price Index, Consumer Price Index, Core Consumer Price Index, and Exchange Rate). By using these variables, 4 different pass through equations were analyzed (Table 1). In this study, to determine the direction and scale of the pass through, the VECM (Vector Error Correction Model) model was used and the distribution of this pass through was analyzed through the cause-effect function.
Table 2.2 Pass-Through VECM’s
In data set, currency basket (0.5*EUR+0.5*USD) as an exchange rate, Consumer Price Index, which was announced by TURKSTAT based on 2003=100 as price index, Producer Price Index, core consumer price index denominated by H, and industrial producer price index, broad definition of money supply including currency in circulation, demand and time deposits in billion Turkish Lira, manufacturing industry production index, import Price Index, spot prices of Brent crude oil prices in dollars per barrel also were included in this analysis. By using H defined core consumer price index having specified coverage which excludes unprocessed food products, energy, alcoholic beverages, tobacco products and gold, it is aimed that the pass through will be estimated by excluding the temporal external factors.
Standard time series approaches are utilized to test stationarity, autocorrelation, multicollinearity and heteroscedasticity. The problem related to heteroscedasticity in the
PT 1. Exchange Rate → D-PPI → CPI
PT 2. Exchange Rate → Manufacturing D-PPI → CPI
PT 3. Exchange Rate → D-PPI → Core CPI
PT 4. Exchange Rate → Manufacturing D-PPI → Core CPI
PT 5. Exchange Rate → CPI
data was solved through White heteroscedasticity estimation. ADF (Augmented Dickey Fuller) test results used in stationarity test indicate that the data in levels were not stationary while first differences were. (See Appendix)
The lag period in the VECM model was determined based on Akaike Information Criterion (AIC) and Schwartz Information Criterion (SIC). These two criteria suggested different length of lag regarding the period to be analyzed. Each model was used separately for the proposed length of lag and the one, which has the highest explanatory value, was taken into consideration. In the analysis carried out in the post-crisis period, both criteria showed the same length of lag.
The variables were included into VECM model according to the order in the Table 1. Therefore, exchange rate was taken as an external variable in all models and the impacts of the exchange rate shocks were determined through the order. That’s why; in first four models, the interaction chain from exchange rate to producer prices then from producer prices to consumer prices was taken into consideration in the analysis.
2.2.2 Findings
Similar findings were obtained from the four models. The results of the PT Equation 1, which demonstrates the exchange rate pass through to consumer price along producer prices, are consistent with those in PT Equation 2. The results of PT Equation 4, which determine the exchange rate pass through to core consumer price index along producer price index, are also in line with those in PT Equation 3. Taking the similarities among the results into consideration, it is decided to focus on only the results of PT Equation 1 and 4 for the sake of brevity.
Import prices respond relatively quickly to an exchange rate change. After three months, 48% of a change in the exchange rate is passed into import prices, and after 12 months, the pass-through is as much as 80%. Producer prices respond much more sluggishly, with only around 8% pass-through effect after three months. However, after a year, the exchange rate pass-through effect to producer prices reached at 28%. The response of consumer prices to exchange rate changes is relatively limited with 12%.
Table 2.3 Pass-Through Results
2.2.3 Final Remarks
Findings gathered from the study are compatible with the other studies for Turkish economy. The results point out that the fluctuations in exchange rate have influences on the course of both producer and consumer price indices, while these influences have diminished through the analysis period.
After the 2008 crisis, inflation exhibited a flat course in many developed and developing countries, despite the expansionary fiscal policy owing to the shrinking global demand and high volatility in commodity prices. The inflation rate in Turkey also reduced to 5% level depending on the weakness in global and domestic economic performance throughout this period. Thus, it was considered that the relation between exchange rate and inflation may alter after the global financial crisis. To test this hypothesis, pass through effect between years 2010 and 2014 is also examined in this study. However, the findings are empirically irrelevant due to the lower inflationary environment during this period
The results of the analysis indicate that there is a higher impact of the pass through on core inflation compared to consumer price index. This result may refer that the pass through impact on energy and gold prices is higher while it is much lower in alcoholic drinks, tobacco and unprocessed food products. That’s why; the total contribution of these items to the pass through is very limited. Thus, the exchange rate pass-through into headline consumer price index is lower in proportion to the core inflation figures. Besides that, comparing the impact of the exchange rate shocks on producer prices to those on consumer price index revealed that producer prices are more sensitive to change in exchange rate.
According to some economists, since exchange rate pass through effect declined, CBRT had more opportunities than before to take precautions in order to maintain the financial
∆FX=%10 After 3 months After 6 months After12 month
Import Price Index 4.76% 6.31% 7.92%
D-PPI 0.84% 1.97% 2.81%
CPI 0.43% 0.94% 1.23%
stability and to support the economic activity by subordinating inflation target. On the other hand, classical methodology of the exchange rate pass-through analysis excludes some other important structural determinants of the inflation rate such as the monetary policies on global scale, commodity prices, inflationary/deflationary pressures depending on global demand, and etc. So, CBRT has to consider the developments in factors outside of its control such as climate condition, commodity prices, monetary policies in developing countries, and analyze the possible repercussion of such shocks on inflation dynamics to implement an efficient monetary policy.
3 T
HE
S
TRUCTURAL
M
ACROECONOMETRIC
M
ODEL OF
T
URKISH
ECONOMY
Macroeconomic models help the policymakers to evaluate the policies in a scientific and systematic level. Since, forecasting has a crucial role in macroeconomic policy decision; large-scale structural macroeconomic models have an important place in a tool-box of policy makers (Pescatori and Zaman (2011)). According to Reiss and Wolak (2011) structural econometric models have the advantage of detailing the economic and statistical assumptions required to estimate economic quantities. And structural models must have flexible statistical descriptions of data, respectful of the economic institutions under consideration and sensitive to the non-experimental nature of economic data. So if the practitioner has decent knowledge on the economic theory, estimating a structural econometric model provided significant benefits to test both linkages of the key macroeconomic variables and economic theories which are designed to identify these relations by constructing valid and coherent economic model (Reiss and Wolak (2011)). Structural models are built using the fundamental principles of economic theory, often at the expense of the model’s ability to predict key macroeconomic variables like GDP, prices, or employment. In other words, economists who build structural models believe that they learn more about economic processes in a cause and effect relation through a scientific approach (Pescatori and Zaman (2011)).
Structural econometric modelling was popular in the last decades. However, it lost its popularity to Computable General Equilibrium and Dynamic Stochastic General Equilibrium Models. The main reason is the Lucas Critique (Lucas (1976)), which argues that it is naive to predict the effects of a change in economic policy on the basis of relationships observed in historical data. In other words, parameters in econometric models are not policy-invariant, but they would change whenever policy is changed. Since any change in policy will systematically alter the structure of econometric models, the outcomes of policies based on these models would potentially be misleading. Thus, the Lucas critique suggests that the economists should model the "deep parameters" (by relating them to preferences, technology, and resource constraints) that are assumed as individual behavior; so-called "micro-foundations." So this critique brings us into DSGE, which dominates the currently popular modelling field.
Despite of its popularity, main limitations of the DSGE models are connected with its essential neoclassical microeconomic assumptions of (1) “rational behavior” of a representative agent that maximizes consumption under a budget constraint and maximizes profits in production with a resource constraint, within (2) a very well behaved market clearing process and guided by (3) rational expectations (Garcia (2011)).
First critique is based on the study of North (1993) who is the 1993 Nobel Prize winner. North (1993) demonstrated that under uncertainty, which rises with shocks affecting macroeconomic performance and these shocks are very frequent in today’s globalized world, it is not possible to assume the idea of (1) a “rational behavior” defended by conventional neoclassical economics and it is more close to real life to accept that people learn and behaves by trial and error (Garcia (2011)). On the other hand, seven recent Nobel Laureates emphasized that the assumption of an automatic adjustment that clears the markets is far from been true due to quite a number of reasons. Hence, there is plenty scientific evidence that a permanent trend towards (2) market automatic adjustment in the sense of market clear with full employment does not exist (Garcia (2011)).
Last critique is correlated with the rational expectations theory which is influential on Lucas Critique, indicates that every agent in an economy has best guess of future events using all the information available today. It refers that current expectations about the
future is totally accurate thus current market equilibrium values are equivalent to the value that it will obtain in the market equilibrium tomorrow. However, according to Bandura (1986) human behavior is a result of the dynamic interaction between personal factors, behavioral patterns and environment. Behavior, for this approach, is regulated by a previous cognitive process (Garcia (2011)). Clearly in this case the rational expectation theory is correct only if the future is a repetition and identical copy of the past market equilibrium. But when the future is an identical copy of the past it is the same to use rational or adaptive expectations since the first ones obtain information from the future, the second ones from the past but in both cases is the same information (Garcia (2011)).
Furthermore according to Pescatori and Zaman, the contribution that DSGE models have provided is mainly methodological, making them a useful complement to, but not a substitute for, large-scale macroeconomic models. Princeton economist Christopher Sims also characterizes DSGE models as useful story-telling devices that cannot yet replace large-scale models for forecasting purposes (Pescatori and Zaman (2011)).
There are also many criticisms about DSGE. For instance; Robert Solow and Narayana Kocherlakota, (the former President of Minneapolis FED), claimed that the DSGE models have failed in foreseeing the financial crisis before 2008. Furthermore, given the difficulty of constructing accurate and valid DSGE models, most of the central banks still rely on the traditional macro-econometric models for short- and long- term forecasting. It is considered that the DSGE need to incorporate relevant transmission mechanisms or sectors of the economy. In addition some issues still remain on how to empirically validate the model and on how to effectively communicate their features and implications to policy makers and to the public. In overall, DSGE models have significant limitations on using in Central Bank’s policy simulations (Tovar 2008). So, policy makers are still relying on structural models. Policy makers are better equipped in order to evaluate the direction and magnitude of the reaction of economy to internal and external shocks with a help of structural models. Main criteria for the selection between DSGEs and traditional structural models lie in the tradeoff between statistical validation with reliable forecasts and adaptability of behaviors. So, in this thesis structural modelling is chosen as the approach that is based on practical concerns.
The aim of this study is to develop an open-economy framework, and to attempt to take the unique features of the Turkish economy into account. The model has equations and
identities that represent the behaviors of macroeconomic variables. For convenience, the model consists of 5 blocks; (i) production, (ii) national income identity, (iii) external trade, (iv) monetary market and (v) labor force market. The model captures the nexus between output, government deficit, foreign trade, money market, and price level, and can be used in order to examine the effects of both of domestic and external shocks to the economy. Furthermore, with additional identifications, one can construct monetary transmission mechanism in order to illustrate CBRT’s policies used recently. So, the model is also applicable for examining the general effects of monetary, fiscal and exchange rate policies on the overall economy.
3.1 Literature Review
As losing popularity in economic modelling after 2000’s, there is not enough number of structural macroeconometric models revealing the changes in Turkish economy after the financial crisis in 2001. The main studies in which macroeconometric models are developed for Turkish economy can be listed as; (1967), Korum (1969), Blitzer et al. (1970), Uğurel (1971) Celasun (1971), Lewis and Urata (1983), Özmucur (1980) and (1984), Yörükoğlu (1980), Yağcı (1983), Fair (1984), Celasun (1986), Gupta-Togan (1984), Uygur (1987), Yeldan (1989), Neck and Karbuz (1993), Özmucur (1993), Özatay (2000), Aysoy et al. (2005), and Özatay (2007).
Uygur (1967) uses appropriate equations on consumption, investment, production (econometric equations on national income, agricultural and industrial production), foreign trade, and taxes. Uygur (1967) divides the taxes into two categories; the direct and indirect taxes. According to Uygur (1967) the results reached in the book are generally the usual ones. The results obtained from investment block show that the previous year’s capital stock had a positive effect on current investment rather than a negative effect. It contradicts with the expectation of economic theory, which follows the acceleration principle. This effect is expected to be negative. In other words, according to the economic theory, public or private capital stock of the previous periods should cause a crowding-out effect because of the use of scarce resources (Uygur and Bulutay (2004)). The second result is on the effectiveness of prices in foreign trade. The results of foreign trade block have shown that prices have no significant effects on the imports and exports of Turkey. In the following study (Uygur (1986) p. 96-97), the same result has also been also obtained.
Aysoy et al. (2005) constructs a small-scale quarterly model for the Turkish economy, in which the explicit treatment of the expectations in the inflationary process and the effects of public borrowing on inflation via interest rates were used. He finds that the expectations had the greatest importance in determining the inflation along with the exchange rate in Turkey. In addition to the use of overnight interest rates as an effective policy tool, it seems to be essential to accomplish the structural reforms so as to eliminate risk premium due to the concerns about the debt sustainability.
The studies carried out by Korum (1969), Uğurel (1971) and Özmucur (1980) are defined as the first generation models by Uygur and Bulutay (2004). The studies of Korum (1969) and Uğurel (1971) emphasize the role of econometric models in the process of economic planning, which was started in year 1961 in Turkey. In this parallel, they primarily concern with the structural analysis of the economy, even though they involve one period ahead forecasts and Özmucur (1980) utilizes policy simulations (multiplier analysis) as well. The behavioral equations are entirely linear in variables and parameters, and are estimated through the annual data. They are analyzed in order to obtain the estimations of reduced form of parameters from structural parameter estimations and the solution values (Uygur and Bulutay (2004)).
On the other hand, the studies of Yörükoğlu et al. (1984), and Şenesen (2008) are described as the second generation models by Uygur and Bulutay (2004). These models concern with forecasting the immediate future and, except the last one, they also include policy simulations (Uygur and Bulutay (2004)). In all of the models, the behavioral equations involve non-linearity in variables estimated by annual data like their predecessors. Iterative dynamic solution methods are used in order to solve the equations. Korum (1969)’s model has two versions. In the first version, Korum (1969) uses current prices in order to determine the variables, while real prices are used in the second version. The estimation method used is Ordinary Least Squares (OLS). Problems in estimation, including simultaneity, are mentioned, but no measures are taken against them. Korum also admits that the import equations are not successful, and this can be partly attributed to the import controls, which could not be taken into account. Specification and estimation problems also exist in domestic demand equations, especially in those explaining the agricultural and non-agricultural stock changes. An interesting feature of Korum’s model is that non-agricultural wage and
profit (non-agricultural non-wage) incomes are explained, which can be used in order to analyze the functional distribution of income (Uygur and Bulutay (2004)).
Uğurel (1971)’s model is smaller than the Korum (1969)’s model. Most of the behavioral equations are constructed in order to explain import and domestic demand variables. Although the investment expenditure is used as an explanatory variable in the equation for imports of investment goods, the parameter of the variable is found to be statistically non-significant. Furthermore, this result is utilized in order to indicate the characteristics of the Turkish economy. Uğurel (1971) takes simultaneity into account in estimation, and then applies Two Stage Least Squares (2SLS) to the data set of period between years 1949 and 1967. On the other hand, the half of Uğurel (1971)’s estimated equations suffer from severe negative autocorrelation, a problem that is not treated or even considered (Uygur and Bulutay (2004)).
Özmucur (1980) developed an extensive version of Korum (1969)’s model in terms of specification, estimation and other procedures employed. In addition to the wage and profit incomes, also the employment and unemployment are determined in this model. In his study, all of the sectoral exports, i.e. agricultural, mining and industrial exports, are deflated by using the same deflator data, which could of course lead to systematic and huge measurement errors. Measurement errors of this nature are also likely to be present in the real values of import variables (Uygur and Bulutay (2004)). Özmucur (1980) also uses the OLS method in order to estimate the behavioral equations. His data set covers either 1950-74 or 1962-74 periods. One can notice that the positive autocorrelation exists in his data set, however this problem is not considered. On the other hand, 2SLS estimation method is used in order to eliminate the simultaneity problem in estimation.
Uygur (1986) develops another econometric model for Turkey by using single equation method with OLS and GLS. The model has output, price, foreign trade, domestic demand, monetary and fiscal variables. It has also some policy simulations in order to investigate the effects of assumed alternative government policies on the endogenous variables. The simultaneous blocks in the model are estimated by Non-Linear Three Stage Least Squares (NL3SLS) and the recursive blocks by Seemingly Unrelated Regression (SUR) methods. The OLS and GLS estimations are compared with the estimations obtained from NL3SLS and SUR. The data used in estimations belong to the period between years 1961 and 1984 (Uygur and Bulutay (2004)).
Although there are limited number of studies about structural macroeconometric model for Turkey, one can find many well-organized partial economic models, which should be taken into account in constructing comprehensive country models. For instance; Öğünç and Ece (2004) attempt to estimate the potential output of Turkish economy by using basic univariate and bivariate unobserved components models from 1987:q1 to 2002:q4. They also designed confidence bands for potential output and output gap. These bands show that 1993 and 1997-1998 were the expansion periods but 1989, 1994 and 2001-2002 were the recession periods of the economy. Moreover, they claimed that the relationship between inflation and output gap is limited, because the inflation is closely tied to exchange rate and past inflation at the period of study (Özatay (2007)). Özatay (2000) developed, estimated and simulated a quarterly macro-econometric model for Turkey. The model analyzes the substantial inertia in the inflation rate and the high public sector borrowing requirement.
Another work on estimating the potential output of Turkey is carried out by Özatay (2007). In this paper, Vector Error Correction Model and univariate Kalman Filter techniques are used. The estimation findings are in harmony with the existing literature. Moreover, it is verified that Turkish economy has entered a new era of economic stability after many years of fluctuating output (Özatay (2007)).
Sarıkaya et al. (2005) employs the extended Kalman Filter from a multivariate perspective, and the output gap is defined as a function of real interest rate, real effective exchange rate, demand index and its own history. All of the parameters in this study are time-varying. Kaya and Yavan (2007) also use recent statistical and economical approaches in order to measure the gap for Turkish economy and compared all the results. They analyze the correlation between capacity utilization, which exhibits the cyclical movements of the economy (Özatay, (2007)).
Gupta and Togan (1984) construct a specific multi-sectoral general equilibrium model as another example of model built for Turkey. They illustrate the effects of liberal and interventionist policies of government on the GDP and the income of different classes in the economy.
Özdemir and Turner (2005) develop a monetary disequilibrium model for the Turkish economy, and run several simulation experiments through their model. The aim of those simulations is to reveal the relation between fiscal policy and money supply. The