ISTANBUL BILGI UNIVERSITY INSTITUTE OF SOCIAL SCIENCES
FINANCIAL ECONOMICS MASTER PROGRAM
Determinants of Profitability Among Hospitality Firms: Evidence From U.S.
DORUK ARIKAN 11462001
Assoc. Prof. Dr. ENDER DEMİR
ISTANBUL 2017
III TABLE OF CONTENTS ABBREVITIONS ... IV TABLES ... V FIGURES ... VI ABSTRACT ... VII INTRODUCTION ... 1 2. LITERATURE REVIEW ... 21 2.1. FIRM SIZE ... 21 2.2. FIRM AGE ... 24 2.3 GDP ... 25 2.4 LIQUIDITY ... 28 2.5. LEVERAGE ... 30
3. DATA AND METHODOLOGY ... 32
3.1. DATA ... 32 3.2. METHODOLOGY ... 34 4. FINDINGS ... 35 CONCLUSION ... 42 REFERENCES ... 44 APPENDIX ... 50
IV
ABBREVITIONS
C: Casino (Except Casino Hotels) CH: Casino Hotels
FR: Full-Service Restaurants GDP: Gross Domestic Product IMF: International Monetary Fund ISE: Istanbul Stock Exchange
KIBS: Knowledge – Intensive Business Service LEV: Leverage
LIQ: Liquidity
LR: Limited-Service Restaurants NCH: Non-Casino Hotels
ROA: Return on Assets ROE: Return on Equity UK: United Kingdom
UNWTO: The World Tourism Organization US: United States of America
V
TABLES
Table 1: International Tourist Arrivals and International Tourism Receipts
Over the Period of 1990 to 2015………5
Table 2: International Tourist Arrivals by UNWTO Regions over the period of 1990 to 2015……….…8
Table 3: International Tourism Receipts by UNWTO Regions over the period of 1990 to 2015………...10
Table 4: Inbound Tourism by Purpose of Visit……….…..11
Table 5: Inbound Tourism by Mode of Transport………..12
Table 6: International Tourist Arrivals Forecast by Region of Destination for 2030………...14
Table 7: Key Indicators of US Tourism………..17
Table 8: Top 10 Ranking by International Tourist Arrivals………18
VI
FIGURES
VII
ABSTRACT
Hospitality Industry is one of the main industries to boost economic conditions of countries. Travel and Tourism are 2.7% of total GDP of US. This study investigates determinants of hospitality firms in US for the period of 1990 to 2015 in four sectors: Limited-service Restaurants, Full-service Restaurants, Non-casino Hotels, Casinos (except Casino Hotels) and Casino Hotels. The paper applies random effects model, fixed effects model, and pooled ordinary least square regressions. This study uses three dependent variables namely: Return on assets, Return on Equity and Profit Margin.
We find that, firm size and leverage has a negative impact on profitability while firm age, liquidity and GDP have a positive impact on profitability using the fixed effect.
We examine all Restaurants as one group, all Hotels as another group to try to have more specific results. The results show that all Restaurants have similar results to Hospitality Industry. On the other hand, all Hotels are statistically and significantly similar only to GDP and firm age in the Hospitality Industry.
VIII
ÖZET
Konaklama, restaurantlar ve kumarhane sektörleri ülkelerin ekonomisi üzerinde önemli etkilere sahiptir. Seyahat ve turizm, ABD’nin GSYİH’nın %2.7’sini oluşturmaktadır. Bu çalışma ABD’de faaliyet gösteren, konaklama, restaurant ve kumarhane sektöründe yer alan firmaların 1990 – 2010 yılları arasındaki karlılıklarını belirleyen faktörleri incelemektedir. Bu çalışmada yer alan sektörler: Yiyecek ve alkolsüz içecek servis eden restaurantlar, Yiyecek ve alkollü – alkolsüz içecek servis eden restaurantlar, Kumarhanesi olmayan oteller, kumarhaneler ve kumarhanesi bulunan oteller. Çalışma karlılığı ölçmek için üç değişken kullanmaktadır: Aktif karlılığı, Özkaynak karlılığı, Kar Marjı.
Sabit etkiler yöntemine göre firma büyüklüğü ve kaldıraç kârlılığı olumsuz etkilerken, firma yaşı, likidite ve GSYİH kârlılık üzerinde olumlu bir etkiye sahiptir.
Tüm restaurantları bir grup olarak, tüm otelleri başka bir grup olarak inceleyerek daha spesifik sonuçlar elde etmeye çalışıyoruz. Sonuçlar, tüm restoranların, konaklama, yiyecek – içeçek, kumarhane endüstrisi ile benzer sonuçlar verdiğini göstermektedir. Oteller sadece GSYİH ve firma yaşı için konaklama, yiyecek – içeçek ve kumarhane endüstirsi ile istatistiksel olarak ve önemli ölçüde aynıdır.
1
INTRODUCTION
Considering the growth rate and the impact on economic conditions of countries, Tourism is one of the largest and the main industries in the World. The number of tourist arrivals and the number of income that tourism industry has is increasing every year.
In the primitive ages of human history, traces of human movements from one region to another are encountered. This change is a displacement caused by the need for nutrition. People have moved to where they can get their nutritional needs. These movements created the economy of change. Phoenician merchants have laid the foundations of tourism by transporting the exchange economy to overseas lands and societies. (Eralp, 1983)
If the public scheme is an activity that provides safety of life and property in the place of residence, in the place of travel, and in the place of departure, then an environment conducive to tourism-specific behaviors is established. It is important that the result of reaching an effective level of the social organization which arises from the common and general qualifications of the need for a cluster in this area of the Ancient Greek and Roman period is also the scene of similar tourism movements in our modern times.
During the Ancient Greek and Roman Civilization periods, land and sea road transportation networks were shaped to suit the journey. Thus, a connection is established between communities that are far apart from each other in terms of geographical location, in accordance with the function of the exchange economy, and the trips based on the reasons for intercommunity travel have taken place in the society regularly and uninterruptedly.
The dominant factor that leads to the inter-communal human movement is the socio-economic and cultural reach level. Fairgrounds and markets cause the local people to change places. Theater and sport competitions, etc., are the dynamic of tourism-oriented movement as a factor of socio-cultural nature. It is known that
2
many people from other cities came to Olympia to watch the games in Peloponnesia. (Eralp, 1983) In addition to this, it shows the dimensions of the tourist movement that takes place from the socio - economic and cultural level of the 12 city - states in Western Anatolia and the 6 cities in the south - Mediterranean.
The Roman Empire was located in a vast geographical area. Romans were responsible for the safety of the places under the Roman Empire. It is in the priority of ensuring that the territories under its sovereignty, especially the access to Rome, were secure. The assurance they provide has ensured that the security of the military field is ensured, as well as the revival of tourism. Thus, the provision of the transport system and its security, the temples and interesting regions within the broad boundaries of the empire have created an opportunity for more Romans to visit each year. As a result, more and more people have traveled to distant places for various reasons.
With the Middle Ages, religious movements became important. The Crusades from Northern Europe to the Middle East should be viewed as an intermittent movement because of the involvement of thousands of people. This long journey should be viewed as a process that leads to societal interactions as it affects the communities on the going and return route. Another effect of the Crusades in the tourism sector is that it initiates and promotes religious destinations in intercontinental qualities. Another development that stands out in the Middle Ages is the intercontinental trade. This trade on the Silk Road connects Western Europe to India and China through the Middle East-Turkey-Iran. This path also affected societal and economically the communities with the side links in the countries it covers. During the Roman Empire, travels that did not go beyond the borders of the empire gained intercontinental dimensions in the Middle Ages.
There are a limited number of transportation vehicles during these periods. For road transport, mule or horse drawn vehicles were used. The duration of the journey and the speed of the journey were entirely dependent on the animal's muscle power. It was a journey of a few years to and from the Silk Road. Sea transport was
3
based on people's muscle and wind power. For these reasons, a limited number of people could participate in the trips.
Marco Polo's famous journey reveals the desire of man to travel and discover new places, despite primitive vehicles. In 1492 Cristophe Colomb surpassed the Atlantic Ocean and discovered a new continent that was untouched for humanity. In 1497, five years after Colomb, the Portuguese Vasco de Gama found a new voyage to China through an alternative route to the Silk Road, crossing the world from north to south and then east. Another Portuguese Ferdinand Magellan opens a ferry to the Atlantic Ocean and crosses the American continent to the Pacific Ocean. This event taught people the other half of the world that is unknown. With this journey, people have gone to the other side of the American continent and have discovered another way to travel to Asia. (Eralp, 1983) These discoveries have revealed the desire of mankind to discover with limited opportunities and have increased the desire for future generations to go faster and easier to those places that have been discovered.
Human beings are in constant demand for change and development, as we have seen in these historical occasions. The development of tourism has also developed in parallel with this desire for change and development of human beings. The spinning machine for the industrial revolution is regarded as the beginning. After that time mankind has entered a state of continuous mechanization. The tourism impact of these developments was also in the 19th century. Railway transport between the cities of Stokthon and Darlington for the first time in England is the first step to transition from primitive transport to modern transport (Eralp, 1983). This is the beginning of a history when the industrial revolution will now develop in tourism. With the invention of steam engines, both railway transportation and marine transportation have developed in parallel. In the tourism industry, a more modern structure is now used instead of horses, mules, primitive cars, where machine power is used. With this development, larger masses have become able to travel from one place to another.
4
With the diversification of vehicles and mechanization, tourism has also been able to reach more rural areas than cities. With vehicles having more human capacity, more people have been able to travel. With the increase of human transport capacities of vehicles, more people have reached the possibility of traveling and due to the speed of the vehicles, the time spent on the road for passengers is reduced. This situation has increased the expense of tourists by extending the duration of the stay. The longer stay and increased spending of tourists contributed to the economic growth of tourism and tourism-related sectors and the economic progress of the countries.
Thomas Cook is a vanguard of the modern tourism and under care of him, people trip to a spa, seaside resort or an exotic journey on 19th centuries (Eralp, 1983). Along with Thomas Cook, marketing to the tourism industry has also been included. Initially, marketing activities were carried out for intercity trips. Afterwards, these marketing activities gained an international dimension. With the increase in marketing activities in the tourism industry and the influence of the industrial revolution, the tourism industry is now an industry that interests the masses and contributes to the economies of the people and countries.
Following that, during the World War I – II and after WWI – II, there were improvements on the aviation industry, which gives tourism industry a boost. These improvements have boosted the tourism industry. As a result, people can travel between intercontinental travels are easier. Aviation industry is not the only industry which development occurs but there is also a improvement on automobile industry. People can reach automobiles cheaper and easier, eventually, this improvement gives huge opportunities to government and companies to construct motorways. In other words, tourism can be affected tremendously by the improvements of the aviation industry and the automobile industry. During these improvements, people get more social rights which are reducing of working hours, paid vacation, increasing of wage, following of these term, people has more time, money and opportunities to travel around the World. Today, with the widespread use of the Internet, it has made it easier for people to determine where they want to
5
go easier and more freely. They have had the opportunity to get easier and clearer information on the internet about the place they want to go to. And they now have the freedom to plan their own travel without an intermediary institution. These are the key factors which impact on the progress of modern tourism.
Tourism is one of the key industries over the decade for which affects the economic the economic structure of countries and it is a rapidly growing and developing industry. We can reach quantities how rapidly tourism growing when we look at the international tourist arrivals, tourism receipts.
International tourist arrivals increased by 4.6% in 2015 and it reached a total of 1,186 million people. At the same time, international tourism receipts reached at US$ 1,260 billion worldwide in 2015, it was US$ 1,309 billion in 2014, decreased by 3.7%. On the other hand, international tourism receipts hit at € 1,000 billion worldwide for the first time in 2015. It reached € 1,136 billion. There is no decrease in euro term like US dollar term in 2015. Tourism industry has a big impact on the economy of the World. If we support this with the numbers to be more precise, tourism industry is a 10% of GDP of the World (UNWTO, 2016).
Table 1: International Tourist Arrivals and International Tourism Receipts over the
Period of 1990 to 2015 1990 1995 2000 2005 2007 2008 2009 2010 2011 2012 2013 2014 2015 International Tourist Arrivals Million 435 527 674 809 911 928 892 950 994 1,040 1,088 1,134 1,186 Index 2008 = 100 100 96 102 107 112 117 122 128 International Tourism Receipts Local Currencies Index 2008 = 100 (constant price) 100 95 101 106 110 116 122 128 US$ Billion 271 415 495 706 896 987 905 986 1,104 1,146 1,241 1,309 1,260 Euro Billion 213 317 536 568 654 671 649 744 793 892 934 986 1,136
6
International tourist arrivals are increasing year by year. As following on Table 1 435 million tourist arrivals on 1990, only in 5 years, it increased to 527 million. In other words, it has increased by 21.1% in 5 years. In 2012, international tourist arrivals hit 1,040 million for the first time and it reached 1,186 million in 2015. At the same time, international tourism receipt is also increasing year by year. International tourism receipt is increased by 53.1% from 1990 to 1995 as US$. It hits 1,000 billion US$ in 2011 for the first time. There is only a year for decreasing number of both international tourist arrivals and international tourism receipts. The year is from 2008 to 2009 and that time is in the middle of economic crisis in the World so that’s the reason why there is a decrease at the time. Indexes which are international tourist arrivals and international tourism receipts also show that there are always rise over the period of 2008 to 2014, there is only a decrease in 2009 over the period because of the economic crisis in the World. International tourist arrivals decrease from 928 million to 819 million while international tourism receipts decrease from 970 billion US$ to 885 billion US$. While the number of international tourist arrivals increased in 2015, international tourist receipts decrease in dollar terms, but there is still an increase in euro terms.
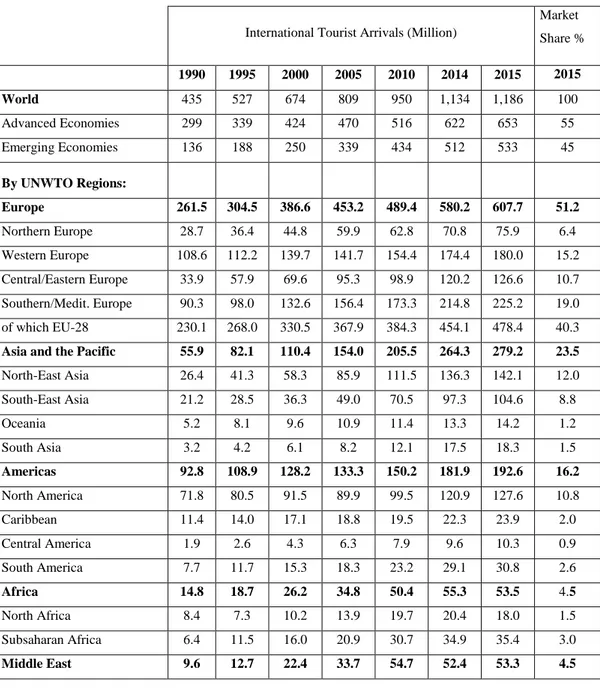
International tourist arrivals hit 1,186 million in 2015. International tourist arrivals increased by 4.6% in accordance to previous year in the world. In advanced economies, international tourist arrivals are 653 million, an increasing of 31 million over the previous year while in emerging economies, they are 533 million, an increasing of 21 million over the previous year. Advanced countries have a market share of 55% while emerging countries have a market share of 45% on international tourist arrivals.
By UNWTO Region, Americas is the most growing region in 2015 on international tourist arrivals, regarded 6% over the previous year as Asia and the Pacific are the second growing region with 5.7%. In America Region, Caribbean and Central America are the most growing sub-regions with 7.4% and 7.1% respectively on the other hand in Asia and the Pacific Region, South-East Asia and Oceania are the most growing sub-regions in 2015, regarded 7.6% and 7.45
7
respectively. Europe is the third growing region with 4.6%. Middle East is the least growing region with 1.7% in 2015 on international tourist arrivals, only an increase of 0.9 million over the previous year. International tourist arrivals have increased in each region and globe compared to the previous year, but only in the Africa region there has been a 3.3% decrease in 2015 compared to the previous year. This rate corresponds to the number of arrivals of 1.8 million international tourists. The European region is the largest market share with 51.2%. The second region is Asia and the Pacific at 23.5%. The share of the Americas region is 16.2%. The largest share in Americas’ region belongs to the North American sub-region with 10.8%. Africa and the Middle East have the least shares at 4.5% on international tourist arrivals.
8
Table 2: International Tourist Arrivals by UNWTO Regions over the period of
1990 to 2015
International Tourist Arrivals (Million)
Market Share % 1990 1995 2000 2005 2010 2014 2015 2015 World 435 527 674 809 950 1,134 1,186 100 Advanced Economies 299 339 424 470 516 622 653 55 Emerging Economies 136 188 250 339 434 512 533 45 By UNWTO Regions: Europe 261.5 304.5 386.6 453.2 489.4 580.2 607.7 51.2 Northern Europe 28.7 36.4 44.8 59.9 62.8 70.8 75.9 6.4 Western Europe 108.6 112.2 139.7 141.7 154.4 174.4 180.0 15.2 Central/Eastern Europe 33.9 57.9 69.6 95.3 98.9 120.2 126.6 10.7 Southern/Medit. Europe 90.3 98.0 132.6 156.4 173.3 214.8 225.2 19.0 of which EU-28 230.1 268.0 330.5 367.9 384.3 454.1 478.4 40.3
Asia and the Pacific 55.9 82.1 110.4 154.0 205.5 264.3 279.2 23.5
North-East Asia 26.4 41.3 58.3 85.9 111.5 136.3 142.1 12.0 South-East Asia 21.2 28.5 36.3 49.0 70.5 97.3 104.6 8.8 Oceania 5.2 8.1 9.6 10.9 11.4 13.3 14.2 1.2 South Asia 3.2 4.2 6.1 8.2 12.1 17.5 18.3 1.5 Americas 92.8 108.9 128.2 133.3 150.2 181.9 192.6 16.2 North America 71.8 80.5 91.5 89.9 99.5 120.9 127.6 10.8 Caribbean 11.4 14.0 17.1 18.8 19.5 22.3 23.9 2.0 Central America 1.9 2.6 4.3 6.3 7.9 9.6 10.3 0.9 South America 7.7 11.7 15.3 18.3 23.2 29.1 30.8 2.6 Africa 14.8 18.7 26.2 34.8 50.4 55.3 53.5 4.5 North Africa 8.4 7.3 10.2 13.9 19.7 20.4 18.0 1.5 Subsaharan Africa 6.4 11.5 16.0 20.9 30.7 34.9 35.4 3.0 Middle East 9.6 12.7 22.4 33.7 54.7 52.4 53.3 4.5
Source: World Tourism Organization (UNWTO), 2016
International tourism receipts hit 1,260 billion in 2015. International tourism receipts increased by 4.4% over the previous year in the world. In advanced economies, international tourism receipts are US$ 774 billion while in emerging
9
economies, they have US$ 486 billion, an increasing of 6.7% over the previous year. Advanced countries have a market share of 61.5% while emerging countries have a market share of 38.5% on international tourism receipts.
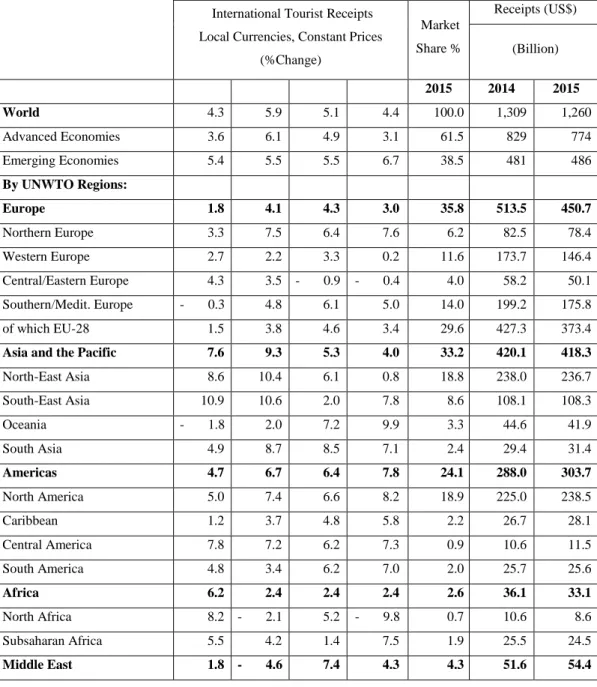
By UNWTO Region, Americas is the most growing region in 2015 on international tourism receipts, regarded 7.8% over the previous year as Middle East are the second growing region with 4.3%. In America Region, North America is the most growing sub-region with 8.2%. Similar to Middle East, the growth rate of Asia and the Pacific region is 4.0%. In Asia and the Pacific Region, Oceania is the most growing sub-region with 9.9%. The growth rate of Europe region is 3.0%. Africa is the least growing region with 2.4% in 2015 on international tourism receipts. The European region is the largest market share with 35.8%. The second region is Asia and the Pacific at 33.2%. The share of the Americas region is 24.1%. Africa and the Middle East have the least shares at 2.6% and 4.3% respectively on international tourism receipts.
10
Table 3: International Tourism Receipts by UNWTO Regions over the period of
1990 to 2015
International Tourist Receipts Local Currencies, Constant Prices
(%Change) Market Share % Receipts (US$) (Billion) 2015 2014 2015 World 4.3 5.9 5.1 4.4 100.0 1,309 1,260 Advanced Economies 3.6 6.1 4.9 3.1 61.5 829 774 Emerging Economies 5.4 5.5 5.5 6.7 38.5 481 486 By UNWTO Regions: Europe 1.8 4.1 4.3 3.0 35.8 513.5 450.7 Northern Europe 3.3 7.5 6.4 7.6 6.2 82.5 78.4 Western Europe 2.7 2.2 3.3 0.2 11.6 173.7 146.4 Central/Eastern Europe 4.3 3.5 - 0.9 - 0.4 4.0 58.2 50.1 Southern/Medit. Europe - 0.3 4.8 6.1 5.0 14.0 199.2 175.8 of which EU-28 1.5 3.8 4.6 3.4 29.6 427.3 373.4
Asia and the Pacific 7.6 9.3 5.3 4.0 33.2 420.1 418.3
North-East Asia 8.6 10.4 6.1 0.8 18.8 238.0 236.7 South-East Asia 10.9 10.6 2.0 7.8 8.6 108.1 108.3 Oceania - 1.8 2.0 7.2 9.9 3.3 44.6 41.9 South Asia 4.9 8.7 8.5 7.1 2.4 29.4 31.4 Americas 4.7 6.7 6.4 7.8 24.1 288.0 303.7 North America 5.0 7.4 6.6 8.2 18.9 225.0 238.5 Caribbean 1.2 3.7 4.8 5.8 2.2 26.7 28.1 Central America 7.8 7.2 6.2 7.3 0.9 10.6 11.5 South America 4.8 3.4 6.2 7.0 2.0 25.7 25.6 Africa 6.2 2.4 2.4 2.4 2.6 36.1 33.1 North Africa 8.2 - 2.1 5.2 - 9.8 0.7 10.6 8.6 Subsaharan Africa 5.5 4.2 1.4 7.5 1.9 25.5 24.5 Middle East 1.8 - 4.6 7.4 4.3 4.3 51.6 54.4
Source: World Tourism Organization (UNWTO), 2016
The purpose of tourism depends on tourists and their decisions are being affected by many things. Some of them want to have a good time and they decide
11
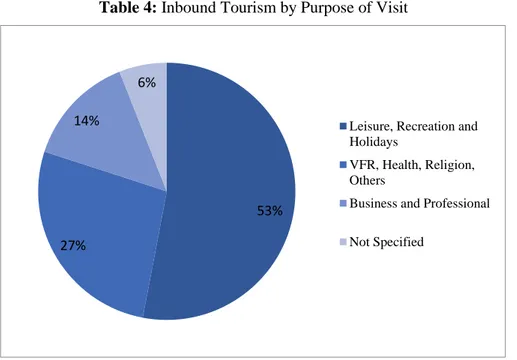
to go lazy vacations, some of them participates a business trip, some of them want to see their cultural, spiritual places and join a trip to go there. When we check on Table 2, we can see that the purpose of 53% of tourists is leisure, recreation and holidays. The purpose of 27% of them are health, religion, visiting friends and relatives while only 14% of business and professional. Most of the tourist’ decisions are specified with leisure recreation and holidays.
Table 4: Inbound Tourism by Purpose of Visit
Source: World Tourism Organization (UNWTO), 2016
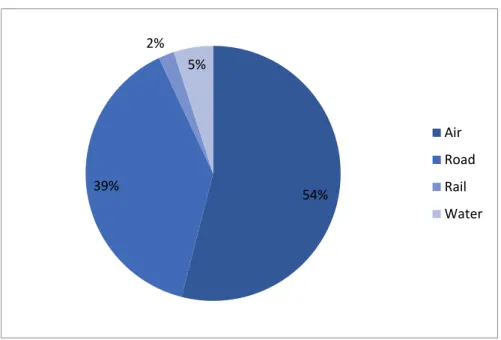
It is well known that the development of tourism in the transportation industry is more influential. With the impact of globalization, improvements in transportation more people reach to travel and tourists can move faster with more affordable prices. In 2015, tourists travel to their destination by air with 54% while the tourist travelled by road regarded 39%, %2 of the travelers chose rail transport and %5 of them prefer maritime transport.
53% 27%
14%
6%
Leisure, Recreation and Holidays
VFR, Health, Religion, Others
Business and Professional Not Specified
12
Table 5: Inbound Tourism by Mode of Transport
Source: World Tourism Organization (UNWTO), 2016
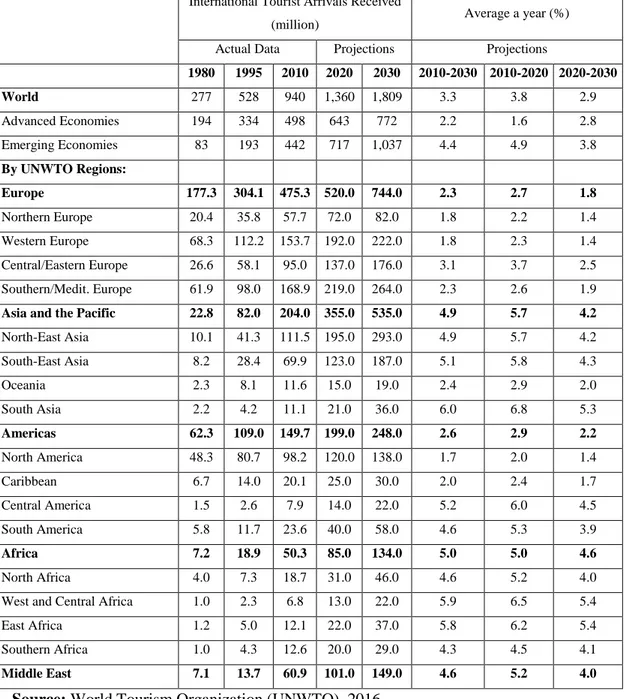
The number of international tourist arrivals is expected to increase by an average of 3.3% a year over the period of 2010 to 2030. The number of international tourist arrivals is increase 3.8% on the first part of period and the growth rate will slow on the second part of period, it will increase with 2.9% over the period 2020 to 2030. International tourist arrivals are expected to reach 1.4 billion by 2020 and 1.8 billion by the year 2030.
In advanced economies, international tourist arrivals will increase with 2.2% while in emerging economies, it will increase by 4.4% over the period of 2010 to 2030. Market share of advanced economies will drop from 53 to 43 while market share of emerging economies will rise from 47 to 57 over the period 2010 to 2030. Over the period of 2010 to 2030, the strongest growth is expected from Africa, Asia and the Pacific and Middle East regions with 5.0%, 4.9% and 4.6% respectively. The number of international tourist arrivals for the Africa region is expected to increase by an average of 4.2 million per a year while the number of
54% 39% 2% 5% Air Road Rail Water
13
tourist arrivals for Asia and the Pacific region will increase by 26 million per a year and Middle East’s number is expected to increase from 60.9 million to 149 million over the period of 2010 to 2030. Americas and Europe regions will increase by 2.6% and 2.3% respectively.
Through the rapid growth of Africa, Asia and the Pacific and Middle East regions, the market share of Africa region will rise from 5.3% to 7.4% as the market share of Asia and the Pacific region will hit approximately 30%, it was 21.7% in 2010. The market share of Middle East region will also increase from 6.5% to 8.2% over the period of 2010 to 2030. On the other hand, the market share of Europe and Americas regions are expected to decrease over the period 2010 to 2030. The market share of America region will decrease from 15.9% to 13.7% while the market share of Europe region will reduce from 50.6% to 41.1%.
14
Table 6: International Tourist Arrivals Foreceast by Region of Destionation for
2030
Source: World Tourism Organization (UNWTO), 2016
Tourism is about activities and services. It includes many sectors. For example, computers to record costumer statistics and accommodation information,
International Tourist Arrivals Received
(million) Average a year (%)
Actual Data Projections Projections
1980 1995 2010 2020 2030 2010-2030 2010-2020 2020-2030 World 277 528 940 1,360 1,809 3.3 3.8 2.9 Advanced Economies 194 334 498 643 772 2.2 1.6 2.8 Emerging Economies 83 193 442 717 1,037 4.4 4.9 3.8 By UNWTO Regions: Europe 177.3 304.1 475.3 520.0 744.0 2.3 2.7 1.8 Northern Europe 20.4 35.8 57.7 72.0 82.0 1.8 2.2 1.4 Western Europe 68.3 112.2 153.7 192.0 222.0 1.8 2.3 1.4 Central/Eastern Europe 26.6 58.1 95.0 137.0 176.0 3.1 3.7 2.5 Southern/Medit. Europe 61.9 98.0 168.9 219.0 264.0 2.3 2.6 1.9
Asia and the Pacific 22.8 82.0 204.0 355.0 535.0 4.9 5.7 4.2
North-East Asia 10.1 41.3 111.5 195.0 293.0 4.9 5.7 4.2 South-East Asia 8.2 28.4 69.9 123.0 187.0 5.1 5.8 4.3 Oceania 2.3 8.1 11.6 15.0 19.0 2.4 2.9 2.0 South Asia 2.2 4.2 11.1 21.0 36.0 6.0 6.8 5.3 Americas 62.3 109.0 149.7 199.0 248.0 2.6 2.9 2.2 North America 48.3 80.7 98.2 120.0 138.0 1.7 2.0 1.4 Caribbean 6.7 14.0 20.1 25.0 30.0 2.0 2.4 1.7 Central America 1.5 2.6 7.9 14.0 22.0 5.2 6.0 4.5 South America 5.8 11.7 23.6 40.0 58.0 4.6 5.3 3.9 Africa 7.2 18.9 50.3 85.0 134.0 5.0 5.0 4.6 North Africa 4.0 7.3 18.7 31.0 46.0 4.6 5.2 4.0
West and Central Africa 1.0 2.3 6.8 13.0 22.0 5.9 6.5 5.4
East Africa 1.2 5.0 12.1 22.0 37.0 5.8 6.2 5.4
Southern Africa 1.0 4.3 12.6 20.0 29.0 4.3 4.5 4.1
15
airplanes and cars to transport tourists, glass, fork, table, foods and beverages are needed by tourists at restaurants, hotels, casinos. As a consequence, we can see that there are so many sectors linked with tourism. Tourism emerged with many subindustries such as ticketing, accommodation, catering, entertainment, food and beverage, shops and many others. On the other hand, hospitality is shaped with accommodation, food and beverage, entertainment for guests (Reisinger, 2009). Hospitality is a sub-set of tourism. Hospitality only interests the joy of costumers, it provides them comfort, joy, fun, entertainment, food and services. There are numbers of factors that affect the changes in the opinions of the costumers which are costumer’s wealth, expectations and needs. For the future we do not know, people want to protect and increase their money in a safe way for their expectations and needs. If the economic indicators go well, we can assume that people will make spending easier, otherwise they will not spend. The hospitality industry is one of the sectors which people can easily give up if economic indicators deteriorate (Singal, 2011).
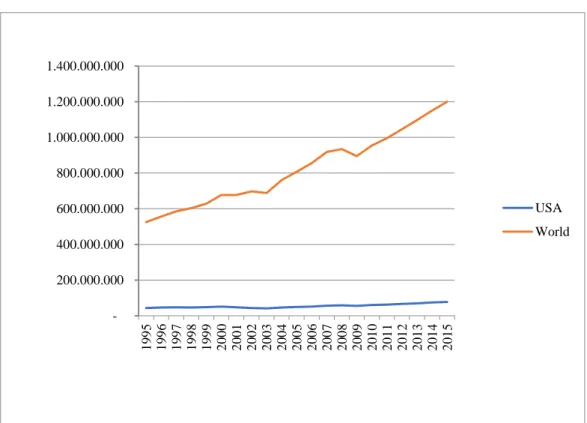
U.S. is one of the main tourist destinations in the World. Their modern, cultural and technological aspects are always so attractive for tourists. People know their cultures by Hollywood movie sector and it gives a boost to American tourism industry and others. American sports team also has a big impact on tourists’ decision to visit their country. In other word, popular culture and its figures help tourists to make decision to visit U.S. Figure 1 presents that in 2015, tourist arrivals numbers are equal to 77,510,282 and it is almost 6.5% of the international tourist arrivals of the World, the total number is 1,200 million in 2015.
16
Figure 1: International Tourist Arrivals and Tourist Arrivals in U.S.
Source: The World Bank (2017)
In U.S., tourist arrivals are 77,510,282 and these arrivals provides contributions to U.S. economy. According to Table 3, per arrival contribute US$ 2,368 for U.S. and the total contribution is equal to US$ 204,523 million for U.S. economy. When we consider travel and tourism as a group, their scale is equal to US$ 487,967 million. T&T industry is 2.7% of total GDP of U.S. T&T also creates new employment opportunities leading to decrease in unemployment. Their size is 3.8% of total employment of U.S.
200.000.000 400.000.000 600.000.000 800.000.000 1.000.000.000 1.200.000.000 1.400.000.000 1 9 9 5 1 9 9 6 1 9 9 7 1 9 9 8 1 9 9 9 2 0 0 0 2 0 0 1 2 0 0 2 2 0 0 3 2 0 0 4 2 0 0 5 2 0 0 6 2 0 0 7 2 0 0 8 2 0 0 9 2 0 1 0 2 0 1 1 2 0 1 2 2 0 1 3 2 0 1 4 2 0 1 5 USA World
17
Table 7: Key Indicators of US Tourism
International Tourist
Arrivals 77,510,282 T & T Industry GDP US $ 487,967.0 million International Tourism Inbound Receipts US$ 204,523.0 million T & T Industry GDP % of Total 2.7%
Average Receipts Per
Arrival US$ 2,368.7 T & T Industry Employment 5,633,170 Jobs T & T Industry Employment % of Total 3.8%
Source: World Economic Forum (2017)
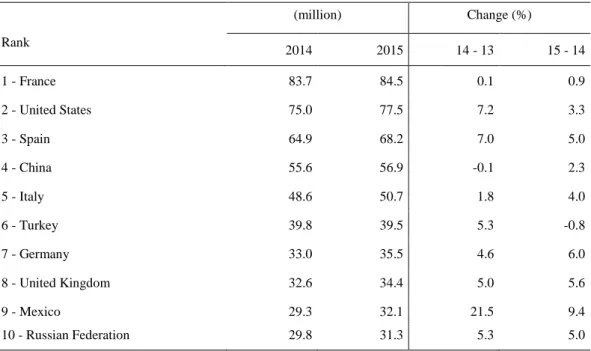
Tourism gives a boost to US economy and it creates job opportunities for people. U.S. is the second country that is chosen by tourists. When we look at the Table 4, we can see that number of tourist arrivals is 75 million in 2014, it increases by 3.3% and it reaches to 77.5 million in 2015. For 2015, it is larger than the Spain’s arrivals which are the third country in terms of tourist arrivals by 13%.
18
Table 8: Top 10 Ranking by International Tourist Arrivals
Rank (million) Change (%) 2014 2015 14 - 13 15 - 14 1 - France 83.7 84.5 0.1 0.9 2 - United States 75.0 77.5 7.2 3.3 3 - Spain 64.9 68.2 7.0 5.0 4 - China 55.6 56.9 -0.1 2.3 5 - Italy 48.6 50.7 1.8 4.0 6 - Turkey 39.8 39.5 5.3 -0.8 7 - Germany 33.0 35.5 4.6 6.0 8 - United Kingdom 32.6 34.4 5.0 5.6 9 - Mexico 29.3 32.1 21.5 9.4 10 - Russian Federation 29.8 31.3 5.3 5.0
Source: World Tourism Organization (UNWTO), 2016
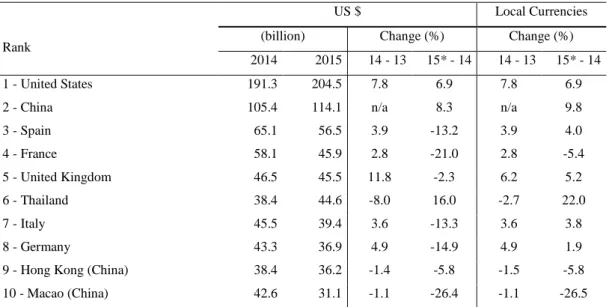
As can be seen from Table 4 that U.S. is the second country in the international tourist arrivals. On the other hand, while U.S. is the second on international tourist arrivals list, U.S. is the first country in terms of international tourism receipts. In 2014, U.S. generates an income of US$ 191.3 billion while the second country, China is able to generate only US$ 105.4 billion which is smaller than U.S. by 81.5%. There is an important difference between the first and the second country. U.S. generates an income US$ 204.5 billion in 2015 and tourism receipts increased by 6.9%. U.S. has the highest income in tourism revenue and these values continue to grow.
19
Table 9: Top 10 Rankings by International Tourism Receipts
Rank
US $ Local Currencies
(billion) Change (%) Change (%)
2014 2015 14 - 13 15* - 14 14 - 13 15* - 14 1 - United States 191.3 204.5 7.8 6.9 7.8 6.9 2 - China 105.4 114.1 n/a 8.3 n/a 9.8 3 - Spain 65.1 56.5 3.9 -13.2 3.9 4.0 4 - France 58.1 45.9 2.8 -21.0 2.8 -5.4 5 - United Kingdom 46.5 45.5 11.8 -2.3 6.2 5.2 6 - Thailand 38.4 44.6 -8.0 16.0 -2.7 22.0 7 - Italy 45.5 39.4 3.6 -13.3 3.6 3.8 8 - Germany 43.3 36.9 4.9 -14.9 4.9 1.9 9 - Hong Kong (China) 38.4 36.2 -1.4 -5.8 -1.5 -5.8 10 - Macao (China) 42.6 31.1 -1.1 -26.4 -1.1 -26.5 Note: China, the United States and the United Kingdom substantially revised their international
tourism receipts series upwards for 2015 and respectively for some previous years, due to changes in methodology
Source: World Tourism Organization, (UNWTO), 2016
Especially with the employment, income and added value created by the hospitality industry, we have observed that the importance of the hospitality industry is increasing. Many hospitality companies in the world and in the United States are operating in this challenging industry. In this intensely competitive environment, companies in the industry must first be financially strong to succeed and they need to maintain and manage strong financial structures in line with their goals. To be strong from a financial point of view, it has to be a profitable business and profitability must also be sustainable. Profit is the main reason of the existence of companies. Profit is the financial gain, the difference between the total amount of money gained and the amount of money spent for expenses such as; taxes, outlays. On the other hand, profitability has a different meaning. Profitability means to operating efficiency of firms.
20
This study’s contribution to the existing literature is to find determinants that affect the profitability of U.S. Hospitality firms and to examine their performance from 1990 to 2015.
This study summarized as follows; Chapter 2 reviews the existing literature for the determinants of profitability. Chapter 3 introduces the data and methodology. Chapter 4 presents and discusses the findings of the study. Finally, Chapter 5 summarizes and concludes the study.
21
2. LITERATURE REVIEW
2.1. FIRM SIZE
The size of a firm can affect decisions of other firms, suppliers and investors. If the firm is larger than others, there can be a trust issue on the business between larger firms and who want to work with them. Their big scale can be sympathetic and trustworthy to work with the larger firms. On the other hand, there can be negative situations for smaller firms when we look at them on the first corner, but smaller firms can make faster decisions, make adapt themselves easily to new trends without bureaucratic situations and these can be a lift for the smaller firms. We can say that there is no consensus in the literature between firm size and firm performance.
The size of a firm is a quantity and range production capacity and total sales of firms. In addition to these, it is the quantity and range services which a firm can provide to their customers. Size is an important determinant of a firm’s performance. Nunes and Serrasqueiro (2015) claim that larger firms can diversify their activities. They point out that size has a big impact on profitability. Their research is based on Knowledge – Intensive Business Service (KIBS) which are:
computer and related activities, research and development, legal, accounting, bookkeeping and auditing activities, management consultancy, related technical consultancy, technical testing and analysis, advertising.
Stierwald (2009) uses data of 961 firms over the period of 1995 to 2005. These firms include energy, financials, health, inform and technology, industrials, materials, staples, telecommunication, utilities sectors. Stierwald (2009) states that larger firms with high levels of total productivity cause supernal firms profitability. A potential statement is that high levels of productivity, for example, in low average costs of production, higher outcome quantities produces with fewer income, causes to higher profits. Also Stierwald (2009) stress that size has a big impact on firm
22
performance. The positive and significant parameter for firm size shows that, comparing to smaller firms, larger firms are much more profitable. This finding can show that larger firms gain scalable economies and benefit from field of economies. An alternative explicating is that smaller firms can access capital at higher costs than larger firms. Using the data of 200 listed companies in Istanbul Stock Exchange (ISE) between years 2008 – 2011, Dogan (2013) finds that there is a positive relation between profitability and firm size. In other words, the firms listed which have more experience in their segment have higher profitability.
Majumdar (1997) uses data for 1020 Indian firms over the period of 1988 to 1994 to understand whether there is a correlation between firm size and profitability. He points out that size is a positive impact on the profitability of firms. Nazir and Afza (2009) investigate 204 non – financial firms for the period 1998 – 2005. Nazir and Afza (2009) also find that firm size has a positive impact on profitability.
Makori and Jagongo (2013) examine the implication of firm size on profitability using the data of 10 manufacturing and construction firms which are listed on the Nairobi Securities Exchange (NSE) is used for the period 2003 to 2012. Makori and Jagongo (2013) find that firm size has a positive impact on profitability. Larger firms produce more profit in comparison to smaller firms.
On the opposite of findings supporting the positive relationship between size and profitability, Dhawan (2001) claims that if small firms are technologically more efficient than larger ones they can be more profitable. Besides they can come up against market uncertainties and can be a survivor. Their simple organizational structure helps them making decisions more easily than larger ones. Dhawan (2001) shows that there is a negative relationship between firm size and profitability for publicly traded U.S. firms over the period of 1970–1989. Likewise, Berger and di Piatti (2003) claims that even though larger firms are usually better diversified and more professionally managed, size has a negative effect on profit efficiency. The
23
data which is used by Berger and di Piatti (2003) includes U.S. commercial banks from 1990 to 1995, only existence banks for all years used on the data.
Ramasamy et al. (2005) argue that firm size has a negative correlation with profitability because larger firms would be a harder to manage and when the future problems show, their organizational effectiveness – bureaucratic management structures - can be a real problem to solve real problems. These organizational complications cause to higher production costs which decreases overall profitability. The data used by Ramasamy et al. (2005) compose 30 palm oil companies from Malaysia over the period 2000 – 2003. 19 of them are privately – owned firms and 11 of them are stated – owned firms. They show that there is a negative connection between firm size and profitability.
Capon et al. (2008) larger firms can easily reach to the source or to the service they need. Because of their size, suppliers and other firms want to cooperate with them. While working with larger firms, cash flow can be more proper opposite to small firms. Moreover, size brings surplus power over suppliers and competitors, large firms can buy the best product with the best price and it gives them a more advantage, also, they can have the superior technological advantage and more professional team because they have control over the market. As Capon et al. (2008) emphasize on firm size so many times, they find that size has no impact on firm performance. On the other hand, Hansen and Wernerfelt (1989) investigate 60 Fortune firms. They conclude that there is a negative connection between profitability and firm size. As firms grow, their profitability ratios decrease.
Sufian and Chong (2008) work on the determinants that affect the profitability of the banking sector in the Philippines. They use the figures of 24 banks operating between 1990 and 2005 during their study. The result they find indicate that there is a negative relationship between profitability and bank size. The negative relation shows that larger (smaller) banks trend to earn lower (higher) profits. At the same time, Ugwuntu et al. (2012) study on to determine the factors affecting profitability in the banking sector between 2001 – 2010 in Nigeria. They
24
examine 15 banks over the period. Ugwuntu et al. (2012) find that size has a negative effect on profitability. This means that bigger banks have lower profit level.
2.2. FIRM AGE
Trust is one of the main issues while doing a business and older firms have an advantage of being trustable. Firms which are doing a business in their sector for a long time, can have more effective relations with other firms, suppliers, financial environments. On the other hand, younger easily adapt to for the new situation, more creative to do newer things and it can give younger firms an impact in the business circle. There are lots of opinions about firm age and the profitability of firm relations. Some of them support that there is a connection – positively or negatively – some of them claim that there is no connection between profitability and firm age. Firm age shows a recognition from other companies on business or industrial relations and corporate maturity to carry out routine business activities. It also shows the strength to survive in the competition. Companies that have more experience than the others can achieve better in competitions. Older firms have more information flow which leads quality improvements, reduced delivery times, familiarity in their scope and fast track upgrading of design or generate products in response to changing demand of market.
According to Autio (2005) older firms can obtain resources easily over time because firm age is linked to experience in their scope. Experienced firms have better access the business networks and financial institutions. In this way, all of the arguments help experienced firms to get resources easily and more efficiently operate their business. In other words, Autio (2005) finds that firm has a strong effect on the business network.
25
Dogan (2013)’s empirical work claims that there is a negative correlation between firm age and profitability. In another saying, older firm’s profitability performs worse than younger firm’s profitability. Dogan (2013) investigates 200 firms which were active in Istanbul Stock Exchange during the years 2008 – 2011. Paper does not contain financial firms due to their different financial structures. Older firms are more resistant to changes in a competitive environment and new technologies as a result of the necessity to change in their old version of technologies and usage, older firms are outdated and organizationally failure (Hannan and Freeman, 1989).
Abor (2008) investigates determinants of the capital structure of Ghanaian firms. The data includes 230 listed firms on the Ghana Stock Exchange (GSE) over the period of 1998 – 2003. Abor (2008) finds that firm age has a negative impact on profitability.
Even if firm age and profitability seem correlated and lots of works support that there is a correlation between profitability and firm age, positively or negatively. In other respects; Malik (2011) investigates the argument and finds that there is no relationship between firm age and profitability. As finding of it, they investigate 34 listed insurance companies in Pakistan. Mehari and Aemiro (2013) study on 9 insurance companies in Ethiopia over the period of 2005 – 2010. They conclude that there is no connection between firm age and profitability. People who contribute the literature, they always find a different connection or no connection between profitability and firm age.
2.3 GDP
Gross domestic product (GDP) is an indicator of economic activity. It measures the total value of all final goods and services that are newly produced within country borders over the course of the year. (Dan O’Neill, 2015)
26
Al – Najjar (2014) finds that there is a positive relationship between the change in Gross Domestic Product (GDP) and performance of a tourism firm. Economic growth improves a tourism firm’s performance and work’s data includes tourism firms in five Middle Eastern countries for the period from 2005 to 2010. These firms are based on hotels, resorts and entertainment facilities.
Brida et al. (2009) studies data which includes the variables of tourism was attained from income of tourism, proxy by series of Hotel and Restaurants at fixed prices of 2000 from 2000 to 2006 adjusted by Commerce, Hotels and Restaurants, series at prices of 1995 from 1980 and 2000; and services at prices of 2000 for the year 2007. While the annual GDP series relies on ISTAT information on GDP growth rates (constant prices in 1995) between 1980 and 2000, the 2006 time series of constant prices between 2000 and 2006 were obtained by ASTAT. Brida et al. (2009) show that tourism expenditure positively affects economic conditions of Trentino – Alto Adige province and it turn boosts firm performance.
Petria et al. (2015) examine to find out the major factors that affected the profitability of 27 commercial banks over the period from 2004 to 2011. They conclude that economic growth has a positive effect on Return on Assets and Return on Equity. At the same time, Beckmann (2007) works on to identify structural determinants of banking profitability in 16 Western European countries over the period of 1979 – 2003. The data set includes annual total country data and banking group data. (Commercial banks, cooperative banks and savings banks) Beckmann (2007) states that there is a positive relationship between GDP and profitability. Bashir (2003) investigates 14 Islamic banks in eight countries for the period of 1993 to 1998. Bashir (2003) also shows that GDP has a strong impact on firm profitability.
Kozak (2011) analyzes to determine the determinants of profitability of 25 non – life insurance companies over the period of 2002 – 2009 in Poland. Kozak (2011) finds that there is a positive relationship between profitability and GDP. The growing economy encourages companies and people to insure. There is more
27
demand from customers for insurance companies so that the transaction volumes and profitability of insurance companies are growing.
Chen (2010) finds that there is an evidence between profitability and GDP. The work shows that the connection between GDP and profitability are not strong as much as industrial sector. For hotel industry, instead of economic factor, industrial factor can affect the profitability. The data of Chen (2010) includes Ambassador Hotel, First Hotel, Grant Formosa Regent Tapai, Hotel Holiday Garden and Leofoo Corporation’s stocks. Those stocks are traded on the Taiwan Stock Exchange over the period from 1997 to 2008.
Staikouras and Wood (2004) investigate the determinants of European Bank Profitability for the period of 1994 to 1998. They claim that there is a negative relationship between profitability and GDP. Countries with higher GDP create a more challenging environment for firms which negatively affect the profitability of firms.
There are lots of researches about firm performance how GDP effects of firm performance, on the other hand, we should examine a developmental economy perspective, Chi-Ok Oh (2003) states that there is a relationship between the change in GDP and the growth of tourism. However, this relationship is showed only in the short run. Tourism growth is not influence the economy in the short run, meaning of that there is no positive relationship between the change in GDP and growth of tourism. Meanwhile, the data set used by Chi-Ok (2003) includes the period of the first quarter of 1975 through the first quarter of 2001. The model variables were derived from total tourism revenue adjusted by the consumer price index as a proxy of tourism growth and real GDP for economic expansion. On the other hand, Balaguer and Jorda (2000) examine the role of tourism in the Spanish long – run economic development. Their research is based on how tourism sector affects the growth. For empirical analysis, they use data quarterly which is the first quarter of 1975 up to the first quarter of 1997. They find that the international tourism income
28
affects the Spanish economic growth positively. In other words, there is a positive relationship between GDP and economic growth.
Dritsakis (2004) examines the analysis quarterly, for a period 1960:I – 2000:IV, regarding 1996 as the base year, and is attained from database of the OECD (Business Sector Data Base), National Statistical Service of Greece, the International Monetary Fund (IMF) and the Bank of Greece. Dritsakis (2004) argues that international tourism incomes cause economic growth with a strong relationship, while economic growth causes international tourism incomes with a simple relationship. In addition to these studies, Wong and Song (2006) conduct a study between hospitality stocks and macroeconomic indicators. Changes in interest rate variable are discovered to have a major impact on changes in hospitality stock indices whereas the consumer price index, industrial production has relatively less impact on the hospitality stock indices.
2.4 LIQUIDITY
The liquidity is the key item of a firm to pay its short term debt. The liquidity is not only measured by the cash but also by all kind of assets which can be converted to cash in short time a year, without losing their price. There are researches about liquidity effect on the profitability of firm. In the past researches, there is no mutual conclusion about liquidity effect on profitability.
Hoshi et al. (1988) examine the Japanese manufacturing firms that are listed on the Tokyo stock exchange between the year 1965 and 1980 and they find that high level of current profits multiply the level of current liquidity. Consequently, high level of current liquidity can affect investment decisions and increasing future output and profitability.
Deloof (2003) finds that effective liquidity management has a strong impact on firms’ profitability. In other words, there is a strong relationship between firm
29
profitability and liquidity. His examination has 1,009 large Belgian non - financial firms for the 1992 - 1996 periods while trying to find a relationship between WCM and corporate profitability. The results suggest that reducing the number of days accounts receivable and inventories can increase the profitability. The firms which have less profit should wait longer to pay their debts. The data used by Goddard et al. (2006)includes 12,508 firms from 1993 to 2001 and these firms are in Belgium, France, Italy, Spain and the UK. These firms include sectors such as: food products and beverages, textiles, chemicals, rubber and plastic, non – metallic mineral products, fabricated metal products, machinery and equipment, furniture, sale and maintenance of motor vehicles, wholesale trade, retail trade, land transport, supporting and auxiliary transport activities and other business activities. They find that liquidity has overwhelmingly strong impact on profitability. Hence, it was concluded that liquidity has a huge impact on profitability.
In respect to Nunes and Serrasqueiro (2015) there is also a positive connection between profitability and liquidity. Their research shows that there is strong relationship between liquidity and profitability. As we mentioned before, Nunes and Serrasqueiro (2015) research based on Knowledge – Intensive Business Service (KIBS).
Gulhan and Uzunlar (2011) examine to identify the determinants of the profitability in Turkish Banking Sector over the period of 1990 to 2008. They work by dividing these years into two, from 1990 to 2000 and 2002 to 2008. Between 1990 and 2000, there are 18 privately-owned deposit banks and between 2002 and 2008, 22 privately-owned deposit banks. It is observed that the liquidity variable for the period of 2002-2008 is negative and meaningful for the whole bank model and the foreign bank model. This finding indicates the fact that the banks' evaluations of liquid funds in the form of loans are less profitable.
30
2.5. LEVERAGE
Leverage can be defined as the investment strategy of using borrowed money. It is the amount of debt used for financial operations. There is always a risk if we do a business but there is a higher risk on the when dealing with leverage. Highly leveraged firm can go bankrupt, if they do not pay their debts on time. On the other hand, firms which manage their debts efficiently can be more productive as they can use their money to invest in new areas, manufacturing, people, etc. So there should be a balance between cash flow and debt. There are many researches about leverage and profitability. It is always hard to find to correction about it.
Sahin (2011) investigates the effects of capital structure factors, liquidity, productivity and size factors on performance. For this purpose, between 2006 and 2010, the shares of 18 companies, which are registered with the ISE, have been used. Sahin (2011) finds that there is a positive relationship between leverage and firm profitability. That is, using debt has significant positive effects in increasing firm performance.
As per Mule et al. (2015) there is a negative relationship between leverage and profitability. In other words, leverage has no impact on profitability. Their research is based on Nairobi Securities Exchange over the period from 2010 to 2014. At the same time, Akben - Selcuk (2016) shows that leverage has a negative effect on current profitability, even though leverage has a positive effect on future profitability. In other saying, for future profitability there is a positive connection between leverage and firm performance although there is a negative connection between leverage and firm performance on current profitability. She uses data set of 359 firms per year on average over the period of January 2005 to December 2014. Karadeniz and Iskenderoglu (2011) study on that the quarterly data of the eight tourism firms traded in the Istanbul Stock Exchange between 2002 and 2009. They find that leverage has a negative impact on profitability. This situation shows that the profitability of the ISE tourism firm decreases as the debt is used.
31
Aissa and Goaied (2016) find that there is a negative relationship between profitability and indebtedness. When hotels have high levels of indebtedness, they manage poor profitability. If the hotel managers want to increase their profitability, they should invest efficiently. The data used by Aissa and Goaied (2016) include 27 Tunisian hotel firms over the period of 2000 – 2010.
Dogan (2013) aims to measure the effect of capital structure on profitability in the Turkish Insurance Sector. For this purpose, the financial data of insurance companies traded in Istanbul Stock Exchange during the years of 2005-2011 are used to create a sample. Dogan (2013) has a find that there is a connection between leverage and profitability. Leverage has a negative impact on profitability. A significant portion of the resources of the insurance companies in the ISE consists of debt, which increases the risk. Even though insurance companies have a high leverage ratio, their short-term liability is good. This indicates that a large part of the total resources of the insurance companies are composed of long-term debt. Increasing the debt ratio of insurance companies increases the cost of resources and therefore reduces its profitability.
On the other hand, Al-Najjar (2014) states that there is no connection between firm performance and leverage i.e. leverage has no impact on firm performance. The data that is used in Al-Najjar (2014)’s work contains 123 unique - tourism firms which are in Bahrain, Egypt, Jordan, Kuwait and Oman over the period of 2005 to 2010.
Stierwald (2009) indicates that leverage has a strong effect on profitability. The data which is used on the research contains 961 firms over the period of 1995 to 2005. These firms include energy, financials, health, inform and technology, industrials, materials, staples, telecommunication, utilities sectors.
32
3. DATA AND METHODOLOGY
3.1. DATA
For the empirical analysis, a sample of all hospitality firms in the U.S for the period of 1990-2015 in four categories: LR (limited-service restaurants), FR (full-service restaurants), NCH (non-casino hotels), C (Casinos (except Casino Hotels) and CH (casino hotels) is constructed. We have 1.279 observations for 116 unique firms in total. These firms and their ROA, ROE, Profit Margin can be followed on appendix. Those four categories are considered by Singal (2011) and, restaurant firms are considered by Kim et al. (2011). Data is obtained from OSIRIS database.
For profitability, we use 3 different measures: (1) Return on assets (ROA), (2) Return on equity (ROE), and (3) Profit margin (PROFIT). Return on assets is calculated as the ratio of net income to total assets. The second dependent variable is return on equity measured by net income to equity and profit margin is the ratio of net income to the sales.
At the same time, we use 5 independent variables in line with the literature (Sharma and Kumar, 2011; Al – Najjar 2014; Aissa and Goaied, 2016; Goddard et al. 2006; Chen 2010; Akben – Selcuk 2016; Balaguer and Jorda, 2010; Chi-Ok, 2003) which are firm age, firm size, liquidity, leverage and GDP. Size (SIZE) is the natural logarithm of the total assets. Firm age (AGE) shows the number of existence of firm years. Liquidity (LIQ) is the current ratio calculated as the ratio of current assets to current liabilities. Leverage (LEV) is the ratio of debt to equity. GDP growth (GDP) is the real growth rate of GDP.
Larger firms are more diversified and better managed than small firms. Thanks to their size, larger firms have a better relationship between competitors, suppliers, financial and public institutions. Stierwald (2009), Dogan (2013),
33
Majumdar (1997) and Al – Najjar (2014) emphasize a positive connection between firm size and profitability.
H1: There is a positive relationship between size and profitability.
Older firms can reach resources more easily than younger firms (Autio, 2005). Their reputations and experiences in the sector will help to connect with suppliers, business network, and finance sector more easily. Autio (2005) finds a positive relation between profitability and firm age.
H2: A firm age positively influences its profitability.
GDP is measured by the economy’s total production and services (Chen, 2010). It shows the economic condition of a country. So if GDP increases, economic condition of firms will be better. Al – Najjar (2014) and Brida et al. (2009) find a positive relation between GDP and profitability.
H3: GDP positively influences firm’s profitability.
Firm’s cash and asset should convert to cash in short term in order to make a quick decision and adopt new situations. Deloof (2003), Goddard et al. (2006), Nunes and Serrasquieiro (2015) find a positive relation between profitability and liquidity.
H4: Liquidity positively influences firm’s profitability.
Leverage is one of the main for firms because of the need to maximize return to the various stock holders and also because of the fact that it has big influence on the firms’ ability to deal with competitive environment. Mule et al. (2015), Akben– Selcuk (2016) find a negative relation between leverage and profitability.
34
3.2. METHODOLOGY
We apply regression analysis to find the relationship between profitability and independent variables. The estimation of panel data regression tests is based on three methods: pooled ordinary least square (OLS), the fixed effects model, and the random effects model in line with Chen (2011). There are some advantages of using panel data. Panel data can give more information about data. It provides stronger information for efficiency and it can control for an individual firm’s heterogeneity (Chen, 2011). The pooled OLS estimates a common constant for all cross-sections while the constant is treated as section-specific in the fixed effects model. However, constants for each section are random parameters in the random effects model.
The following models are estimated in line with Aissa and Goaied (2016), Sharma and Kumar (2011), Charitou et al. (2010)
(1) (2) (3)
35
4. FINDINGS
Table 6 shows the descriptive statistics for variables used in the analysis. We run fixed effects and random effects models. Hausman test suggests us to prefer the estimations of the fixed effects model. Therefore, we present the fixed effects estimations in the study. It is shown that mean values for ROA is 0.83%. Table 6 shows that mean values for PROFIT 3.35% however ROE has a negative mean of -1.01%. These results show that firms in our sample have relatively low profitability ratios and when ROE is concerned, there is a negative performance. Moreover, we also observe extreme values in all profitability measures. SIZE indicates that listed firms had a mean of 19.07. AGE points out that listed firms had a mean of 13.57. LEV shows that firms have a mean of 3.76. GDP and LIQ have a mean of 2.36 and 1.37, respectively.
Table 6: Descriptive Statistics
Variables. Observation Mean Std. Dev. Min Max
PROFIT 1,279 3.35 19.36 -99.22 95.17 ROE 1,279 -1.01 88.85 -945.01 869.64 ROA 1,279 0.83 14.19 -85.78 62.84 LIQ 1,214 1.37 1.45 0.02 19.84 LEV 1,279 3.76 9.07 0.0017 121.95 AGE 1,279 13.57 7.73 8.00 56.00 SIZE 1,279 19.07 2.35 11.52 24.36 GDP 1,279 2.36 1.63 -2.78 4.69
Table 7 provides the correlation coefficients between all variables. It is seen that the correlation coefficients between explanatory variables are generally low meaning that there is no problem of multicollinearity. SIZE, AGE, GDP and LIQ are positively associated with ROA, ROE and PROFIT. On the other hand, LEV is the only variable which is a negative relation with all three dependent variables.
36
The correlation between ROA and ROE is 0.61 while the correlation between PROFIT and ROA is 0.74. This shows that all profitability measures move in line with each other.
Table 7: Correlation Coefficients
ROA ROE PROFIT LIQ LEV AGE SIZE GDP
ROA 1.0000 ROE 0.6079 1.0000 PROFIT 0.7368 0.4440 1.0000 LIQ 0.0574 0.0465 0.0684 1.0000 LEV -0.0433 -0.0309 -0.0598 -0.1113 1.0000 AGE 0.0778 0.0254 0.1451 -0.0019 -0.0090 1.0000 SIZE 0.3105 0.1862 0.2842 -0.0853 0.1015 0.1401 1.0000 GDP 0.0442 0.0442 0.0306 -0.0413 -0.0219 -0.1083 -0.1052 1.0000
Table 8 presents the regression analysis for profitability measures namely return on asset (ROA), return on equity (ROE) and profit margin (PROFIT). The columns from 1-3 show the fixed effect results and the columns 4–6 show pooled ordinary least square (OLS) results.
It is found that firm size is negative related (statistically significant) with ROA, ROE and PROFIT according to fixed effects estimations. OLS results provide a positive and statistically significant relationship. OLS model estimations support our expectation about firm size and profitability while the fixed effect shows the opposite of our expectation. Chen (2010) examines tourism firms and finds out that there is a negative association between firm size and ROE and ROA. Dhawan (2001), Ramasamy et al. (2005) also find a negative relation between profitability and firm size. Sharma and Kumar (2011) state that there is a negative correlation between SIZE and ROA. On the other hand, Majumdar (1997), Al – Najjar (2014), and Dogan (2013) argue that there is a positive association between profitability and firm size.
37
Table 8: Regression Analysis; ROA, ROE, PROFIT (the Fixed Effect and a Pooled OLS
Methods)
Fixed Effects OLS
ROA ROE PROFIT ROA ROE PROFIT
LIQ 0.636** 2.634 0.851 0.811*** 3.675** 1.110*** (0.018) (0.189) (0.020) (0.003) (0.030) (0.001) LEV -0.0921** -0.383 -0.102** -0.104** -0.413 -0.156*** (0.016) (0.179) (0.050) (0.017) (0.130) (0.005) AGE 0.0706 1.545*** 0.190** 0.0516 0.0309 0.180*** (0318) (0.002) (0.048) (0.138) (0.886) (0.000) SIZE -0.915* -12.77*** -1.305* 2.011*** 7.448*** 2.275*** (0.081) (0.001) (0.066) (0.000) (0.000) (0.000) GDP 0.574*** 3.606** 0.783*** 0.752*** 3.587** 0.847*** (0.006) (0.020) (0.005) (0.002) (0.018) (0.006) Constant 15.72 212.6*** 22.98* -40.64*** -155.7*** -45.68*** (0.100) (0.002) (0.076) (0.000) (0.000) (0.000) N 1,214 1,214 1,214 1,214 1,214 1,214 R-Square 0.023 0.019 0.020 0.116 0.045 0.112
Note: p-values are given in the parenthesis. ***, **, and * represent significance level at 1%, 5% and 10%, respectively.
ROA=Return on Asset; ROE=Return on Equity; PROFIT=net income/sales; AGE=firm age; SIZE=natural logarithm of total assets; GDP=real GDP growth rate; LEV=debt to equity ratio; LIQ=current assets/current liabilities
Firm age has a positive and statistically significant effect on ROE and PROFIT according to the fixed effects model. There is a positive relationship between age and PROFIT according to the pooled OLS. Our expectation is that the firm age has a positive impact on profitability. Aissa and Goaied (2016) argue that firm age has a positive impact on hotel profitability. The findings are also consistent with result reported in the literature with Autio (2005).
LIQ associates a positive and statistically significant relationship with ROA and PROFIT using the fixed effects model while it has a positive and statistically significant on all profitability measures according to OLS estimates. This is in line with Hypothesis 4 assuming that there is a positive relation between liquidity and