SENESCENCE AND IMMORTALITY GENES
AS MARKERS OF HEPATOCELLULAR
CARCINOGENESIS
a thesis
submitted to the department of molecular biology
and genetics
and the institute of engineering and sciences
of bilkent university
in partial fulfillment of the requirements
for the degree of
doctor of philosophy
By
Ay¸ca Arslan Erg¨
ul
I certify that I have read this thesis and that, in my opinion, it is fully adequate, in scope and in quality, as a thesis for the degree of Doctor of Philosophy.
_________________________________ Prof. Dr. Mehmet Öztürk (Supervisor)
I certify that I have read this thesis and that, in my opinion, it is fully adequate, in scope and in quality, as a thesis for the degree of Doctor of Philosophy.
_________________________________ Asst. Prof. Dr. Özlen Konu
I certify that I have read this thesis and that, in my opinion, it is fully adequate, in scope and in quality, as a thesis for the degree of Doctor of Philosophy.
_________________________________ Asst. Prof. Dr. Cengiz Yakıcıer
I certify that I have read this thesis and that, in my opinion, it is fully adequate, in scope and in quality, as a thesis for the degree of Doctor of Philosophy.
_________________________________ Prof. Dr. Funda Yılmaz-Barbet
I certify that I have read this thesis and that, in my opinion, it is fully adequate, in scope and in quality, as a thesis for the degree of Doctor of Philosophy.
_________________________________ Assoc. Prof. Dr. Esra Erdal
Approved for the Institute of Engineering and Science
_________________________________ Prof. Dr. Mehmet Baray Director of Institute of Engineering and Science
ABSTRACT
SENESCENCE AND IMMORTALITY GENES
AS MARKERS OF HEPATOCELLULAR
CARCINOGENESIS
Ay¸ca Arslan Erg¨
ul
Ph.D. in Molecular Biology and Genetics
Supervisor: Prof. Dr. Mehmet ¨
Ozt¨
urk
August 2009
Cellular senescence is a tumor-suppression mechanism, and immortalization facilitates neoplastic transformation. Both mechanisms may be highly relevant to hepatocellular carcinoma (HCC) development. We worked on two major aspects of cellular senescence and immortality in HCC. First, we analyzed the role of ZEB2 (Smad-interacting protein SIP1, ZFXH1B) gene for a senescence-related role in HCC. Then, we extended our work on the identification and analysis of a senescence and immortality gene network (SIGN) in relation to hepatocellular carcinogenesis. ZEB2 is a transcriptional repressor of E-cadherin, and induces epithelial-mesenchymal transition (EMT), a key process involved in tumor metas-tasis and progression. However, ZEB2 is also a repressor of telomerase reverse transcriptase (TERT) gene, which encodes a key enzyme required for telomere maintenance and tumor cell immortality. We performed in-vivo, in-silico and in-vitro studies to explore potential implications of ZEB2 in hepatocellular carci-noma (HCC). Tissue expression of ZEB2 transcripts displayed stepwise decreases in HCC lesions, as compared to liver cirrhosis. This inverse correlation suggested that sustained ZEB2 expression is not compatible with HCC progression. Next,
we studied in vitro effects of ZEB2 knockdown and overexpression in HCC cells. Huh7 clones stably transfected with a specific ZEB2-shRNA expression vector displayed increased colony formation and increased proliferation. Conversely, Hep3B cells stably transfected with ZEB2 expression vector displayed permanent cell cycle arrest associated with increased senescence-associated β-galactosidase activity. ZEB2-induced senescence arrest was correlated with the repression of TERT expression and concomitant upregulation of cycldependent kinase
in-hibitor p21Cip1. Transient expression of ZEB2 did not induce p21Cip1 expression,
suggesting an indirect mechanism. Finally, ZEB2 overexpression was not com-patible with in vitro survival of cancer cells, as ZEB2-overexpressing Hep3B and A431 clones depleted progressively during in vitro culture and expansion. These observations suggest that the ZEB2 gene, aside from its role in EMT, also plays a negative role in HCC cell growth and survival.
In the other study, we integrated gene expression data from senescence pro-grammed and immortal HCC cells with the data from cirrhosis and HCC tissues to generate a SIGN signature. The SIGN signature accurately classified nor-mal liver, cirrhosis, dysplasia and HCC lesions, and indicated that senescence-to-immortality conversion first occured during dysplasia-to-early HCC transi-tion. Senescence-to-immortality conversion contributed also to tumor progres-sion. This conversion was accompanied by hepatic dedifferentiation and increased expression of cell proliferation, chromosome modification and DNA damage re-sponse genes. Thus, HCC immortalization is closely associated with the ac-quisition of stem/progenitor-like features. Finally, we identified a large set of upregulated DNA damage checkpoint and DNA repair genes that showed signif-icant associations with tumor initiation and progression. These genes may serve as potential targets for HCC prevention and therapy.
Keywords: Senescence, Liver Cancer, Gene Expression Profiling, Biological
¨
OZET
HEPATOSEL ¨
ULER KARS˙INOGENEZ BEL˙IRTEC˙I OLARAK
YAS¸LANMA VE ¨
OL ¨
UMS ¨
UZL ¨
UK GENLER˙I
Ay¸ca Arslan Erg¨
ul
Molek¨
uler Biyoloji ve Genetik B¨ol¨
um¨
u Doktora
Tez Y¨oneticisi: Prof. Dr. Mehmet ¨
Ozt¨
urk
A˘gustos 2009
H¨ucre ya¸slanması t¨um¨or baskılayıcı bir mekanizmadır ve ¨ol¨ums¨uzl¨uk,
neoplas-tik d¨on¨u¸s¨um¨u kolayla¸stırır. Her iki mekanizma da hepatosel¨uler karsinom (HCC)
geli¸simi ile yakından ili¸skilidir. Biz, HCC’de h¨ucre ya¸slanması ve ¨ol¨ums¨uzl¨ug¨un¨u
iki a¸cıdan ¸calı¸stık. Once, ZEB2 (Smad ile etkile¸sen protein SIP1, ZFHX1B)¨
geninin HCC’deki ya¸slanma ile ili¸skili rol¨un¨u inceledik. Sonra, ¸calı¸smamızı,
hep-atosel¨uler kanser ile ili¸skili ya¸slanma ve ¨ol¨ums¨uzl¨uk gen a˘gı (SIGN)’nın
belirlen-mesi ve analizi y¨on¨unde geni¸slettik. ZEB2, E-kaderin’i baskılar ve t¨um¨or
metas-tazında ve geli¸siminde anahtar rol oynayan, epitel-mezenkimal ge¸ci¸s (EMT)’yi, ind¨ukler. ¨Ote yandan ZEB2, telomer muhafazası ve t¨um¨or h¨ucre ¨ol¨ums¨uzl¨ug¨u i¸cin gerekli enzim, telomeraz ters transkriptaz (TERT)’i baskılar. Biz, ZEB2’nin
hep-atosel¨uler kanserdeki potansiyel anlamını ke¸sfetmek i¸cin, vivo, vitro ve
in-silico ¸calı¸stık. ZEB2 transkriptlerinin doku ifadeleri, HCC lezyonlarında, karaci˘ger sirozuna kıyasla dereceli olarak azalma g¨osterdi. Bu ters ba˘gıntı, ZEB2 ifadesinin,
HCC’nin ilerlemesiyle uyumlu olmadı˘gını akla getirdi. Sonra, HCC h¨ucrelerinde
ZEB2’nin azaltılması ve artırılmasının in vitro etkilerini ¸calı¸stık. Ozg¨¨ un bir
ZEB2-shRNA ifade vekt¨or¨u ile kararlı ¸sekilde transfekte edilen Huh7 klonları,
vekt¨or¨u ile transfekte edilen Hep3B h¨ucrelerinin, ya¸slanma ili¸skili β-galaktozidaz aktivitesi ile, kalıcı h¨ucre d¨ong¨us¨u hapsine girdiklerini g¨ord¨uk. ZEB2 ile ind¨uklenen ya¸slanma hapsi, TERT ifadesinin baskılanması ve e¸slik eden siklin-ba˘gımlı kinaz engelleyici p21Cip1’in ifadesindeki artı¸s ile ba˘gıntılı idi. ZEB2’nin ge¸cici ifadesi,
p21Cip1 ifadesindeki artı¸sı ind¨uklemedi. Son olarak, ZEB2’yi a¸sırı ifade eden
Hep3B ve A431 klonlarının, in vitro k¨ult¨urde dereceli olarak azalması ile ZEB2
a¸sırı ifadesinin, kanser h¨ucrelerinin in vitro ya¸samı ile uyumlu olmadı˘gı sonucuna
varıldı. Bu g¨ozlemler, ZEB2 geninin, EMT’deki rol¨un¨un dı¸sında, HCC h¨ucre
b¨uy¨umesi ve ya¸samasında negatif rol oynadı˘gını d¨u¸s¨und¨urd¨u.
Di˘ger ¸calı¸smamızda SIGN imzasını olu¸sturmak i¸cin, ya¸slanmaya
program-lanmı¸s ve ¨ol¨ums¨uz HCC h¨ucrelerinden gelen gen ifade datasını, siroz ve HCC
dokularından gelen data ile birle¸stirdik. SIGN imzası normal karaci˘ger, siroz,
dis-plazi ve HCC lezyonlarını do˘grulukla sınıflandırdı ve ya¸slanmadan ¨ol¨ums¨uzl¨u˘ge
d¨on¨u¸s¨um¨un, ilk olarak displaziden erken HCC’ye ge¸ci¸ste ger¸cekle¸sti˘gini belirledi. Bu d¨on¨u¸s¨um, t¨um¨or ilerlemesine de katkıda bulunur. Ya¸slanmadan ¨ol¨ums¨uzl¨u˘ge d¨on¨u¸s¨ume, hepatik geri ba¸skala¸sım ile ve h¨ucre ¸co˘galması, kromozom de˘gi¸simi ve DNA hasar yanıtı genlerindeki ifade artı¸sı e¸slik etti. Bu nedenle, HCC ¨ol¨ums¨uzl¨u˘g¨u, k¨ok h¨ucre/¨onc¨u h¨ucre benzeri ¨ozellikler ile yakından ili¸skilidir. Son olarak, DNA
hasar kontrol noktası ve DNA tamir genlerindeki artı¸s ile, t¨um¨or ba¸slangıcı ve
ilerlemesi arasında ili¸ski bulduk. Bu genler, HCC’nin engellenmesinde ve ter-apisinde potansiyel hedefler olabilirler.
Anahtar Kelimeler: Ya¸slanma, Karaci˘ger kanseri, Gen ifade analizi, Biyolojik
ACKNOWLEDGMENTS
I would like to thank my supervisor, Prof. Mehmet ¨Ozt¨urk, for sharing his
knowl-edge with me. I have enrolled to Molecular Biology and Genetics Department after inspired by him and I am proud to be a member of his group. I believe
Prof. ¨Ozt¨urk has contributed to science in Turkey to a great extend, and I am
grateful to him for all his guidance.
I would like to thank my MS supervisor, Prof. Hakan Bozkaya, for his endless support during years. I have learnt the liver from him, and also by Prof. Bozkaya, I understood the reality of HCC as a disease by observing him as a doctor.
I thank Assist. Prof. ¨Ozlen Konu, for guiding me through bioinformatics and
for her patience, energy and for being there all the time I needed. I thank Assoc.
Prof. Reng¨ul C¸ etin Atalay and Assoc. Prof. I¸sık Yulu˘g for teaching me, and
for their close concern. Its always a pleasure to work with Assist. Prof. Uygar Tazebay and I thank all faculty members of MBG.
I thank Prof. Levent G¨urel, for his support, guidance, and for all the things I
have learnt from him over the years. I also thank Defne, Aylin, and Assist. Prof.
Meltem G¨urel for being our family in Ankara.
My group mates, Dr. Nuri ¨Ozt¨urk, Dr. Hani Al-Otaibi, S¸erif S¸ent¨urk, Mine
Mumcuo˘glu, Sevgi Ba˘gı¸slar, Haluk Y¨uz¨ug¨ull¨u, Pelin G¨ulay, Nilg¨un Ta¸sdemir,
and ¨Ozge Y¨uz¨ug¨ull¨u. I have learnt from you, we have shared so much, we worked
Our lab is always the most cheerful environment, I would like to thank all my collegues from MBG Family, that I cannot list in here. But to the most cheering
mates, Ceren Sucularlı, Tolga Acun, and Dr. Bˆalˆa G¨ur-Dedeo˘glu, thank you for
Contents
1 INTRODUCTION 2
1.1 Hepatocellular carcinoma . . . 2
1.2 Senescence . . . 6
1.3 Senescence in HCC . . . 11
1.3.1 Reprogramming of replicative senescence in HCC . . . 13
1.4 SIP1/ZEB2/ZFHX1B gene and its relationship with HCC and senescence . . . 13
1.5 DNA damage repair . . . 16
1.6 Gene expression profiling . . . 18
2 OBJECTIVES AND RATIONALE 21 3 MATERIALS AND METHODS 23 3.1 MATERIALS . . . 23
3.1.1 Cell Culture Solutions . . . 23
3.1.2 Microbiology Solutions . . . 24
3.1.3 Western Blot Solutions . . . 24
3.1.4 Agarose gel solutions . . . 26
3.1.5 SABG solutions . . . 26
3.1.6 Microarray reagents . . . 27
3.2 METHODS . . . 28
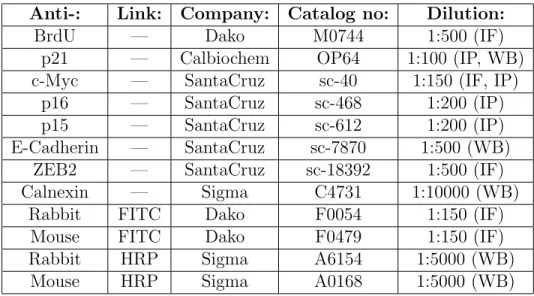
3.2.2 Cell lines . . . 28 3.2.3 RNA isolation . . . 29 3.2.4 cDNA preparations . . . 30 3.2.5 Semi-quantitative RT-PCR . . . 30 3.2.6 Quantitative real-time RT-PCR . . . 31 3.2.7 Antibodies . . . 32 3.2.8 Western Blotting . . . 32 3.2.9 Immunofluorescence . . . 34 3.2.10 Immunoperoxidase . . . 34
3.2.11 Senescence-associated beta-galactosidase (SABG) assays . 35 3.2.12 Long term BrdU labeling assay . . . 35
3.2.13 Statistical Analysis . . . 36
3.2.14 Microarray experiments . . . 36
3.2.15 Data processing and quality control . . . 41
3.2.16 Data Import. . . 42 3.2.17 Class Comparison. . . 42 3.2.18 Hierarchical Clustering . . . 42 3.2.19 Intersection lists . . . 42 3.2.20 Scatterplots . . . 42 3.2.21 Pathways Analysis . . . 43
3.2.22 Clinical Dataset Analysis . . . 43
3.2.23 Prediction analysis . . . 43
3.2.24 Creation of immortality- and senescence-associated gene lists 43 4 RESULTS 45 4.1 Downregulation and the Anti-growth Effect of ZEB2 in Hepato-cellular Carcinoma . . . 45
4.1.1 Extraction of ZEB2 expression from the publicly available microarray datasets . . . 45
4.1.2 ZEB2 expression in tumor and nontumor pairs . . . 46
4.1.3 Senescence-like growth arrest in ZEB2-overexpressing Hep3B
clones . . . 47
4.1.4 Sustained expression of ZEB2 is not compatible with the
expansion of Hep3B cell line . . . 53
4.1.5 Sustained expression of ZEB2 is not compatible with the
expansion of A431 cells . . . 55
4.2 A Major Role for Senescence and Immortality Gene Network in
Hepatocellular Carcinoma . . . 67
4.2.1 Microarray experiments with HCC and cirrhosis samples . 67
4.2.2 Establishing a senescence and immortality gene network
signature for cirrhosis and hepatocellular carcinoma. . . . 75
4.2.3 Discriminating between preneoplastic and neoplastic stages
of hepatocellular carcinogenesis by the SIGN signature. . . 78
4.2.4 The contribution of senescence- and immortality-related
bi-ological processes to hepatocellular carcinoma development
and tumor heterogeneity. . . 84
4.2.5 DNA damage response genes as potential therapeutic targets 85
5 DISCUSSION 88
5.1 Downregulation and the anti-growth effect of ZEB2 in
hepatocel-lular carcinoma. . . 88
5.2 A Major Role for the Senescence and Immortality Gene Network
in Hepatocellular Carcinoma . . . 91
A 107
A.1 Aminoacid alignments for human and mouse SIP1 proteins . . . . 107 A.2 RIN values . . . 107 A.2.1 RIN values of the samples that were used in the analysis . 107
A.2.2 RIN values of the samples that are saved for future analysis 107 A.2.3 RIN values of the samples with low RNA quality . . . 117 A.3 MA-plots . . . 117
List of Figures
1.1 Major risk factors and mechanisms responsible from HCC. . . 3
1.2 Histopatological progression of HCC. . . 4
1.3 Major pathways that are activated in HCC are shown. . . 5
1.4 Different pathways that lead to senescence. . . 7
1.5 Senescence pathways . . . 10
1.6 Role of cellular senescence and immortalization in hepatocellular carcinogenesis. . . 12
1.7 Regulators of TERT promoter. . . 14
1.8 ShRNA mediated down-regulation of endogeneous ZEB2 transcripts in senescent cells. . . 15
1.9 DNA damage response reactions in mammalian cells . . . 17
4.1 ZEB2 expression is induced in cirrhosis, but lost during malignant progression of HCC. . . 46
4.2 ZEB2 expression in tumor-nontumor pairs . . . 47
4.3 ZEB2 represses TERT expression and induces senescence-like growth arrest in HCC-derived Hep3B cells. . . 48
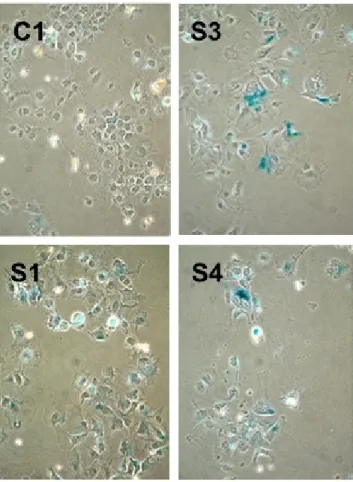
4.4 ZEB2-expressing clones display positive staining for SABG. . . 49
4.5 ZEB2-expressing S1, S3 and S4 clones generate colonies with high rates of permanently arrested cells. . . 51 4.6 Quantitative analysis of permanent growth arrest showing a
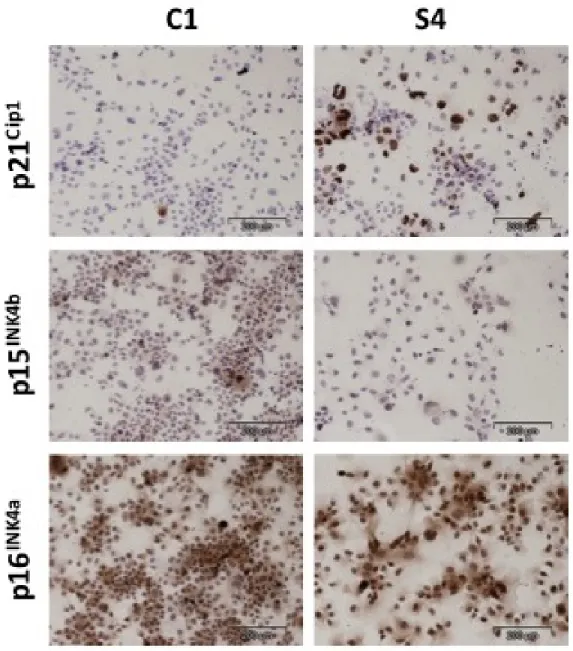
4.7 p21Cip1 expression is induced in a fraction of ZEB2-expressing S4
clones, as compared to C1 control clone. . . 54
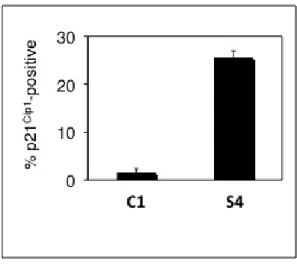
4.8 Quantitative analysis of p21Cip1 expression in Hep3B clones . . . . 55
4.9 ZEB2 effects in Hep3B clones are reversible. . . 56
4.10 In vitro expansion of S1, S3 and S4 clones is not compatible with ZEB2 overexpression. . . 57
4.11 Loss of ZEB2-mediated E-cadherin repression in late passages. . . 57
4.12 ZEB2-expressing clones display decreased telomerase activity at early, but not late passages. . . 58
4.13 A431 cells change their morphology upon ZEB2 induction. . . 59
4.14 Tetracycline-regulated ZEB2 expression in A431/ZEB2 cells in-duces permanent growth arrest and its forced expression is not compatible with cell expansion. . . 60
4.15 Quantitative analysis confirms loss of ZEB2 expression in A431 cells. 61 4.16 ZEB2-induction results in increased rates of permanently growth arrested cells. . . 63
4.17 Quantitative analysis of BrdU-negative non proliferating cells. . . 64
4.18 Loss of ZEB2 expressing cells over long term culture under induced conditions. . . 65
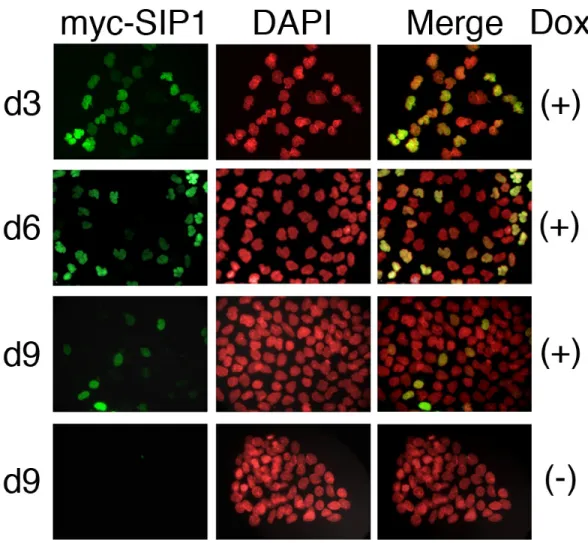
4.19 Cells exposed to continuous Dox treatment have lost Myc-ZEB2 expression almost completely, as opposed to strongly positive non-induced cells. . . 66
4.20 Interpretation of Agilent electropherograms . . . 68
4.21 Nuse Plot . . . 72
4.22 RLE Plot . . . 72
4.23 Significant probe-sets generated from in vitro cell line and in vivo clinical samples were integrated . . . 76
4.24 Unsupervised cluster analysis of Huh7-derived immortal,
presenes-cent and senespresenes-cent clones with 1909 probesets. . . 77
4.25 Unsupervised cluster analysis of HCC and cirrhosis samples with
1909 probesets. . . 79
4.26 Hierarchical clustering of gene expression data from Wurmbach et
al. . . 80
4.27 Hierarchical clustering of gene expression data from Wurmbach et
al. with sample IDs . . . 81
4.28 Classification of 72 liver tissue samples by binary tree analysis
using SIGN probesets. . . 82
4.29 Differential expression of senescence- and immortality-associated
genes between different liver lesions. . . 83
4.30 Upregulation of DNA damage response genes in hepatocellular
car-cinoma . . . 87
5.1 The expression of ZEB2 in HCC-derived cell lines. . . 90
A.1 Aminoacid alignments for human and mouse SIP1 proteins . . . . 109 A.2 Agilent Bioanalyzer plots of the samples that were included in
microarray experiments . . . 114 A.3 Agilent Bioanalyzer plots of RNA samples that are saved for future
experiments . . . 116 A.4 Agilent Bioanalyzer plots of RNA samples with low quality. These
samples were not included in microarray experiments . . . 121 A.5 MA-plots of tissues . . . 123
List of Tables
3.1 SDS-PAGE Gel Formulations . . . 26
3.2 Primer List . . . 31
3.3 Antibodies List . . . 32
3.4 Preparation of Second-Strand Master Mix . . . 37
3.5 Preparation of IVT Reaction Mix . . . 38
3.6 Hybridization Cocktail . . . 39
3.7 Fluidics Protocol . . . 41
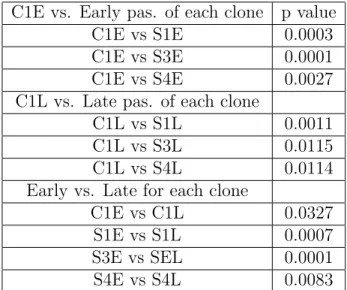
4.1 p values for the telomerase data in Figure 4.12 . . . 56
4.2 Agilent Values of the RNAs isolated from HCC and cirrhosis tissues 71 4.3 Cirrhosis and hepatocellular carcinoma samples used for microar-ray analyses . . . 74
To My ¨
Ozg¨
ur and My Family...
¨
Chapter 1
INTRODUCTION
1.1
Hepatocellular carcinoma
Hepatocellular carcinoma (HCC) is the fifth most-common cancer worldwide, with more than 600,000 new cases reported and an equal number of deaths each year [1]. HCC develops on a chronic liver disease and cirrhosis background for the majority (70% to 90%) of the cases. Major risk factors of HCC can be listed as hepatitis B, hepatitis C, alcoholic liver disease, and nonalcoholic steatohepati-tis. HCC incidence is increasing in Europe and North America, mostly due to hepatitis C virus (HCV) infection [2, 3].
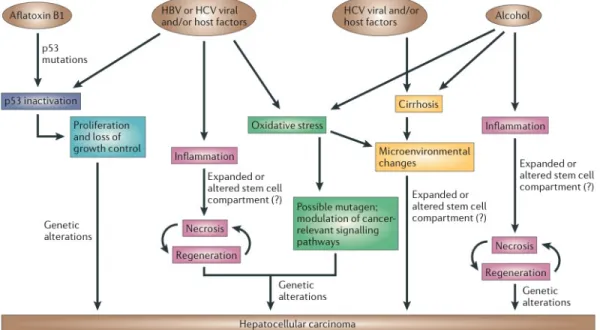
In spite of diverse risk factors, there are common mechanisms affected (Figure 1.1). Hepatitis B and aflatoxin B1, a mutagen, both affect the genome. p53 inac-tivation is observed in HCV-, HBV and aflatoxin-B1 induced HCC. Also in HBV-, HCV-, and alcohol-induced HCC, inflammation, necrosis, and regeneration are common processes [4].
Although not precisely identified, HCC generally follows a progression as de-scribed in Figure 1.2. It takes 20-30 years to develop a chronic liver disease after infection with hepatitis viruses. In some of the patients cirrhosis and HCC arise
Figure 1.1: Major risk factors and mechanisms responsible from hepatocellular carcinoma. HBV, hepatitis B virus; HCV, hepatitis C virus. Adapted from Farazi and DePinho, 2006 [4].
in sites of chronic hepatitis. HCC can be classified into well differentiated, mod-erately differentiated, and poorly differentiated tumors, the latter being the most malignant type [4, 5].
Treatment options of this cancer are limited, thus, it is necessary to identify novel genes involved in HCC to implement new diagnostic and treatment options. However, the molecular pathogenesis of HCC largely remains unsolved [2, 4, 5, 6, 7]. Only a few genetic alterations, namely those affecting p53, β-catenin and p16INK4a, have been implicated at moderate frequencies in these cancers [6].
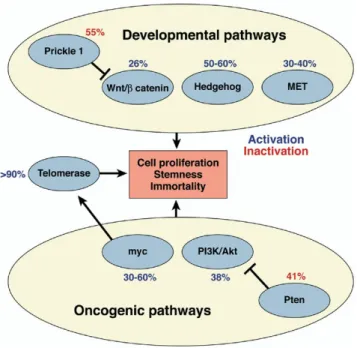
The only consistent and highly frequent change in HCC is the reactivation of telomerase activity, which has been detected in more than 80% of cases [2, 8, 9, 10, 11]. Telomerase activity in HCC is linked to the reactivation of telomerase reverse transcriptase (TERT) expression [11].
Figure 1.2: Histopatological progression of HCC. HBV, HCV, alcohol, and afla-toxin are the major risk factors leading to HCC by inducing cycles of necrosis and proliferation. After chronic liver disease or damage, collagen is accumulated and causes fibrosis. Deposition of fibrotic tissue and abnormal liver nodules are char-acteristics of cirrhosis. Nodules then become hyperplastic and finally dysplastic which eventually progress to HCC. Genomic instability is observed in nodules and characterize HCC most prominently with the loss or mutation of p53. Adapted from Farazi and DePinho, 2006 [4].
Figure 1.3: Major pathways that are activated in HCC are shown. These path-ways, the Akt, the myc, the β-catenin, the hedgehog, and the met pathways are activated in 20-60% in HCCs. Telomerase activation is the most frequent event in HCC. Adapted from El-Serag and Rudolph, 2007 [2]
to maintain chromosomal integrity during subsequent cell divisions [12]. Appar-ently, HCC development requires consistent telomerase activity, as telomerase deficiency in mice causes a significant decline in the occurrence of high-grade liver malignancies [13]. It is currently unclear how TERT expression is repressed in normal hepatocytes, but released in HCC cells. The integration of HBV DNA sequences into the TERT gene provides evidence for a virus-induced deregulation of TERT expression [13], but this appears to occur rarely, as only four cases have been reported so far [14, 15]. HBV X and PreS2 proteins may upregulate TERT expression [16, 17] but HBV X was also shown to repress the TERT promoter [18].
1.2
Senescence
Replicative immortality is a common acquired feature of all cancers. Somatic cells have a limited number of cell divisions due to end replication problem at the ends of the chromosomes, namely telomeric sequences. Replicative senescence is the inevitable consequence of this problem which is also a strong barrier in preventing cancer cell immortality. Senescent phenotype is charaterized by growth arrest and apoptosis resistance, also altered gene expressions accompany these phenotypic changes. A pre-senescent cell can turn into a senescent cell in diverse ways. Dysfunctional damage as well as non-telomeric DNA damage, strong mitogenic signals and also chromatin perturbations may cause this shift [19].
Most human somatic cells are telomerase deficient. Telomerase reverse tran-scriptase (TERT) enzyme is repressed in somatic cells during differentiation and this leads to progressive erosion of telomeric DNA in each round of cell division. This form of senescence is called replicative or telomere-dependent senescence (Figure 1.4).
and promotes cell transformation. DNA damage response and oncogene-induced senescence are established follow-ing DNA hyper-replication immediately after oncogene expression. Senescent cells arrest with partly replicated DNA, where DNA replication origins have fired multiple times, prematurely terminated DNA replication forks and DNA double-strand breaks are present[23,24].
ROS-induced senescence, the other telomeindepen-dent senescence pathway is gaining importance (for a re-cent review see Ref. [25]). Mitochondria are the major intracellular sources of ROS which are mainly generated at the respiratory chain. Therefore, ROS have been sus-pected for many years as cellular metabolites involved in organismal aging[26]. ROS are also generated in the cyto-plasm by the NOX family of enzymes[27]. Experimental induction of ROS accumulation in cells (for example by mild H2O2 treatment or glutathione depletion) induces senescence-like growth arrest in different cell types, whereas anti-oxidant treatment can inhibit senescence
[25]. More importantly, ROS have been identified as critical mediators of both telomere-dependent and oncogene-in-duced senescence. Telomere-dependent senescence arrest
is accelerated in cells grown under high O2conditions.
In-versely, cells grown under low O2conditions display
in-creased lifespan ([28], see Ref. [25]). ROS also play a critical role in Ras-induced senescence[29,30].
Currently, mechanisms of ROS-induced senescence are not fully understood. It is generally accepted that oxidative stress and ROS eventually cause DNA damage, whereby DNA damage response may contribute to senescence induction. The relationship between mitochondrial dys-function, ROS, DNA damage and telomere-dependent senescence has recently been demonstrated[31]. However, ROS may also induce modifications in the cellular signaling pathways resulting in senescence arrest. For example, ROS induce senescence in hematopoietic stem cells by activat-ing p38 MAPK[32].
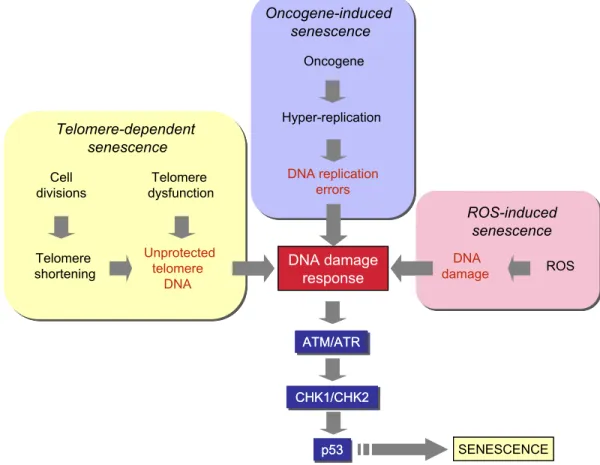
Whether induced by telomere dysfunction, DNA repli-cation stress following oncogene activation, or ROS accu-mulation, DNA damage is one of the common steps in the generation of senescence arrest via p53 activation (Fig. 1). Upstream checkpoint kinases, such as ATM or ATR are activated in response to DNA damage in the form of double-stand breaks. These kinases phosphorylate
ATM/ATR ATM/ATR SENESCENCE Telomere- dependent senescence Oncogene-induced senescence ROS-induced senescence ROS Telomere shortening Telomere dysfunction Unprotected telomere DNA DNA replication errors p53 p53 DNA damage response DNA damage response Oncogene CHK1/CHK2 CHK1/CHK2 DNA damage Hyper-replication Cell divisions ATM/ATR SENESCENCE Telomere-dependent senescence Oncogene-induced senescence ROS-induced senescence ROS Telomere shortening Telomere dysfunction Unprotected telomere DNA DNA replication errors p53 DNA damage response DNA damage response Oncogene CHK1/CHK2 DNA damage Hyper-replication Cell divisions
Fig. 1. DNA damage and p53 activation play a central role in different senescence pathways. DNA damage (often in the form of double-strand breaks) activate upstream kinases (ATM and ATR) leading to p53 phosphorylation by CHK1 and CHK2 kinases. Phosphoryated p53 is released from MDM, and stabilized in order to induce senescence arrest or apoptosis (not shown here).
M. Ozturk et al. / Cancer Letters xxx (2008) xxx–xxx 3 ARTICLE IN PRESS
Figure 1.4: Different pathways that lead to senescence. DNA damage and p53 activation play a central role in all pathways [20].
kb) in a DNA-protein complex formed by six telomere-specific proteins, called “shelterin” [21] . Telomeres get shorten with every cell division because cellular DNA polymerases are unable to copy the ends of linear DNA. By this perspective, telomeres are often referred as the “cell cycle counter” for the cell [22] . The loss of telomeres were thought to be the signal for senescence induction. Now we know that disruption of telomeric structure induces senescence and shortened telomeres contribute to this process [23]. Chromosomal end-to-end fusions through DNA repair pathways is induced by loss of telomere protection. Also dysfunctional telomeres recruit DNA damage machinery by inducing a double-stranded DNA break response [24].
Oncogene-induced senescence had been identified as a response to expression of Ras oncogene in normal fibroblasts [25]. The expression of oncogenic Ras in primary human or rodent cells results in permanent G1 arrest. The arrest
was accompanied by accumulation of p53 and p16INK4a, and was phenotypically
identical to senescence. In addition to Ras, other oncogenes including Raf, Mos, Mek, Myc and Cyclin E also induce senescence [26]. On the other hand, the loss of PTEN tumor suppressor gene also leads to senescence [27]. Oncogene-induced senescence is also primarily a DNA damage response (Figure 1.4).
Reactive oxygen species (ROS)-induced senescence is the other telomere-independent senescence pathway. Mitochondria are the major intracellular sources of ROS which are mainly generated at the respiratory chain. ROS have been identified as critical mediators of both telomere-dependent and oncogene-induced senescence. Telomere-dependent senescence arrest is accelerated in cells grown
under high O2 conditions. In the opposite, cells have a longer lifespan when
grown under low O2 conditions [28].
DNA damage is one of the common steps in generation of senescence arrest in all pathways of senescence (Figure 1.4). Senescence arrest which is mediated by p53 starts with activation of upstream checkpoint kinases, such as ATM or ATR,
in response to DNA damage in the form of double-strand breaks. These kinases then phosphorylate CHK1 and CHK2 that in turn phosphorylate p53. With the phosphorylation, MDM2 protein is displaced and p53 is activated. p53 activating pathway is critical in both telomere-dependent and oncogene-induced senescence [29, 30].
Other mechanisms of senescence include INK4 locus encoding two inhibitors
of cyclin-dependent kinases. p16INK4a and p15INK4b, and ARF a p53 regulatory
protein [31]. p16INK4a and p15INK4b connect some senescent initiating signals
to the retinoblastoma (Rb) pathway, independent of p53 activation. Cells that
escape senescence often display inactivation of p16INK4a, p15INK4b and ARF either
by homozygous deletion or by shutting-down gene expression.
p21Cip1 is one of the main targets of p53 for the induction of cell cycle arrest
following DNA damage [32]. Pathways that generate DNA damage response and
p53 activation use p21Cip1 as a major mediator of cellular senescence to control
pRb protein [33]. Exceptionally, p21Cip1 can be activated by p53-independent
pathways to induce senescence [34].
Senescent cells cannot enter into S phase and initiate DNA synthesis, hence accumulate at G1 phase of the cell cycle. Retinoblastoma protein (pRb), binds to and inhibits E2F factors which are required for the transition of proliferating cells from G1 to S phase. Cyclin-dependent kinases (CDKs), specifically CDK4/6 and CDK2 phosphorylate pRb, cause it to be released from E2F [31]. The senescence arrest is mediated by inhibition of pRb phosphorylation by CDK4 and CDK2. CDKIs inhibit actions of CDKS and are the major proteins that are involved
in the control of senescence arrest. Well-known CDKIs, p16INK4a and p15INK4b)
number of in vitro studies with hepatocytes, as well as numerous descriptive in vivo studies in liver tissue provide sufficient evidence that hepatocytes can undergo senes-cence type changes.
In vitro senescence in hepatocytes: as stated earlier, limited proliferative capacity of somatic cells is controlled by replicative senescence. The experimental study of repli-cative senescence is done traditionally by serial culture of primary cells. Initially observed in fibroblasts, this phe-nomenon has also been well understood in some epithelial cells, mammary epithelial cells in particular[54]. On the other hand, our knowledge of hepatocyte replicative senes-cence is highly limited. In contrast to in vivo conditions, mature hepatocytes are extremely resistant to cell prolifer-ation in cell culture. Usually, more than 99.9% of adult liver hepatocytes do not divide and can only be maintained in culture for a few weeks at most. A small progenitor-type cell population (so called small hepatocytes) has been shown to proliferate in vitro, but they usually stop growing at passages 5–7, with an ill-defined senescence-like pheno-type[55].
Fetal hepatocytes display better proliferation capacity in culture. A few studies have shown that these fetal cells enter replicative senescence, as shown by senescence-associated b-galactosidase assay (SABG) at population dou-bling (PD) 30–35[55]. This is accompanied by progressive shortening of telomeres down to !6 kbp, as these cells like adult hepatocytes lack telomerase activity. However, it was possible to immortalize these fetal hepatocytes by stable
expression of TERT[55]. Such immortalized cells have been expanded beyond known senescence barriers (>300 PD).
In vivo senescence in liver tissue: in contrast to in vitro studies, in vivo senescence of human hepatocytes is better known. Indeed, the liver is one of the rare tissues where in vivo evidence for senescence has been convincingly and independently demonstrated by different investigators
[6–9]. Replicative senescence (as tested by SABG assay)
displayed a gradual increase from 10% in normal liver, to 84% in cirrhosis ([6,7]. It was also detected in 60% HCCs
[6]. It has also been demonstrated that telomere shorten-ing in cirrhosis is restricted to hepatocytes and this hepa-tocyte-specific shortening was correlated with SABG staining[7].
Potential mechanisms of senescence in hepatocytes and the liver: as presented in detail in the previous section, multiple pathways of senescence have been described in different experimental systems. Key molecules that are al-ready involved in senescence arrest have also been sum-marized. The published data on different senescence pathways in the liver is fragmented and control mecha-nisms involved in hepatocyte senescence are not com-pletely understood. Therefore, existing data on hepatocellular senescence together with potential mecha-nisms that may be involved in this process will be presented.
For reasons previously described, almost nothing is known about molecular mechanisms involved in replica-tive senescence and immortalization of hepatocytes in
cul-Cell cycle arrest & Chromatin remodeling SENESCENCE ARREST SENESCENCE ARREST pRb/E2F pRb/E2F p21cip1 p21cip1 p53 p53 CDK2 CDK2 CDK4/6CDK4/6 p16INK4a/p15INK4b p16INK4a/p15INK4b DNA damage Telomere-dependent senescence Oncogene-induced senescence ROS-induced senescence Other signals
Fig. 2. All known senescence pathways converge at the level of activation of CDKIs (p15INK4b, p16INK4aand p21Cip1) that keep the pRb protein under the
active form. The pRb protein inhibits E2F action and prevents the expression of growth-promoting genes for cell cycle exit. Furthermore, pRb recruits growth-promoting genes into a facultative chromatin structure for permanent silencing and growth arrest.
M. Ozturk et al. / Cancer Letters xxx (2008) xxx–xxx 5
ARTICLE IN PRESS
Figure 1.5: Senescence pathways whether induced by oncogenes or ROS, or through telomere shortening, all converge at the level of activation of CDKIs (p16INK4a, p15INK4b) and p21Cip1. CDKIs keep the Rb protein in the active form.
The Rb protein prevents the expression of growth-promoting genes for cell cycle exit [20].
1.3
Senescence in HCC
Cellular senescence appears to play a major role in liver diseases [2]. Adult hepatocytes, like other somatic cells, are programmed for senescence, a mecha-nism that blocks excessive cell proliferation by a telomere-dependent mechamecha-nism [19, 33, 20]. In contrast to in vivo conditions, mature hepatocytes are resistant to cell proliferation in cell culture. Fetal hepatocytes which have better prolifer-ation capacity in culture, were shown to enter replicative senescence [35]. This
is accompanied by progressive shortening of telomeres down to∼6 kbp, as these
cells like adult hepatocytes lack telomerase activity.
Chronic liver diseases are associated with progressive telomere shortening leading to the cellular senescence that is observed frequently in cirrhosis, but also in some HCCs [10, 36, 37, 38, 39]. Wiemann et al. showed that replicative senescence (as tested by SABG assay) displayed a gradual increase from 10% in normal liver, to 84% in cirrhosis. Telomere lengths were shorter in cirrhosis when compared to noncirrhotic tissues. Also it was shown that telomere shortening was hepatocyte-specific and not observed in lymphocytes and stellate cells [39].
Experimental animal models also provide strong evidence for a critical role of cellular senescence in HCC [40, 41].However, the role of cellular senescence and immortality in human HCC remains elusive.
HCC is characterized by mutational inactivation of p53. By epigenetic
mech-anisms like promoter methylation, well-known CDKIs, p16INK4a, p15INK4b, and
p21Cip1 are often inactivated in this cancer. In the cirrhosis phase, some cells
by-pass senescence barrier and start to proliferate. More than 80% of HCCs display telomerase activity, so those cells are able to continue proliferating. Inactiva-tion of major CDKIs also play a critical role in HCC development by conferring premalignant and malignant cells to proliferate indefinitely (Figure 1.6).
HCCs upon implantation into livers of athymic mice[12]. However, these tumors regressed rapidly upon restoration of p53 expression. Tumor regression was due to differenti-ation and massive senescence induction, followed by im-mune-mediated clearance of senescent cells. These observations may indicate that oncogene-induced senes-cence is also involved in HCC. On the other hand, HCCs in-duced by tet-regulated c-Myc activation in mouse liver cells differentiate into mature hepatocytes and biliary cells or undergo senescence [90]. Thus, senescence induction may also be relevant to oncogene inactivation in HCC. In this regard, c-Myc down-regulation and senescence induc-tion in several HCC cell lines as a response to TGF-b was observed (S. Senturk, M. Ozturk, unpublished data).
So far, all the reported examples of senescence induc-tion in HCC cells are in the form of a telomere-independent permanent cell cycle arrest. Until recently, it was unknown whether replicative senescence could also be induced in immortal cancer cells. Ozturk et al. reported recently that immortal HCC cells can revert spontaneously to a replica-tive senescence phenotype[91]. Immortal HCC cells gener-ated progeny that behaved, in vitro, similar to normal somatic cells. Such senescence-programmed progeny lacked telomerase activity due to TERT repression (proba-bly mediated by SIP1 gene), and displayed progressive telomere shortening in cell culture, resulting in senescence arrest. It will be interesting to test whether such spontane-ous reversal of replicative immortality is involved in well
known tumor dormancy and/or spontaneous tumor regression.
7. Concluding remarks
Cellular senescence has gained great interest in recent years following the demonstration that it also occurs in vivo. It is also highly interesting that senescence can be mediated by a large number of pathways and mole-cules, as is the case for apoptosis. Recent findings that implicate secreted molecules in senescence induction strongly suggest that cellular senescence is not just a cellu-lar event, but also a physiologically relevant process for the whole organism. In terms of tumor biology, oncogene-in-duced senescence that may serve as anti-tumor mecha-nism in pre-neoplastic lesions underlines its clinical relevance. On the other hand, induced or spontaneous senescence that is observed in cancer cells is promising to explore new approaches for tumor prevention and treat-ment. The role of senescence bypass and cellular immortal-ity in hepatocellular carcinogenesis is not well defined. But, many findings (inactivation of senescence-mediator genes such as p53, p16INK4aand p15INK4b, as well as
reacti-vation of TERT) indicate that senescence mechanisms and their aberrations are critically involved in HCC. We may expect that this field will attract more attention in coming years for a better definition of senescence implications in hepatocellular carcinogenesis.
Normal Liver
Normal
Liver hepatitisChronic
Chronic
hepatitis cirrhosisLiver
Liver
cirrhosis Hepatocelularcarcinoma
Hepatocelular carcinoma p53 mutation
p16INK4a& p15INK4bsilencing
TERT derepression CDKI activation
HBV, HCV, Alcohol …
Hepatocyte replication &
Telomere shortening Immortality & Malignancy
Senescence barrier *Inflammation, oxydative stress, necrosis
Chromosomal instability Liver injury*
Fig. 3. Role of cellular senescence and immortalization in hepatocellular carcinogenesis. Chronic liver injury (triggered by major etiological factors HBV, HCV and alcohol) leading to cirrhosis is a common cause of HCC. Hepatocytes having no telomerase activity undergo progressive telomere shortening and DNA damage during this process. Consequently, CDKIs (primarily p16INK4aand p21Cip1) are activated gradually to induce senescence in the preneoplastic cirrhosis stage. Mutation and expression analyses in HCC strongly suggest that neoplastic cells bypass the senescence barrier by inactivating major senescence-inducing genes (p53, p16INK4aand p15INK4b). Moreover, they acquire the ability of unlimited proliferation (immortality) by re-expressing the TERT enzyme. Chromosomal instability that is generated by telomere erosion may contribute to additional mutations necessary for tumor progression. 8 M. Ozturk et al. / Cancer Letters xxx (2008) xxx–xxx
ARTICLE IN PRESS
Figure 1.6: Role of cellular senescence and immortalization in hepatocellular carcinogenesis. HBV, HCV and alcohol are the major causes of HCC, and all lead to hepatitis. Chronic hepatitis is followed by liver cirrhosis for a subset of cases. CDKI activation leads to senescence during cirrhosis. Cells which lack telomerase activity cease to proliferate at this stage. Yet some cells can overcome
the senescence barrier by p16INK4a, p15INK4b silencing and via p53 mutations.
TERT derepression enable cells to proliferate by preventing telomere lengths from shortening.
1.3.1
Reprogramming of replicative senescence in HCC
Our group have reported the replicative senescence induction in hepatocellular carcinoma-derived cells [42]. In that study, hepatocellular carcinoma cells were shown to engage in replicative senescence program independent from p53 and pRb pathways. Yet, this phenomenon was characterized with hTERT repression, telomere shortening, and senescence arrest. Immortal, presenescence and senes-cence programmed clones were obtained from the same parental cell, Huh7. This spontaneous generation of senescence programmed clones were unique in their life span. Although immortal clones had the same replication potential even after 150 population doublings, senescence programmed clones had lost their ability to replicate after 80 population doublings. This finding were of great impor-tance since it demonstrated the reversal of immortality phenotype in a cancerous cell line. What we observed in cancerous cells was replicative senescence, but not a stress-induced premature senescence-like arrest. Senescent clones displayed telomerase repression, progressive telomere shortening, and permanent growth ar-rest with senescence-associated morphological changes and positive SABG stain-ing.
The replicative senescence arrest that we observed in these cells was not
de-pendent on p53, p16INK4a, p14ARF, or p21Cip1 gene. Huh7 cells express a mutant
p53 protein, and they are deficient in p16INK4aexpression [42]. The lack of
induc-tion of these genes indicates that there are addiinduc-tional genes involved in senescence arrest in these tumor derived cells.
1.4
SIP1/ZEB2/ZFHX1B gene and its
relation-ship with HCC and senescence
In the study by Ozturk et al. [42], we analyzed the expression of genes that have been implicated in hTERT regulation. HCC cells have telomerase reactivation,
and this is also a marker for Huh7 cells. Yet in C3 clones. which were derived from Huh7 cells, TERT gene was repressed. This led us to search for genes that can repress TERT expression. In Lin and Elledge paper [43], negative regulators of TERT were identified (Figure 1.7).
Figure 1.7: Regulators of TERT promoter. Repressive proteins are shown in red and activating proteins in green. [43]
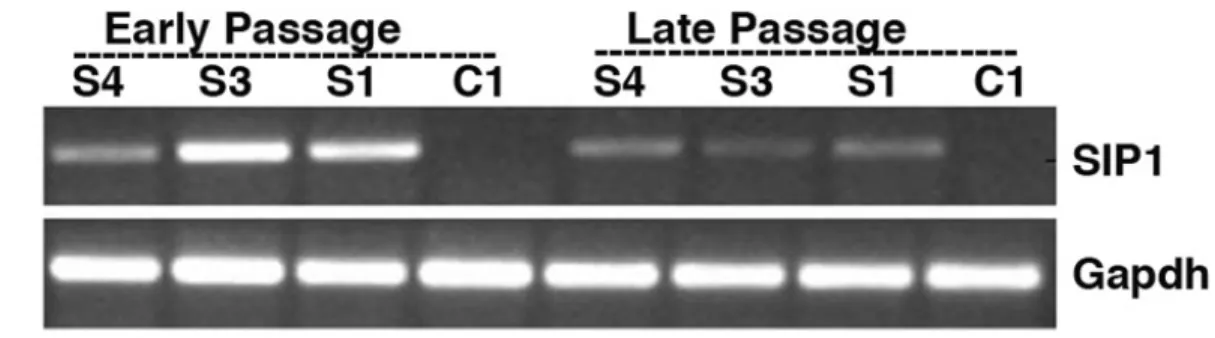
We analyzed seven candidate genes, only one of them, ZEB2, was found to be differentially expressed between senescent and immortal clones. ZEB2 was not expressed in immortal C1 clone, but in senescent C3 clone. Expression of ZEB2 was inversely related with TERT expression. When ZEB2 is depleted through shRNA in C3 cells, these cells rescued from senescence, started to proliferate again as measured by BrdU assay, and also TERT is up-regulated (Figure 1.8).
TERT expression is controlled by a dozen transcriptional regulators, including ZEB2 acting as a repressor [44, 43]. The ZEB2 gene, also called SMAD interacting protein-1 or ZFHX1B, is better known for its role in epithelial-mesenchymal tran-sition (EMT) as a repressor of E-cadherin [45]. Based on this EMT-promoting activity, ZEB2 is considered to positively contribute to tumor progression. Con-versely, the same gene could play an anti-tumor role as a repressor of the TERT gene, encoding a key enzyme required for telomere maintenance and tumor cell immortality[43, 42]. Moreover, ZEB2 could inhibit cell proliferation directly by attenuation of cyclin-D expression [46].
Figure 1.8: ShRNA mediated down-regulation of endogeneous ZEB2 transcripts in senescent cells. A) In senescent C3 cells, shRNA mediated down-regulation leads to the up-regulation of TERT. The increase in TERT expression is sig-nificant even at day 5, and as evidenced by the increase in day 30, it is not temporary. B) BrdU incorporation assay and cell photos of C3 cells are given. ShRNA downregulation of ZEB2 causes cells to start proliferating. C) Colony formation ability of senescent cells are recovered. C3 cells on the left, C3 cells with Sh-ZEB2 are on the right. [42]
The role of ZEB2 in HCC is poorly known. It has been reported to repress E-cadherin expression in HCC cells, leading to increased cell invasiveness [47].
ZEB2 is a member of two-handed zincfinger/homeodomain proteins. In target promoters, it binds to 5’-CACCT sequences [48]. ZEB2 acts as a repressor and two zinc finger clusters are required and must be intact for its activity [49].
ZEB2 is essential for embryonic neural and neural crest development [50] and its mutations cause severe defects in mouse [51] and in humans, namely Hirschsprung disease [52] and Mowat-Wilson disease [53].
E-cadherin down regulation is known to be the critical molecular feature of epithelial-mesenchymal transition [54]. ZEB2 induces EMT by down regulating E-cadherin transcription via direct binding of ZEB2 to E2 boxes at E-cadherin promoter [45, 55] and repressing genes of epithelial cell-cell junctions [56]. Also ZEB2 is mentioned in breast tumor cell migration since it is induced in vimentin positive migratory cells [57]. Other studies have shown that in breast carcinomas and effusions [58] and HCC cell lines [47], suppression of E-cadherin by Snail and ZEB2 is correlated with cancer invasions. These data implicate ZEB2 as a promoter of invasion in malignant epithelial tumors. ZEB2 was identified in yeast-two-hybrid studies as a protein binding to the MH2 domain of Smad1. It was then discovered to bind to activated, receptor regulated Smads [48]. Smad proteins are intracellular mediators of TGF-β signaling [59]. ZEB2 is a transcriptional target of TGF-β pathway and has been implicated in repression of hTERT downstream of a TGF-β signal [43].
1.5
DNA damage repair
DNA damage alter cellular dynamics including biochemical pathways, cellular growth and pathways related to cell cycle. Four pathways are activated in re-sponse to DNA damage. These are DNA repair, transcriptional rere-sponse, DNA
damage checkpoints, and apoptosis 1.9. DNA repair pathways enable the reversal of the damage. This may be the removal of the incorrect base or structure and restoration of the original double helix structure. Damage can be of different kind, but mostly it prevents the DNA replication or causes mistakes in the DNA sequence. It is vital to prevent further DNA replication and this is maintained by DNA damage checkpoints. This type of response prevents cell cycle from con-tinuing so that the damage is not transmitted to daughter cells. Transcriptional response is the changes in transcription according to the needs of the cell after checkpoint activation. If the damage is harmful to the cell and if it disrupts the genomic stability of the cell, then apoptosis is induced [60].
Figure 1.9: DNA damage response reactions in mammalian cells. These four pathways function independently or by a common protein in response to DNA damage. [60]
DNA repair mechanisms include direct repair, base excision repair (BER), nu-cleotide excision repair (NER), double-strand break repair, and cross-link repair. Direct repair utilizes two protein machineries; photolyase and methylguanine
DNA methyltransferase. In BER, a DNA glycosylase recognizes oxidized/reduced bases, alkylated bases, deaminated bases or base mismatches. If there is a bulky DNA lesion, then NER is the repair system. These lesions may be formed by protein addition to DNA, exposure to radiation or by chemicals. Double-strand breaks are formed upon exposure to reactive oxygen species, ionizing radiation or after V(D)J recombinations. Homologous recombination and single-strand annealing are two ways of repairing double-strand breaks. Cross-link repair is utilized when an interstrand DNA cross-link is formed. Chemotherapeutic drugs and bifunctional DNA-damaging agents induce formation of these structures.
Hepatitis B and hepatitis C viruses induce the release of free radicals, which cause inflammation. Free radicals contribute to DNA damage. The p53 pathway is the major player in response to this oxidative stress [61].
1.6
Gene expression profiling
Gene expression profiling utilizes the state-of-the-art technology, microarrays, to reveal all of the expressed genes in a given sample, at a given time point. Each tumor or tissue is unique in its expression profile. By obtaining a small sample from different tumor or tissue even from the same tissue at different time points, it is possible to learn what set of genes are actively transcribed. By gene expres-sion profiling, it is possible to classify tumors into homogenous subtypes that are characterized by distinct molecular pathways that maintain the malignant pheno-type, discover genes associated with other prognosis and/or pathological features of the tumors, and to provide potentially new therapeutic targets and monitor response to therapy. In year 2002, a study had published pioneering the subject [62]. By profiling tumors of young patients, they had identified a signature of poor prognosis consisting of 70 genes. Then, 295 patients with primary breast carcinomas were classified as having a gene-expression signature associated with
either a poor prognosis or a good prognosis [62]. Segal and collegues, defined module-level analysis of a cancer compendium from multiple studies to obtain a global view of shared and unique molecular modules in human cancer [63]. Can-cer module map showed that activation and repression of some modules (e.g. cell cycle) was shared across multiple cancer types and could be related to general tumorigenic processes. In 2004, 406 survival genes were listed to uncover some of the molecular pathways responsible for the differences in subclasses of HCC [64]. These genes enabled the prediction of two distinctive subclasses that are highly associated with the survival of the patients. In this study, it is also found that while dysregulation in proliferation and survival pathways are common to all can-cers, there are other pathways that may be specific for certain types of cancers. Many other studies have followed these works. Ultimate aim for most of these work is to find the signature genes that can discriminate the tumor associated processes.
Microarrays have developed in the last decade, and still in its progression. There are several platforms for microarray experiments and Affymetrix GeneChip Arrays are one of the most frequently utilized systems. GeneChip Human Genome U133 plus 2 Arrays enables to analyze whole genome expression on a single chip. It analyzes the relative expression level of more than 47,000 transcripts corre-sponding to 38,500 well characterized genes. The probe sets were designed from sequences in GenBank, dbEST and RefSeq databases. GeneChip arrays are
man-ufactured via photolithography and combinatorial chemistry 1.
Bioinformatics tools are utilized to analyze microarrays data. In the most conventional way, a microarray data is normalized to equilibrate the signal inten-sities among experiments, so the variation is reduced. Robust multichip average (RMA) is a widely used normalization method. It has three steps: background adjustment, quantile normalization, and summarization. Quantile normalization
makes the distribution of probe intensities for each array in a set of arrays the same [65].
Clustering utilizes statistical algorithms to group genes depending on the similarity in gene expression patterns. Cluster analyzes have to be visualized by other tools, which eventually produce a graphical picture, in which every data is represented on a color scale depending on downregulation or upregulation of individual genes [66].
Chapter 2
OBJECTIVES AND
RATIONALE
Hepatocellular carcinoma (HCC) is one of the most frequent cancers in the world and causing high number of deaths each year. Current therapies are far from ade-quate. Development of new therapeutic strategies depends on better understand-ing the molecular pathogenesis of HCC. Few genes are found to play role in transforming a normal hepatocyte to a cancerous one. It is necessary to identify novel genes involved in HCC to implement new diagnostic and treatment options. Replicative immortality is a common acquired feature of all cancers. Somatic cells have a limited number of cell divisions due to end replication problem at the ends of the chromosomes, namely telom- eric sequences. Replicative senescence is the inevitable consequence of this problem which is also a strong barrier in preventing cancer cell immortality.
In this study, we worked on two major aspects of cellular senescence and im-mortality in HCC. First, we analyzed the role of ZEB2 (Smad-interacting protein SIP1, ZFXH1) gene for a senescence-related role in HCC. ZEB2 gene is actually involved in epithelial-mesenchymal transition, but it also represses telomerase re-verse transcriptase enzyme by directly binding to the promoter of TERT gene.
We observed that when we down-regulate ZEB2 via shRNA in senescent cells, these cells start to proliferate again and retain their immortal properties. We worked on Hep3B cells that overexpress ZEB2 gene, and observed high percent-age of senescent cells among them. BrdU assays also conrmed the low prolifer-ation rate. Further we found that these Hep3B-ZEB2 cells have relatively high expression of p21. We repeated the experiments on another system, tet-regulated overexpression of ZEB2 in A431 cells which we obtained from our collaborators. Also in liver tumors, we checked the ex- pression of ZEB2 and found that ZEB2 is downregulated in liver tumors. We now are able to say that ZEB2 has anti-growth effects in HCC. Then, we extended our work on the identication and analysis of a senescence and immortality gene network (SIGN) in relation to hepatocellular carcinogenesis. We worked on the microarray analysis of liver tumors, obtained from HCC patients with a cirrhosis background. We obtained a list of signature genes that can discriminate tumor from cirrhosis. We were able to compare the gene signatures coming from senescent-immortal clones with the genes coming from cirrhosis-tumor tissues. By this way, we tried to identify the genes that are responsible from the tumorigenesis process in the liver. We also utilized another in-vivo data set to test our signicant genes. We are now able to discriminate the different stages of HCC.
Chapter 3
MATERIALS AND METHODS
3.1
MATERIALS
3.1.1
Cell Culture Solutions
PBS, 10X NaCl, 80 g; KCl, 2 g; KH2PO4, 2.4 g, Na2HPO4, 14.4 g; dissolved in
1 L of ddH2O. pH of the 10X buffer should be around 6.8, when diluted to
1X, pH should be 7.2–7.4.
DMEM-10 medium To 500 ml Dulbecco’s modified Eagle’s medium (Biochrom)
supplemented with 3.7 g/L NaHCO3, 1 g/L D-Glucose and stable
glu-tamine, add 50 ml fetal calf serum (passed through 0.2 µm filter), 5 ml penicillin/streptomycin solution, 5 ml non-essential aminoacids, store at
4◦C, warm to 37◦C prior to use.
RPMI-10 medium To 500 ml RPMI medium (Gibco), add 50 ml fetal calf serum (passed through 0.2 µm filter), 5 ml penicillin/streptomycin solution,
3.1.2
Microbiology Solutions
LB medium Tryptone, 10 g; yeast extract, 5 g; NaCl, 5 g; add 1 L ddH2O and
autoclave immediately after preparation.
Agar medium Add 10% (w/v) bacto agar to LB medium, autoclave, pour onto plates and wait at room temperature until agar solidifies.
3.1.3
Western Blot Solutions
Protein lysis buffer Tris 1M, pH 8.0, 50 µL; NaCl, 2M, 125 µL; 25X proteinase
inhibitor coctail, 40 µL; NP40, 10 µL; filtered ddH2O, 775 µL.
RIPA lysis buffer Tris 1M, pH 8.0, 50 µL; NaCl, 2M, 300 µL; 25X proteinase
inhibitor coctail, 40 µL; NP40, 10 µL; 10% SDS, 10 µL; filtered ddH2O,
775 µL.
10% (w/v) SDS Wear mask, SDS is irritative to respiratory tract. Dissolve
10 g lauryl sulfate in 90 ml ddH2O with stirring, then bring to 100 ml final
volume.
Transfer Buffer, 1X Glycine, 2.25 g; Tris base, 5.81 g; SDS (from 10% SDS
solution), 3.7 ml; methanol, 200 ml; to final volume of 1 L with ddH2O.
Transfer buffer should be prepared freshly for each experiment.
Running Buffer, 5X Tris base, 15.1 g; glycine, 95 g; SDS (from 10% SDS
solution), 50 ml; bring to 1 L with ddH2O. Store at 4◦C and do not adjust
pH. pH should be around 8.3 for the 1X solution. When diluted to 1X, water should be added first in order to prevent excess bubbling.
Wet transfer buffer, 1X Tris base, 6 g; glycine, 28.8 g; SDS (from 10% SDS
TBS, 10X Trisma base, 12.19 g; NaCl, 87 g; bring to 1 L with ddH2O, adjust
to pH 8.0 with 1N HCl.
Gel staining solution Coomassie brilliant blue G.250, 100 mg; absolute ethanol, 50 ml; phosphoric acid (85%), 100 ml; bring to final volume of 1 L with
ddH2O. Filter the solution through Whatman paper, store at 4◦C.
Gel de-stain solution In ddH2O, add 20% methanol and 7% acetic acid.
30% acrylamide Wear mask, dissolve 146 g acrylamide and 4 g
N’-N’-bis-methylene acrylamide in 500 ml ddH2O. Filter for 20 min, store at dark
and 4◦C.
APS, 10% (w/v) Dissolve 0.1 g ammonium persulfate in 1 ml ddH2O.
Gel loading buffer, 2X ddH2O, 3.55 ml; 0.5 M Tris HCl, pH 6.8, 1.25 ml;
glycerol, 2.5 ml; 10% (w/v) SDS, 2 ml; 0.5% (w/v) Bromophenol blue, 0.2 ml. Store at room temperature. Add 5% β-mercaptoethanol to buffer prior to use.
1.5 M Tris-HCl, pH 8.8 Tris base, 27.23 g; ddH2O, 80 ml. Adjust pH with
6N HCl. Bring total volume to 150 ml with ddH2O. Store at 4◦C.
0.5 M Tris-HCl, pH 6.8 Tris base, 6 g; ddH2O, 60 ml. Adjust pH with 6N
HCl. Bring total volume to 100 ml with ddH2O. Store at 4◦C.
Gel formulations (10 ml) Mix 30% acrylamide, tris buffer and SDS according to the gel percentage as described in the Table 3.1. For resolving gel, 1.5 M Tris-HCl, pH 8.8; for stacking gel, 0.5 M Tris-HCl, pH 6.8 Immediately prior to pouring the gel, add 50 µL 10% APS and 5 µL TEMED for the resolving gel; add 50 µL 10% APS and 10 µL TEMED for the stacking gel; swirl gently to initiate polymerization.
Table 3.1: SDS-PAGE Gel Formulations
Percent gel ddH2O 30% acrylamide Tris buffer 10% SDS
(ml) (ml) (ml) (ml) 5% 5.7 1.7 2.5 0.1 8% 4.7 2.7 2.5 0.1 10% 4.1 3.3 2.5 0.1 12% 3.4 4.0 2.5 0.1 15% 2.4 5.0 2.5 0.1
Stripping solution 10% (w/v) SDS, 10 ml; 1 M Tris-HCl, pH 6.8, 3.125 ml; β-mercaptoethanol, 357 µL; to final volume of 50 ml with ddH2O.
3.1.4
Agarose gel solutions
Etidium bromide Wear mask and gloves, dissolve 0.2 g in 20 ml ddH2O. Store
at dark and 4◦C.
TAE, 50X Tris base, 242 g; Tritiplex III (EDTA), 37.2 g; glacial acetic acid,
57.1 ml; bring to 1 L with ddH2O, stir over night to dissolve.
Agarose gel, 2% Weigh 2 g of agarose powder and add to 100 ml TAE buffer. Boil and cool down, add 1 µg/µL etidium bromide, swirl and pour onto gel casting apparatus.
3.1.5
SABG solutions
SABG buffer Mix 200 mM citric acid, 600 µL; Na-P buffer, 600 µL; 100 mM K ferrocyanide, 150 µL; 100 mM K ferricyanide, 150 µL; 2 M NaCl, 225 µL;
100 mM MgCl2, 60 µL; 40 mg/ml X-gal solution, 75 µL; ddH2O, 1140 µL.
Adjust pH to 6.0 with NaH2PO4. Pass through 0.2 µm cellulose acetate
filter, keep away from light and prepare freshly just before the experiment.
Na2HPO4, 1M dissolve 7.12 g di-sodium hydrogen phosphate di-hydrate in 40
ml ddH2O, heat to 40◦C in a water bath to prevent precipitation, store at
4◦C.
X-gal, 40 mg/ml dissolve 0.2 g in 5 ml dimethyl formamide, store at -20◦C, in
dark.
K ferricyanide, 100 mM Dissolve 0.658 g potassium ferricyanide in 20 ml
ddH2O, store at 4◦C, in dark.
K ferrocyanide, 100 mM Dissolve 0.844 g potassium ferrocyanide in 20 ml
ddH2O, store at 4◦C, in dark.
MgCl2, 100 mM Dissolve 0.406 g magnesium chloride in 20 ml ddH2O, store
at 4◦C.
NaCl, 2M Dissolve 2.34 g natrium chloride in 20 ml ddH2O.
Citric acid, 200 mM Dissolve 2.85 g trisodium citrate in 40 ml ddH2O, adjust
pH to 6.0 with HCl.
Na-P buffer Mix 10.20 ml Na2HPO4, 1M and 29.80 ml NaH2PO4, 1M, adjust
pH to 6.0 with NaH2PO4, 1M.
3% formaldehyde Mix 3 ml of 37% formaldehyde and 36 ml ddH2O. Prepare
freshly before the experiment.
3.1.6
Microarray reagents
All reagents used for the microarray experiments were purchased from Affymetrix. GeneChip Human Genome U133 Plus 2 (HG-U133 Plus 2.0, Affymetrix, P/N 900467), One-Cycle cDNA synthesis kit (Affymetrix, P/N 900431), IVT labeling kit (Affymetrix, P/N 900449), Poly-A exogenous positive controls (Affymetrix, P/N 900443) were utilized.
3.2
METHODS
3.2.1
Tissues
Surgically resected tissues were snap frozen in liquid nitrogen and stored at
-80◦C. The use of human material for research has been pre-approved by Ankara
University Ethical Committee. For the tumor samples, tissues were resected inside the tumor. For the nontumor samples, tissues were resected from the ad-jacent tissue surrounding the tumor. The use of human material for research has been pre-approved by the Ankara University and Dokuz Eylul University Ethical Committees, and the written consent was obtained for each patient. Histology slides were prepared for all samples and scored by an experienced pathologist. Histology slides were prepared for all samples and analyzed by an experimented
pathologist Dr. ¨Onder Bozdoˆgan.
3.2.2
Cell lines
HCC cell lines, Hep3B and Huh7, HepG2, Hep40, Hep3B, PLC/PRF/5, Snu182, Snu387, Snu398, Snu423, Snu449, Snu475, Focus, Mahlavu, and SKHep1, squa-mous epidermoid cell line A431 cells were used. HCC cell lines were grown in DMEM-10 or RPMI-10 (for Snu cell lines only) media. Hep3B clones that stably express ZEB2, Hep3B-S1, -S3, and -S4 were cultivated in DMEM-10 medium. For time intervals, medium was supplemented with 200 µg/ml geneticin 418 (neomycin) for the maintanence of stable expression of ZEB2. Huh7 clones, C1, C3, g12, and g11 that harbor empty pcDNA3 vector were cultivated like Hep3B clones. For all Huh7 and Hep3B, for each subculturing, passage numbers were recorded.
A431 cells were stably transfected with dox-on plasmid system that expresses ZEB2 with the addition of doxycycline. Culture medium for A431/ZEB2 cells was supplemented with 60 µg/ml hygromycin B (Roche) and 0.5 µg/ml puromycin
(Sigma). For ZEB2 induction, cells were plated at low density (1500-2500 cells/well in 6-well plates). Plating day was designated as day -2. At day 0, culture medium was replaced with fresh culture medium supplemented with 2 µg/ml Dox (Doxy-cycline, Sigma). Medium was changed every 3 days with the fresh medium sup-plemented with Dox. A431/ZEB2 cells were a gift from Eugene Tulchinsky from Leicester University, details about these clones can be found in Mejlvang et al. [46].
Huh7 and Hep3B clones were generated by Nuri ¨Ozt¨urk, former member of
our group, and details were described in Ph.D. thesis of the researcher [67]. For all cells, medium was replaced in every 3 days, and cells were subcultured to new flasks or plates when confluency was over 80%. Cryopreservation was performed as follows: cells were trypsinized and pelleted. Cell pellets were suspended in growth medium supplemented with 8% DMSO and placed in a cryotube. Tubes
were placed immediately to -20◦C for 1 hour, then -80◦C overnight, and then
stored in liquid nitrogen for long term storage.
3.2.3
RNA isolation
Immortal, presenescent and senescent cells (described above) were plated in trip-licate and subjected to RNA extraction. Frozen tissue samples were cut into 20 µm thick slices, and scraped into microtubes for RNA extraction. Two 6 µm slices were also cut for pathological examination of tissues to be used for RNA extraction. Both cells and tissues were homogenized using a 0.8 mm needle before processing the sample. Total RNA isolation kit (Promega, Madison, USA) and NucleoSpin RNA II Kit (MN Macherey-Nagel) were used for RNA extraction for the cell lines and for the tissues, respectively. DNAse digestion was performed according to the kit protocol. RNA concentrations were determined by Nan-oDrop spectrophotometer (NanNan-oDrop, USA). All but two tissue RNA samples were analyzed using Agilent Bioanalyzer, and two with integrity number < 4.0
were discarded from the study. Two tissue samples without Agilent data have been evaluated according to the quality of microarray data (Table 4.3). Cell line RNA quality was evaluated by the ratio of 18S to 28S RNAs by Agilent Bioanalyzer; all samples passed this quality control test (data not shown).
3.2.4
cDNA preparations
cDNAs were synthesized from DNase I-treated RNA using RevertAid First Strand cDNA synthesis kit (MBI Fermentas). 1-4 µg of RNA was used for cDNA
syn-thesis. RNAs were first heated to 70◦C for 5 min, together with oligo dT primer,
then incubated at 37◦C for 5 min, in a mixture containing buffer, dNTP and
RNase inhibitor, and finally incubated at 42◦C for 1 h followed by 70◦C for 10
min for the synthesis of first strand cDNA by using reverse transcriptase enzyme. All reagents were supplied by the kit.
3.2.5
Semi-quantitative RT-PCR
cDNAs were used as templates for PCR. Primers were designed using Primer3
program1. The main criteria was to skip an intron to prevent amplifications
from genomic DNA. All primers were designed to amplify transcripts spanning two adjacent exons with an intronic sequence in the genome. The primer list is given in Table 3.2. PCR amplifications were performed in 25 µL of volume.
1X PCR buffer supplemented with (NH4)2SO4, 1.5 mM MgCl2, 200 µM dNTP,
10 pmoles of each primer, and 1 U of Taq DNA polymerase were mixed in the
presence of ddH2O. All PCR reagents were purchased from Fermentas. Thermal
cycler conditions were as follows: an initial denaturation of 94◦C for 5 min,
followed by cycles of 94◦C, 30 sec; annealing temperature, 30 sec; 72◦C, 30 sec.
A final extension of 72◦C, 10 min was performed. Number of cycles were differed
for each primer set (Table 3.2). TC-512, Techne or TechGene, Techne thermal 1http://fokker.wi.mit.edu/primer3/input.htm
Table 3.2: Primer List
Gene Sequence (5’ to 3’) Annealing
temperature hTERT–F CGGAAGAGTGTCTGGAGCAA 58◦C hTERT–R GGATGAAGCGGAGTCTGGA 58◦C hZEB2–F ATGGCTGTGTCACTGCGCTGA 60◦C hZEB2–R GGAAGACAAGCTTCATATTGC 60◦C mZEB2–F GGCTTACCTGCAGAGCATC 60◦C mZEB2–R CCTCTGAACTGTCGTCCATC 60◦C E-Cadherin–F TCCCATCAGCTGCCCAGAAA 60◦C E-Cadherin–R TGACTCCTGTGTTCCTGTTA 60◦C β-Actin–F GAAATGGTGCGTGACATTAAG 60◦C β-Actin–R CTAGAAGCATTTGCGGTGGA 60◦C GAPDH–F GGCTGAGAACGGGAAGCTTGTCAT 60◦C GAPDH–R CAGCCTTCTCCATGGTGGTGAAGA 60◦C
cyclers were used for PCR reactions. GAPDH was used as an internal control for PCR reactions.
PCR products were analyzed on a 2% (w/v) agarose gel prepared with TAE buffer and stained with 1 µg/ml ethidium bromide and visualized under UV transillumination using Gel-Doc 2000, Bio-Rad or ChemiCapt, Vilber Lourmat visualization systems.
3.2.6
Quantitative real-time RT-PCR
The iCycler iQ PCR machine (Bio-Rad) was used. Reactions were performed in
20 µL volume consisting 2X Master Mix (Finnzymes), primers and ddH2O.
Reac-tion condiReac-tions were as follows: 94◦C, 5 min for initial denaturation; 45 cycles of
the loop 95◦C, 30 sec; 60◦C, 30 sec; 72◦C, 30 sec. Data collection is enabled after
this reaction. All reactions were followed by melting curve analysis: 94◦C, 30 sec
for initial denaturation, 60◦C, 30 sec; 80 cycles starting with 60◦C, 15 sec and
then increase set point temperature after cycle 2 by 0.5◦C. Melt curve data