Faculty of Science, Department of Chemistry, Bilkent University, 06800 Ankara, Turkey
*
S Supporting InformationABSTRACT: The dynamics of the electrochemical double
layer in ionic liquids can be experimentally probed by a number of experimental techniques. Earlier, we reported on the results of an X-ray photoelectron spectroscopic inves-tigation under applied square-wave bias of two distinct frequencies. Our studies had revealed counterintuitive proper-ties involving the physical and temporal progression of the effect of the electrochemical double layer that could not be modeled with conventional equivalent-circuit approaches. Herein, we present a new coarse-grained modeling method-ology that accounts for particle diffusion, migration, and ion-association equilibrium. Our model is computationally efficient enough to be used to predict and match the results
at extended time scales and distances of the experiment. Modeling efforts predict that a crucial component of the behavior is controlled by the ion-pairing equilibrium, an often overlooked aspect of ionic liquids.
■
INTRODUCTIONIonic liquids attract attention as green and safe alternatives to conventional electrolytes owing to their low vapor pressures and thermal stability. Historically, ionic liquids were in the focus of researchers working on sensors and material synthesis.1 Because they provide a way to eliminate the need for solvent use, the synthesis or the sensing proceeds with less waste and can be achieved under pressures and temperatures that the traditional solvents would not be stable in.
Aside from applications in material synthesis and sensors, they also attract interest from the energy-storage and conversion community as the choice of electrolyte for both conventional fuel cells/batteries and the next-generation devices.2 In particular, their nonvolatility allows devices to meet strict safety criteria. In the so-called “beyond Li-ion batteries”, a common problem is the stability of the active materials where the regularly used carbonate-based organic solvents decompose rapidly by the highly active electrode materials. For instance, in Li−O2and Li−S chemistries, these
common electrolytes cannot be employed.2 Ionic liquid
electrolytes constitute an interesting alternative where the ionic behavior of the electrolyte can be tuned depending on the structure of the ion pairs utilized, thus allowing them to be tailored as electrolytes for specific applications. Studies to tailor ionic liquid electrolytes for specific energy-storage systems
have been recently reviewed.2 Although device safety is
improved by utilizing tailored ionic liquids, most of these studies, especially for the current commercial technologies (such as Li-ion batteries), show that device performance is
hindered. For instance, Li-ion batteries with tailored ionic liquid electrolytes either show poor cycling capabilities3 or only show good cycling stability at low C rates (such as 0.05 Ca).4Thus, fundamental understanding on the response of the ionic liquid and processes that govern this response, aside from the choice of ionic liquid, should be examined. To lay a solid foundation for investigations toward the faradic processes,
which are inherently different compared to their dilute
electrolyte counterparts, a better understanding on the non-faradic processes, namely double-layer formation and its kinetics, needs to be developed.
Both experimental and theoretical studies attract attention in the literature, where the low volatility of ionic liquids allows vacuum techniques to be utilized, whereas on the theory side,
mean field models are employed. Experimentally, X-ray
photoelectron spectroscopy (XPS) has been utilized to follow the response of ionic liquids5−9and characterize ion screening effects at significantly extended distances,6whereas mean-field models were developed to explain ion movement only on or around the short ionic liquid−electrode interface.10−13 Although meanfield approaches can capture details regarding the electrode−ionic liquid interface under bias, such as the ordering of the charges,11,12,14,15 they cannot capture the experimentally available behavior of the ionic liquid at extended time and length scales. Comparing these length
Received: December 4, 2018
Revised: February 5, 2019
and time scales that are explained by the meanfield models to the experimentally available length and time scales, we see a clear mismatch6,16,17and highlight the need for new modelling methodologies to bridge this gap.
Electrolyte models historically take one of the two routes. Thefirst group employs theories of the electrochemical double layer18 and dilute electrolyte19 to extrapolate to higher concentrations at times with small corrections to account for
ion−ion and ion−solvent interactions (akin to deductive
reasoning). The second group, on the other hand, starts from pure ionic liquids and extrapolates to lower concentrations
(akin to inductive reasoning).20 Either approach employs
ensemble averages to predict measurable quantities to match with experiments and have mostly been interested in equilibrium properties.
Because these methods and theories explained above are computationally expensive, it is not possible to extend them to the experimentally relevant length and time scales. Because of the X-ray spot-size of a conventional/laboratory XPS, it is not possible to push the resolution down to the length scales explained by these approaches. However, a common theme in the experimental literature is the presence of both temporal6 and spatial6,16,17 long-range ion rearrangements in ionic liquids, increasing the relevance of application of conventional XPS analyses. To bridge this gap in length scales and also to be able to dynamically model the response of an ionic liquid across multiple time scales (the frequency range spanning 5 orders of magnitude), a much simpler coarse-grained electro-static model is described in this article.
Even though ionic liquids are entirely based on ions, reports show that a significant fraction of ions exists in an equilibrium with their ion pairs.21Measurements indicate that ion pairing is significant depending on the structure of the ion and can get up to 10%. Further, an often overlooked aspect of ion pairing is the fact that the event is dynamic, that is, the ion pairs can form and break as the system equilibrates in response to a perturbation. An instance of ion pairing being recognized as an important aspect of the ionic liquid behavior under bias by the mean-field theories is predicted by the work of Kornyshev et al.;22 however, the mean-field approach employed does not lend itself for the treatment of the problem at experimentally relevant length and time scales.
In the current article, a new modeling approach will be presented that enables the modeling and rationalization of XPS data collected under applied electrical bias of various forms. As we have recently published, ionic liquids under external bias show distinct frequency-dependent voltage profiles, as
measured by shifts in binding energy under XPS.6 The
electrostatic model, along with these experimental results, is used to interrogate ion rearrangements in ionic liquids under square-wave (SQW) bias. Throughout the XPS experiment, varying the electrical bias allows us to shed light on the charging processes on the liquid surface of the material under
study. As our recent publications show,6 choosing SQW
excitation allows for clear identification of the response because the data collected are effectively a time average of the surface throughout the collection time scale. Periods of constant applied potential keep the distortion of the line shapes to a minimum which aid in understanding the effects of potential.
The coarse-grained electrostatic model explains the frequency dependence of the observed voltage profiles for different device geometries while allowing the number of ions
to be explicitly followed at specific positions along the
simulated ionic liquid. An otherwise ignored aspect of ion rearrangements, association equilibrium, is shown to signi fi-cantly contribute to the observed voltage profiles and is
explicitly handled in the model. Moreover, the effect of
electrode geometry on the ion transport and hence the response of the ionic liquid can be explained via the coarse-grained electrostatic model.
■
EXPERIMENTAL SECTIONFor the experimental XPS data we simulated, two different
device configurations were used, see Figure 1a,b. In the first configuration, two gold electrodes were sputtered on a glass substrate using a plasma sputter-coating under 0.15 mbar and 25 mA discharge current for 60 s. Ionic liquid (5μL), diethyl m e t h y l ( 2 - m e t h o x y e t h y l ) a m m o n i u m b i s
-(trifluoromethanesulfonyl)imide (DEME-TFSI), was injected
to the substrate between the gold electrodes. The purity of the ionic liquid is confirmed by XPS (Figure S1). One of the gold electrodes was used as a source to apply the external bias, whereas the other one was grounded.
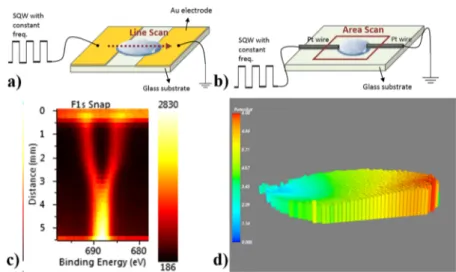
Figure 1. Schematic representation of the fabricated device with the planar Au electrodes (a) and F 1s line scan measured (c). Schematic representation of the fabricated device with the Pt point contacts (b) and area map of binding energy difference between the positive and negative components of F 1s (d).
these species were not observed during or after the experiment. Ensuring that the response is within the double-layer region, small shifts in reference potential does not influence the overall response measured.
F 1s peak region (coming from the ionic liquid) was recorded in the snapshot mode with 1 s time intervals in the line-scan mode to obtain position-dependent information from the source to the drain electrodes, as shown inFigure 1c. For the other configuration, we used Pt wire as point contacts and
injected 5μL of DEME-TFSI in between. We collected F 1s
peaks again in the snapshot mode of the instrument with 50 μm X-ray spot and a step size from the selected area which contains the entire ionic liquid surface. InFigure 1d, we display areal maps of the binding energy difference of positive and
negative components of F 1s under the applied 8 Vp−pSQW
bias (see the discussion in theSupporting Information titled “Peak Fitting and Binding Energy Difference” for detailed description of data analysis to obtain the areal map shown in
Figure 1d). Detailed XPS data with and/or without SQW excitation are given in the Supporting Information section (Figures S1−S4).
With planar contacts, the ionic liquid creeps and wets the electrode surface such that the observed voltage profile over the electrode surface has distinct shielding behavior compared to the ionic liquid between the electrodes. These different device geometries allow us to probe the effect of electrode geometry on the response of the ionic liquid both in the area between the electrodes and vertically above the electrodes.
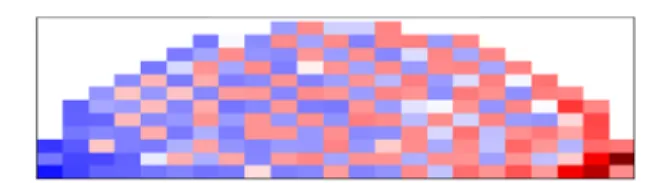
Modeling Considerations. The ionic liquid drop is dissected into rectangular grids containing charged (positive and negative) and neutral (ion pairs) particles, as shown in
Figure 2. Each grid is structured such that it contains an array
of four values; the number of positive, negative, and pair particles and the voltage of the given grid. A semicircle is chosen as the modeled geometry. Owing to the angular symmetry, projection into higher dimensions or a full circle is also possible; yet, it unnecessarily would increase simulation runtimes.
Voltage Assignment. The voltage of each grid is assigned initially by assuming a linear drop with position much similar to a resistor, as shown ineq 17(also seeFigure S3). Following
# of particles as unit), k = proportionality constant.
Electric Field Definition. This potential because of excess charges is added to the initial voltage assigned. Once the potential of each grid is calculated, an electricfield is formed based on voltage differences between neighboring grids (eq 3).
E V V r ij j i ji = − (3) where i and j are neighboring grids, Vj= voltage of the grid j, Vi = voltage of the grid i, rij= distance between grids i and j, Eij= electricfield formed between grid i and j.
Charge Movement. The formed electric field causes the
charges to migrate between grids based on a simple definition of charge mobility. Particle diffusion is handled by generating uniform random numbers that cycle through possible neighboring grids. To handle the effects of convection because of variances in local density, the amount of particles that each grid can hold is limited by a threshold. For a given grid, if through migration and diffusion, this threshold is exceeded, the excess particles are moved away toward its neighbors. If the neighbors exceed the particle threshold, then those particles are again moved further away from the concentrated region until all grids satisfy the given threshold.
Association Equilibrium. In the end, the following association equilibrium is maintained for each grid by solving the quadratic equilibrium equation.
positive+ negative↔pair
K n n n pair neg pos = · (4)
where n = number of particles.
Definition of Time Scale. The above-mentioned actions
are repeated for each time step. The time scale between each time step is determined by the frequency ( f) of the simulation and the number of time steps to simulate (in this article, for uniformity, 100 time steps for each applied potential is chosen for all frequencies). A particle moving from a grid to its neighbor has a certain speed (v) determined by the length of the individual simulation boxes (dsim) and the implicit time scale of the simulation (tsim), as shown in (eq 7). For an ion of given mobility (μ), the movement from a box to its neighbor is only possible if a threshold electricalfield (Ethreshold), as defined in (eq 8), is exceeded. If the pairwise electricfield between the given neighbors [Eji as defined by (eq 3)] is larger than this electric field threshold (Ethreshold), the appropriate charge moves from the grid“i” to grid “j”.
d d with units cm of grids sim grid = # # (5)
Figure 2. Depiction of the dissected ionic liquid drop in terms of rectangular grids. The color scale indicates amount of excess charges (red: positive excess, blue: negative excess).
t f s 1 with units of time steps sim step = × # # (6) v d t with units cm of time steps of grids s sim sim = × # # × (7)
E v with units of time steps of grids V cm threshold μ = # # × (8)
Simulations are run such that in a given time step, particles can only migrate from one grid to its neighbor; thus, the ratio
of time steps of grids #
# is unity. This requires that the overall length of the simulated time also varies with frequency. In steady state, this does not create any complications. In this article, we refrain from reporting absolute frequencies for the modelling results. The accuracy required for the parameters involved in the model outweigh the number of truly accurate parameters reported in the literature, such that the modelling frequency can be made to match the experimental frequency through a number of adjustments. The modelling results shown in this article were run with a set of parameters that is made as close as possible to the experimental parameters. However, because of the variability, the frequencies are reported as multiples of a fundamental“f ”.
Simulation Data. For all time steps, the above considerations are repeated and the resulting voltages can be visualized as a voltage−time trace for any given grid in the simulation. The collections of these voltage−time traces for all boxes can then be further processed to other physical observables (derived from XPS measurements) such as the probability density or the mean voltage across the surface of the semicircle during a potential step. Accordingly, the probability density three-dimensional (3D) histograms are plotted by binning the V versus t trace of all surface grids and then by stacking them as a function of horizontal distance. The mean voltages can be obtained by subtracting the voltages simulated when positive potentials are applied by the voltages simulated when negative potentials are applied. The resultant values can be visualized as a 3D bar chart with the z-axis as the voltage amplitude simulated.
In terms of robustness, the modelling considerations outlined in this article can be employed without stability
issues for a wide range of parameters with the benefit of
numerical simplicity.
The simulations and the data processing were all carried out in Python 2.7.10.0 using a Python(x,y) shell with Numpy
(version 1.14.5),24,25 Scipy (version 1.1.0),26 Matplotlib (version 1.4.3),27 and Mayavi (version 4.4.2)28 open-source packages.
Data Visualization. Recording binding energies while applying bias, during an XPS experiment on ionic liquids, constitutes a vast dataset, especially when obtained in a time-resolved fashion. To tackle the problem, data visualization can be achieved either by taking line scans over the ionic liquid surface (Figure 1c) or by mapping a specific region of binding energy over the ionic liquid surface and following the shift with respect to the unbiased signal (Figure 1d) (please see the
Supporting Information section for details). In a previous article, we reported on millimeter-range potential distributions in an ionic liquid medium, as measured by XPS.6Briefly, under a constant applied potential (such as 4 V), two symmetrical electrochemical double layers form at the electrode−ionic liquid interfaces and half of the applied potential is reflected as a shift in the F 1s binding energy of the ionic liquid. This shift in F 1s binding energy directly reports the potential on the ionic liquid in a temporally and spatially resolved manner (for a full discussion on this binding energy shift and details of its
quantification, the reader is encouraged to follow the
discussion in the Supporting Information and ref 6). If an alternating voltage (such as an SQW or a triangular wave) is applied, because of the time scale of a single scan, both the minimum and the maximum of the applied voltages are reflected as a voltage response at the same time (see Figure S2). In a scan under the SQW excitation, this is directly seen as two distinct lines (Figure 1c).
Correlating the simulated data to these observables (Figure 1c,d) can be achieved either by generating histograms of the modeled voltage response and then stacking them with respect to position (Figure 3a) or by looking at the mean differences in
positive and negative cycles of a simulated SQW and plotting them as a function of distance (Figure 3b).
■
RESULTS AND DISCUSSIONIn our earlier report,6we have shown the overall change in the F 1s binding energy of ionic liquid embedded on a porous polyethylene membrane when the frequency of the SQW excitation was either very low (10 mHz) or very high (1 kHz) in a device configuration with large planar Au contacts. In this article, we are focusing on an ionic liquid drop directly on a glass substrate. The porous membrane absorbs the ionic liquid fully, whereas the ionic liquid is freely flowing on the glass substrate. Directly utilizing the ionic liquid drops in different electrode geometries allows for elucidation of both the effect of Figure 3.Simulated voltage response of the ionic liquid, the obtained voltage profile is visualized (a) as histograms (b) as a surface plot of mean potential difference in the positive and negative cycles (the color bar and the height represents the voltage of the particular point).
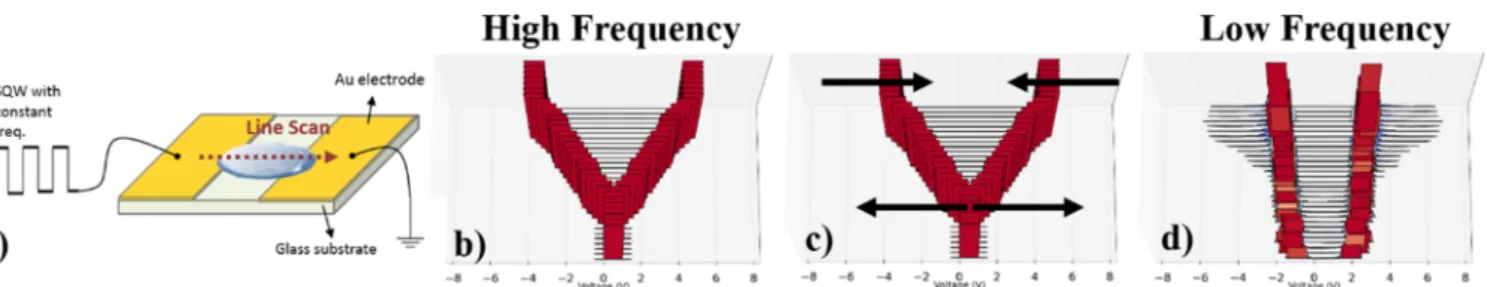
device geometry and the environment of the ionic liquid itself. In the current article, we are also reporting transition frequenciesb, whereas XPS data are collected through a line scan for a pristine ionic liquid drop, as illustrated inFigure 4a. Starting from a high-frequency SQW where the ionic liquid does not show any voltage screening (Figure 4b), the voltage progressively shifts as marked by the arrows inFigure 4c and equilibrates at the half of the applied potential at low frequencies (Figure 4d). A similar device geometry with Pt point contacts, as illustrated inFigure 5a, however, under an area scan of the F 1s region, results in a similar frequency-dependent behavior. At high frequencies, the voltage applied drops linearly across the ionic liquid (Figure 5b), whereas as the frequency is lowered, the voltage is screened properly and at low-enough frequencies (in the order of 1 Hz), the voltage equilibrates at half of the applied potential (Figure 5d). The difference between the applied and the measured potentials for both of these cases is due to the potential lost at various interfaces. Around the vicinity of the electrode as a response to
the applied potential, charge rearrangement occurs and an electrochemical double layer forms. Noting that there are two symmetrical contacts, one at the source electrode side and one at the grounded electrode side, equal amounts of potential is screened across the two double layers, and therefore at the steady state, exactly half of the applied potential is seen as the major binding energy shift throughout the surface of the ionic liquid. Near the source and grounded electrodes, simple equivalent circuit models involving RC circuits can explain the voltage evolution over time and frequency, as previously published for ionic liquids,6 and similarly to earlier reports on SiO2 samples to extract the parameters of the equivalent circuit29 and to investigate the effects of surface charging at various surface heterogeneities.30Such models, however, fail to capture the spatial dependence of the voltage. Equivalent circuit models with the given time constant cannot explain the various position-dependent voltage traces obtained away from the electrode because a regular capacitor does not have a spatial component. The equivalent circuitfits, however, in their Figure 5.Under an area scan (a), the voltage response of an ionic liquid at the two extreme frequency cases [high frequency (b) and low frequency (d)] visualized via the mean differences in the positive and negative binding energy changes with respect to the unbiased F 1s signal (b−d). The general change in voltage response as a function of the frequency is shown with arrows (c).
Figure 6.Response of the ionic liquid to an 8 Vp−pSQW at varying frequencies (a) measured by XPS for a device with two planar Au contacts, (b) simulated by the coarse-grained electrostatic model for an elevated planar contact (shaded regions show the electrode contact).
region of relevance show that electrostatic models can be effective in explaining the voltage-screening behavior in these systems. Thus, the only issue that needs to be tackled in adequately modelling these systems, in the time scales and length scales relevant to the experimental results, is the addition of spatial arguments to the electrostatic model supplied by the equivalent circuitfits which we have achieved through the above-explained modelling considerations.
Experimental Agreement. XPS data from two different device configurations were simulated (seeFigures 4a and5a). In thefirst configuration, gold electrodes were sputtered on a glass substrate, and the ionic liquid was injected in between these large planar electrodes. One of the gold electrodes were used as the source electrode to apply the external bias whereas the other one was grounded. Whereas under 8 Vp−pSQW bias, the F 1s peak region was recorded in the line scan mode to obtain position-dependent information from source to drain
electrodes, as shown in Figure 6a. In the second device
configuration, instead of the large planar Au electrodes, Pt wires were used as point contacts. Again the F 1s peak region was recorded, however, in a mapping mode (Figure 7a). The
entire area containing the ionic liquid surface was mapped.
Figure 7a displays areal maps of the binding energy difference of positive and negative components of the F 1s peaks. The most relevant electrical information sought after are the ionic liquid medium’s switching between the resistive and shielded behavior and the critical frequency at which this transition occurs, both of which can faithfully be modeled for the two device geometries with the coarse-grained electrostatic model, as shown inFigures 6and7.
Experimentally, the difference in device construction is reflected as a region where the voltage response is narrower compared to the rest of the ionic liquid for the device with large planar electrodes (seeFigure 6a). This difference can be captured by considering the changes to the geometry of the ionic liquid. The ionic liquid does not behave as a perfect semicircle on the planar electrode, but it rather moves and wets the surface.31,32The exact shape of this spread is not entirely
known. Its effects, however, can be incorporated into the
model by considering elevated electrodes. As seen byFigure 6a, the F 1s region on the grounded side slowly splits as the frequency of the external SQW excitation is reduced. No such splitting can be observed for a simple planar electrode, as depicted in Figure S5 of theSupporting Informationsection. When the electrode is elevated, however, the behavior of this region changes considerably and the splitting on the electrode
surfaces can be captured (Figure 6b). InFigure 6b, two distinct frequency-dependent shielding processes are seen. In the interelectrode distance (the unshaded region), as the frequency of the excitation is decreased, the voltage becomes uniform showing complete shielding. On the portions of the ionic liquid that fall directly on the electrode as marked by the shaded region, the shielding occurs at different time scales. This is an outcome of the ion transport being impeded because of the restricted volume in the vertical plane. The lower amount of available ions in the vertical direction causes a lag in the shielding for the portion of the ionic liquid on the electrode surfaces when compared to the rest of the ionic liquid. This is only captured because of the high surface sensitivity of XPS and the explicit two-dimensional nature of the model. This behavior is consistent with the XPS results shown in Figure 6a, where in terms of shielding, the ionic liquid on the electrode lags behind the ionic liquid in the inter-electrode region.
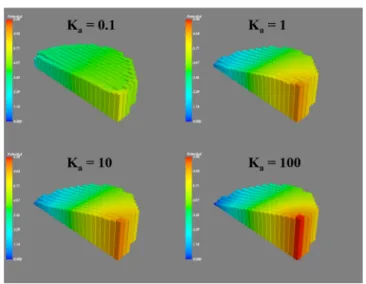
Association Equilibrium. Using the point-contact geom-etry (similar results are obtained for planar and elevated contacts, see Figures S6 and S7), the profound effect of association equilibrium on the observed voltage profiles can be seen inFigure 8. Association equilibrium directly controls the
number of available charged particles. These charged particles are the ones that screen and shield the applied potential; therefore, if the tendency to form pairs is high (i.e., if the association constant is high), the external bias applied is no longer shielded and the liquid exhibits a simple resistive behavior, as characterized by the linear voltage−distance relationship in the time scale of the simulations. Similar unscreened, resistive behavior can be experimentally demon-strated under XPS for a graphene sheet under external bias.7 For graphene devices, the observed resistive behavior is the result of purely resistive voltage distribution without contribution from the ion transport to screen the voltage, which is similar to the high association constant case simulated in Figure 8 (also see Figure S3). Association equilibrium, therefore, is a crucial factor in appropriately modelling the charge-screening effects in ionic liquids because the amount of association can explicitly switch the mechanism of ion Figure 7.Response of the ionic liquid to an 8 Vp−pSQW at varying
frequencies (a) measured by XPS for a device with two Pt point contacts, (b) simulated by the coarse-grained electrostatic model.
Figure 8.Simulated voltage profiles as a function of the association constant at the same simulated frequency in the point-contact geometry.
screening from mostly ionic to purely resistive. Similar shifts from purely resistive to shielded and capacitive voltage profiles are obtained when the time scale of both the experiments and the simulations are decreased such that charge movement cannot be completed in the given time scale. Experimentally verifying the effect of association equilibrium on the observed voltage profiles, however, is not straightforward because to
change the extent of association, ions forming the ionic liquid need to be changed while keeping other physical properties such as the diffusion constant, mobility of ions, and the capacitance of the ionic liquid minimally close. This highlights
the benefits of the electrostatic model which allows the
interrogation of individual physical properties on the overall observed voltage response.
Figure 9.Number of particles at various positions at the ionic liquid surface across different time scales (red line indicates the initial number of particles for all boxes).
Figure 10.Simulated voltage response of the ionic liquid at different frequencies of 8 Vp−pSQW (black), the corresponding change in total number of particles at the given grid (red). The left panels show the response of a grid near the source electrode, whereas the right panels show the response near the grounded electrode. Blue line indicates the initial number of charged particles for all boxes.
Particle Tracking. Apart from being able to explain the ion-screening effects at extended distances, another important insight gained by this model is the ability to track the number of particles at various positions in the ionic liquid. Tracking the number of particles corroborates the picture depicted in
Figures 6 and7. At low frequencies where ions have enough time to properly screen the external bias, charged species are concentrated at the electrode surfaces, whereas at higher frequencies, charged species are equally distributed throughout the ionic liquid as shown inFigure 9. Similar extended regions of ion accumulation in ionic liquids were measured in the literature by mass spectroscopy on frozen actuators.16
Considering the number of particles as a function of time at different frequencies of simulated SQWs, as shown inFigure 10, we can see that whenever the polarity is altered, a quick drop in the number of charged particles is seen. This is reflected in the voltage profile as a peak higher than the applied voltage for the side where the potential is applied (the source electrode), whereas it is reflected as a slow rise on the grounded side (the grounded electrode), consistent with an equivalent circuit of RC for each electrode. About as many particles per grid moves per time step as grid positions start with. As seen for the histograms and the surface maps shown in
Figures 6 and7, at higher frequencies, these particles do not have enough time to appropriately screen the bias prior to its switch in polarity. The high number of particles influx across long distances (∼mm) suggests a mixed form of ion transport. Apart from migration, pairs, starting from the grids near/at the electrodes, participate in the association equilibrium to quickly shuttle appropriate charges to the electrodes. For instance, consider a grid where an applied bias of 4 V is already at the steady state (i.e., the majority of the boxes near the middle of the ionic liquid show 2 V), this grid has an abundance of negative charges to screen the applied potential. Once the polarity is switched, however, these charges need to be either shuttled away or stored as pairs near the grid in question, where shuttling alone is modeled as a relatively slow process.c Further, the effect of association equilibrium at the same modeled time scale (Figure 8) also suggests a similar picture, if the tendency to form pairs is high; once charges are paired, they can no longer split at the opposite electrode to shield the applied bias at the given time scale. Rather, screening is achieved by the migration of the sparse number of charged species which is inherently slower.
■
CONCLUSIONSThe otherwise unexplained effects of the double-layer
formation at extended distances (∼millimeter) observed
experimentally for ionic liquid drops under external bias using XPS6 are modeled using a computationally inexpensive coarse-grained electrostatic model. This model can match the frequency evolution of the ionic liquid response from resistive to screened behavior while highlighting the importance of the pairing equilibrium in ion transport, especially at extended distances. Moreover, the effects of various device geometries can be explained using this coarse-grained electrostatic model.
■
ASSOCIATED CONTENT*
S Supporting InformationThe Supporting Information is available free of charge on the
ACS Publications websiteat DOI:10.1021/acs.jpcc.8b11665.
Detailed XPS spectra of the ionic liquid; details regarding the process of obtaining voltage maps via XPS; and modeling considerations for different device geometries (PDF)
■
AUTHOR INFORMATIONCorresponding Author
*E-mail:[email protected].
ORCID
Pinar Aydogan Gokturk: 0000-0001-8269-8884
Sefik Suzer: 0000-0002-5866-2600
Burak Ulgut:0000-0002-4402-0033 Notes
The authors declare no competingfinancial interest.
■
ACKNOWLEDGMENTSAuthors do not wish to acknowledge any support from external funding agencies.
■
ADDITIONAL NOTESa
1 C is the amount of current that accomplishes full discharge in 1 h.
b
Transition frequency is defined as the frequency of transition from a capacitive, shielded response to a resistive, unshielded response.
cGiven that the time scale of the simulations are normalized
such that the highest possiblefield movement can only move a particle across one grid.
■
REFERENCES(1) Freemantle, M. An Introduction to Ionic Liquids; The Royal Society of Chemistry, 2009.
(2) Watanabe, M.; Thomas, M. L.; Zhang, S.; Ueno, K.; Yasuda, T.; Dokko, K. Application of Ionic Liquids to Energy Storage and Conversion Materials and Devices. Chem. Rev. 2017, 117, 7190− 7239.
(3) Lewandowski, A.; Świderska-Mocek, A. Ionic Liquids as Electrolytes for Li-Ion Batteries-An Overview of Electrochemical Studies. J. Power Sources 2009, 194, 601−609.
(4) Balducci, A.; Jeong, S. S.; Kim, G. T.; Passerini, S.; Winter, M.; Schmuck, M.; Appetecchi, G. B.; Marcilla, R.; Mecerreyes, D.; Barsukov, V.; et al. Development of Safe, Green and High Performance Ionic Liquids-Based Batteries (ILLIBATT Project). J. Power Sources 2011, 196, 9719−9730.
(5) Camci, M. T.; Ulgut, B.; Kocabas, C.; Suzer, S. In Situ XPS Reveals Voltage Driven Asymmetric Ion Movement of an Ionic Liquid through the Pores of a Multilayer Graphene Electrode. J. Phys. Chem. C 2018, 122, 11883−11889.
(6) Camci, M. T.; Aydogan, P.; Ulgut, B.; Kocabas, C.; Suzer, S. XPS Enables Visualization of Electrode Potential Screening in an Ionic Liquid Medium with Temporal- and Lateral-Resolution. Phys. Chem. Chem. Phys. 2016, 18, 28434−28440.
(7) Kocabas, C.; Suzer, S. Probing Voltage Drop Variations in Graphene with Photoelectron Spectroscopy. Anal. Chem. 2013, 85, 4172−4177.
(8) Camci, M. T.; Ulgut, B.; Kocabas, C.; Suzer, S. In-Situ XPS Monitoring and Characterization of Electrochemically Prepared Au Nanoparticles in an Ionic Liquid. ACS Omega 2017, 2, 478−486.
(9) Smith, E. F.; Villar Garcia, I. J.; Briggs, D.; Licence, P. Ionic Liquids in Vacuo; Solution-Phase X-Ray Photoelectron Spectroscopy. Chem. Commun. 2005, 5633−5635.
(10) Kornyshev, A. A. Double-Layer in Ionic Liquids: Paradigm Change? J. Phys. Chem. B 2007, 111, 5545−5557.
(16) Liu, Y.; Lu, C.; Twigg, S.; Ghaffari, M.; Lin, J.; Winograd, N.; Zhang, Q. M. Direct Observation of Ion Distributions near Electrodes in Ionic Polymer Actuators Containing Ionic Liquids. Sci. Rep. 2013, 3, 973.
(17) Gebbie, M. A.; Dobbs, H. A.; Valtiner, M.; Israelachvili, J. N. Long-Range Electrostatic Screening in Ionic Liquids. Proc. Natl. Acad. Sci. U.S.A. 2015, 112, 7432−7437.
(18) Grahame, D. C. The Electrical Double Layer and the Theory of Electrocapillarity. Chem. Rev. 1947, 41, 441−501.
(19) Robinson, R. A.; Stokes, R. H. Electrolyte Solutions; Dover Publications, 1955.
(20) Bockris, J. O.; Reddy, A. K. N. Modern Electrochemistry 1: Ionics, 2nd ed.; Kluwer Academic Publishers: New York, 1998.
(21) MacFarlane, D. R.; Forsyth, M.; Izgorodina, E. I.; Abbott, A. P.; Annat, G.; Fraser, K. On the Concept of Ionicity in Ionic Liquids. Phys. Chem. Chem. Phys. 2009, 11, 4962.
(22) Goodwin, Z. A. H.; Feng, G.; Kornyshev, A. A. Mean-Field Theory of Electrical Double Layer in Ionic Liquids with Account of Short-Range Correlations. Electrochim. Acta 2017, 225, 190−197.
(23) Aydogan Gokturk, P.; Salzner, U.; Nyulászi, L.; Ulgut, B.; Kocabas, C.; Suzer, S. XPS-Evidence for in-Situ Electrochemically-Generated Carbene Formation. Electrochim. Acta 2017, 234, 37−42.
(24) Oliphant, T. E. Guide to Numpy, 2nd ed.; CreateSpace Independent Publishing Platform: USA, 2015.
(25) van der Walt, S.; Colbert, S. C.; Varoquaux, G. The NumPy Array: A Structure for Efficient Numerical Computation. Comput. Sci. Eng. 2011, 13, 22−30.
(26) Millman, K. J.; Aivazis, M. Python for Scientists and Engineers. Comput. Sci. Eng. 2011, 13, 9−12.
(27) Hunter, J. D. Matplotlib: A 2D Graphics Environment. Comput. Sci. Eng. 2007, 9, 90−95.
(28) Ramachandran, P.; Varoquaux, G. Mayavi: 3D Visualization of Scientific Data. Comput. Sci. Eng. 2011, 13, 40−51.
(29) Tasci, T. O.; Atalar, E.; Demirok, U. K.; Suzer, S. Electrical Circuit Modeling of Surface Structures for X-Ray Photoelectron Spectroscopic Measurements. Surf. Sci. 2008, 602, 365−368.
(30) Suzer, S.; Sezen, H.; Ertas, G.; Dâna, A. XPS Measurements for Probing Dynamics of Charging. J. Electron Spectrosc. Relat. Phenom. 2010, 176, 52−57.
(31) Paneru, M.; Priest, C.; Sedev, R.; Ralston, J. Static and Dynamic Electrowetting of an Ionic Liquid in a Solid/Liquid/Liquid System. J. Am. Chem. Soc. 2010, 132, 8301−8308.
(32) Liu, Z.; Cui, T.; Li, G.; Endres, F. Interfacial Nanostructure and Asymmetric Electrowetting of Ionic Liquids. Langmuir 2017, 33, 9539−9547.