AN ARTIFICIAL NEURAL NETWORK DESIGN FOR DETERMINATION OF
HASHIMOTO’S THYROIDITIS SUB-GROUPS
Mehmet Emin Aktan
1, Erhan Akdoğan
2, Namık Zengin
3,
Ömer Faruk Güney
4, Rabia Edibe Parlar
5Abstract: In this study, an artificial neural network was developed for estimating Hashimoto’s Thyroiditis sub-groups. Medical analysis and measurements from 75 patients were used to determine the parameters most effective on disease sub-groups. The study used statistical analyses and an artificial neural network that was trained by the determined parameters. The neural network had four inputs: thyroid stimulating hormone, free thyroxine (fT4), right lobe size (RLS), and RLS2 – fT44, and two outputs for three groups: euthyroid, subclinical, and clinical. After training, the network was tested with data collected from 30 patients. Results show that, overall, the neural network estimated the sub-groups with 90% accuracy. Hence, the study showed that determination of Hashimoto’s Thyroiditis sub-groups can be made via designed artificial neural network. UDC Classification: 004.8, DOI: http://dx.doi.org/10.12955/cbup.v4.845
Keywords: artificial neural networks, hashimoto, thyroiditis, statistical analyze, diagnosis.
Introduction
Hashimoto’s thyroiditis (HT), one of the most common autoimmune disease, was described over a century ago as a pronounced lymphoid goiter affecting approximately 2% of the population and being 20 times more prevalent in women than men. An autoimmune disease is a disorder in which the body’s immune system attacks the body’s own cells and organs. Normally, the immune system protects the body from infection by identifying and destroying bacteria, viruses, and other potentially harmful foreign substances. In HT, the immune system attacks the thyroid gland, causing inflammation, and hinders the thyroid gland in producing balancing hormones (Omitek, Burda, & Wojcik, 2013; Caturegli, Remigis, & Rose, 2014).
Thyroid hormones regulate metabolism and affect almost all organs in the body. Hashimoto’s disease often leads to reduced thyroid function, or hypothyroidism. Hypothyroidism is a disorder that occurs when the thyroid fails to make enough thyroid hormone for the body’s needs (Ozyılmaz & Yıldırım, 2002). The thyroid produces two thyroid hormones, triiodothyronine (T3) and thyroxine (T4). Triiodothyronine is the active hormone and is derived from T4. Thyroid-stimulating hormone (TSH), which is produced by the pituitary gland in the brain, regulates thyroid hormone production (Omitek, Burda, & Wojcik, 2013; Caturegli, Remigis, & Rose, 2014; Ozyılmaz & Yıldırım, 2002; Health Information, 2016). The diagnosis of HT is based on the indication of excursive antibodies to thyroid antigens and reduced echogenicity on thyroid sonogram in a patient with proper clinical features. Diagnosis begins with a physical exam and medical history. A goiter, nodules, or growths may be found during a physical exam, and symptoms may suggest hypothyroidism. Health care providers will then perform blood tests to confirm the diagnosis. Diagnostic blood tests may include the TSH test, T4 test, and anti-thyroid and anti-body tests, as well as common methods to diagnose HT, including ultrasound and computational-tomography scans (Ozyılmaz & Yıldırım, 2002; Health Information, 2016).
Artificial neural networks (ANNs) are widely used in science and technology, with applications in various branches of engineering and medicine. Artificial neural networks have many advantages, such as, flexible modelling structure for large data sets and highly accurate results that supports clinical decision making. Artificial neural networks have been used in diagnosis of many diseases. In Omitek,
1 Mehmet Emin Aktan, Research assistant, Yildiz Technical University, Department of Mechatronics Engineering, Republic
of Turkey, [email protected]
2 Erhan Akdoğan, Associate Professor, Yildiz Technical University, Department of Mechatronics Engineering, Republic of
Turkey, [email protected]
3 Namık Zengin, Research assistant, Yildiz Technical University, Department of Mechatronics Engineering, Republic of
Turkey, [email protected]
4 Ömer Faruk Güney, Research assistant, Yildiz Technical University, Department of Mechatronics Engineering, Republic of
Burda, and Wojcik (2013), diagnosis of Hashimoto’s thyroiditis was carried out using ultrasound images of thyroid glands and ANN. In Caturegli, Remigis, and Rose (2014), determination of thyroid illnesses was carried out via ANN. In Er, Temurtas, and Tanrıkulu (2008), diagnosis of tuberculosis was performed by ANN with 95.08% accuracy. Castanho, Hernandes, De Re, Rautenberg, and Billis (2013) used an expert system for predicting the pathological stage of prostate cancer. In Takahashi, Hayashi, & Watanabe (2010), diagnosis of schizophrenia was carried out by ANN with 87.90% accuracy. In Kaya, Aktan, Akdoğan, and Koru (2015), diagnosis of anemia in children was performed using ANN with 90.00% accuracy.
The aim of this study is to diagnose (determine) Hashimoto’s thyroiditis sub-groups via artificial neural networks. There is no exact therapy or medicine for treating the advanced stage of this disease. This study will help diagnosis early stages of the disease. In this way, patients could be monitored with imaging testing much earlier. A vital issue is to increase the effectiveness of treatment, so that diagnosis can be achieved as early as possible.
Data Analysis
The analyses, performed using SPSS software, identified the designated parameters from a total of eight (body mass index, waist measurement, hip measurement, TSH, fT3, fT4, right lobe size (RLS), or left lobe size) tested and measured in 75 Hashimoto’s thyroiditis patients, that affected the disease sub-groups. Mode, mean, median, and table distribution graphs were obtained from univariate analyses. A regression analysis with a post-hoc test was performed to measure the relationship between two or more variables. This approach provided an opportunity to obtain both descriptive and inferential statistics. Calculations were based on 5% margin of error. Further hypothesis related to whether the data showed effects in the patients. The results of hypothesis testing were considered suitable for modeling. The t-test and chi-squared test were performed to establish the hypothesis. The t-test was performed for the comparison of paired samples and groups, with a variance test performed to examine the difference between groups. Since the data was homogeneously distributed, a Tukey’s range test was performed. The results of the regression analysis, an analysis of variation (ANOVA), and coefficient values identified whether the model could be generated and, following this, a correlation analysis was performed.
Training Artificial Neural Networks
The Neural Network Toolbox of Matlab© R2013b was used to create, train, and test the artificial neural network. First, training and test data were normalized between −1 and 1. Then the training and test data along with the output data were assigned to variables. The network training function, TRAINLM, the learning function, LEARNGDM, and the mean squared error as the performance function were used.
Training and test data were transferred as input data, and the output of training data as target data to create the network and this was followed by training of the neural network. The training was achieved by a backpropagation method after setting the network properties and the training parameters. The network was tested with 30 data points collected from patients.
Results and Discussion
Table 1 shows the results of the t-Test, and Table 2 the results of the regression and ANOVA. According to the results of the coefficients table, obtained after the regression, the most important parameters affecting the disease sub-groups were TSH, fT4, and RLS.
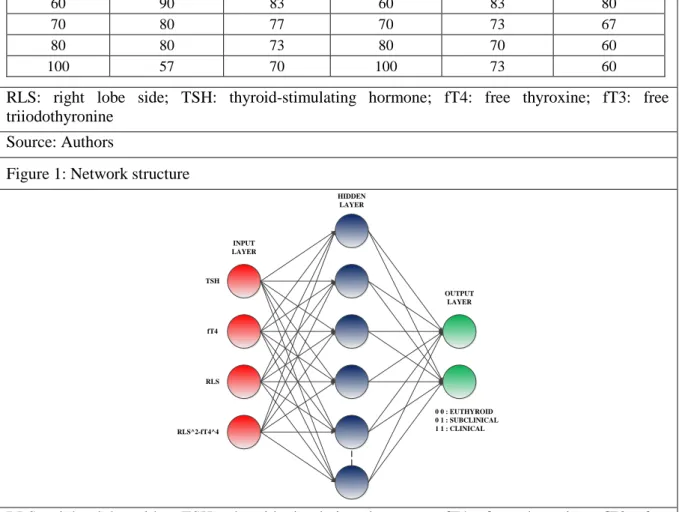
Structure of Artificial Neural Networks
The network was developed to feed forward multilayer perceptron with a 3-layer structure. For selection of input parameters, various combinations were trialed for best performance. The results showed that the network was able to diagnose the disease with high accuracy. The network structure is shown in Figure 1. As a result of network training with the three parameters identified from the data analysis, i.e., TSH, fT4, and RLS, up to 80% accuracy was obtained. Because data of euthyroid and subclinical groups were closely related, effective determination could not be achieved. Therefore, various trials were performed with the power of input parameters and best accuracy (90%) was
obtained by squaring the value for the right lobe side and subtracting the value for free triiodothyronine to the power of four (equation: RLS2 – fT4). The trial results are shown in Table 4.
Table 1: t-Test statistics of data from 75 Hashimoto’s thyroiditis patients
Parameters Sex N Mean Std. Deviation Std. Error Mean
Waist male
female
10 88.333 14.874 4.958
65 81.774 10.968 1.393
Body Mass Index male
female 10 25.760 4.805 1.519 65 26.006 6.008 0.751 Hip male female 10 100.222 9.562 3.187 65 102.564 10.275 1.305 TSH male female 10 45.363 58.636 18.542 65 13.547 23.792 2.951 fT4 male female 10 0.812 0.308 0.097 65 0.906 0.198 0.024 fT3 male female 10 2.677 0.992 0.330 65 2.928 0.376 0.049 RLS male female 10 19.300 5.598 1.770 65 16.359 2.026 0.253 LLS male female 10 50.300 6.783 2.145 65 47.890 6.796 0.849
TSH: thyroid-stimulating hormone; fT4: free thyroxine; fT3: free triiodothyronine; RLS: right lobe side; LLS: left lobe side
Source: Authors
Table 2: Regression results for dependent variable, right lobe side, and predictors, thyroid-stimulating hormone, free thyroxine, and free triiodothyronine
Model Summary
Model R R Square Adjusted R Square Std. Error of the Estimate
1 0.202a 0.041 -0.007 1.92357
ANOVA
Model Sum of Squares df Mean Square F Sig.
1 Regression 9.431 3 3.144 0.850 0.472a Residual 222.006 60 3.700 Total 231.438 63 Coefficients Model Unstandardized Coefficients Standardized Coefficients t Sig. B Std. Error Beta 1 (Constant) 16.822 2.309 7.286 0.000 TSH 0.009 0.012 0.136 0.742 0.461 fT4 1.632 1.476 0.187 1.106 0.273 fT3 -0.636 0.779 -0.157 -0.816 0.417
a Predictors: (Constant). TSH: thyroid-stimulating hormone; fT4: free thyroxine; fT3: free
triiodothyronine Source: Authors
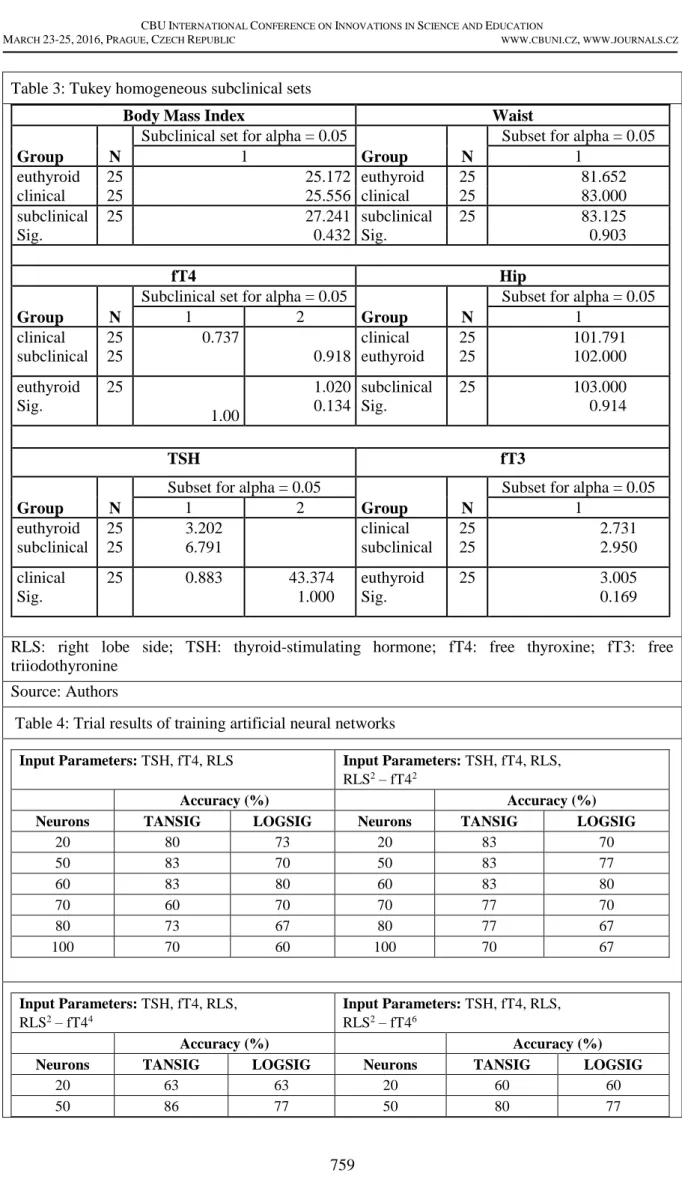
Table 3: Tukey homogeneous subclinical sets
Body Mass Index Waist
Group N
Subclinical set for alpha = 0.05
Group N
Subset for alpha = 0.05
1 1 euthyroid 25 25.172 euthyroid 25 81.652 clinical 25 25.556 clinical 25 83.000 subclinical 25 27.241 subclinical 25 83.125 Sig. 0.432 Sig. 0.903 fT4 Hip Group N
Subclinical set for alpha = 0.05
Group N
Subset for alpha = 0.05
1 2 1 clinical subclinical 25 25 0.737 0.918 clinical euthyroid 25 25 101.791 102.000 euthyroid Sig. 25 1.00 1.020 0.134 subclinical Sig. 25 103.000 0.914 TSH fT3 Group N
Subset for alpha = 0.05
Group N
Subset for alpha = 0.05
1 2 1 euthyroid subclinical 25 25 3.202 6.791 clinical subclinical 25 25 2.731 2.950 clinical Sig. 25 0.883 43.374 1.000 euthyroid Sig. 25 3.005 0.169
RLS: right lobe side; TSH: thyroid-stimulating hormone; fT4: free thyroxine; fT3: free triiodothyronine
Source: Authors
Table 4: Trial results of training artificial neural networks
Input Parameters: TSH, fT4, RLS Input Parameters: TSH, fT4, RLS, RLS2 – fT42
Accuracy (%) Accuracy (%)
Neurons TANSIG LOGSIG Neurons TANSIG LOGSIG
20 80 73 20 83 70 50 83 70 50 83 77 60 83 80 60 83 80 70 60 70 70 77 70 80 73 67 80 77 67 100 70 60 100 70 67 Input Parameters: TSH, fT4, RLS, RLS2 – fT44 Input Parameters: TSH, fT4, RLS, RLS2 – fT46 Accuracy (%) Accuracy (%)
Neurons TANSIG LOGSIG Neurons TANSIG LOGSIG
20 63 63 20 60 60
60 90 83 60 83 80
70 80 77 70 73 67
80 80 73 80 70 60
100 57 70 100 73 60
RLS: right lobe side; TSH: thyroid-stimulating hormone; fT4: free thyroxine; fT3: free triiodothyronine
Source: Authors
Figure 1: Network structure
TSH fT4 RLS RLS^2-fT4^4 INPUT LAYER HIDDEN LAYER OUTPUT LAYER 0 0 : EUTHYROID 0 1 : SUBCLINICAL 1 1 : CLINICAL | |
RLS: right lobe side; TSH: thyroid-stimulating hormone; fT4: free thyroxine; fT3: free triiodothyronine
Source: Authors
According to trial results, four of the inputs to the ANN were TSH, fT4, RLS, and RLS2 – fT44, and
two of the outputs were representative of euthyroid, subclinical, and clinical. There were 60 neurons in the hidden layer. Tangent-sigmoid were used as an activation function. The data for 45 of the 75 patients were used for training and another 30 for testing the neural network. Samples of the training and test data are shown in Table 5.
Table 5: Sample training and test data TSH mU/mL fT4 ng/dL RLS mm RLS 2 – fT44 0 0: euthyroid 0 1: subclinical 1 1: clinical 5.80 0.91 15 224.3 0 1 20.00 0.80 12 143.5 1 1 1.76 1.20 19 358.9 0 0
RLS: right lobe side; TSH: thyroid-stimulating hormone; fT4: free thyroxine; fT3: free triiodothyronine
Source: Authors
Performance of the network and regression results plots are shown in Figure 2. Figure 2a shows the mean square error (MSE) reached 10-23 after epoch 600 and best validation performance was 9.0427e-24
at epoch 1000. In contrast, training and validation results were highly satisfactory, depending on the MSE (Figure 2b). This result indicated that the neural network was successfully trained.
Figure 2: Performance of learning (a) and regression results (b)
(a)
(b) Source: Authors
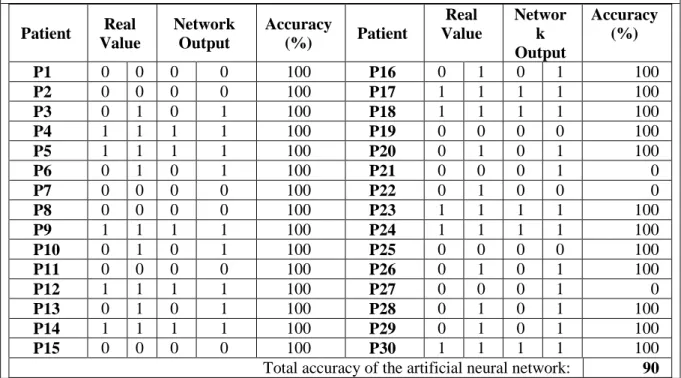
Testing Artificial Neural Networks
Once the outputs of the network were compared with actual results, there were three incorrect outcomes found. A comparison of the artificial network outputs with actual doctor’s (or ‘real’) values is shown in Table 4. The binary numbers ‘0, 0’ indicated the euthyroid sub-group, ‘0, 1’ the subclinical sub-group, and ‘1, 1’ the clinical sub-group.
Table 4: Test results, comparison of the artificial network outputs with actual (or ‘real’) Patient Real Value Network Output Accuracy (%) Patient Real Value Networ k Output Accuracy (%) P1 0 0 0 0 100 P16 0 1 0 1 100 P2 0 0 0 0 100 P17 1 1 1 1 100 P3 0 1 0 1 100 P18 1 1 1 1 100 P4 1 1 1 1 100 P19 0 0 0 0 100 P5 1 1 1 1 100 P20 0 1 0 1 100 P6 0 1 0 1 100 P21 0 0 0 1 0 P7 0 0 0 0 100 P22 0 1 0 0 0 P8 0 0 0 0 100 P23 1 1 1 1 100 P9 1 1 1 1 100 P24 1 1 1 1 100 P10 0 1 0 1 100 P25 0 0 0 0 100 P11 0 0 0 0 100 P26 0 1 0 1 100 P12 1 1 1 1 100 P27 0 0 0 1 0 P13 0 1 0 1 100 P28 0 1 0 1 100 P14 1 1 1 1 100 P29 0 1 0 1 100 P15 0 0 0 0 100 P30 1 1 1 1 100
Total accuracy of the artificial neural network: 90 Source: Authors
For 27 of 30 cases, outputs of the network and decisions of the doctor were in agreeance, and total accuracy of the artificial neural network was 90% (Table 4). Incorrect predictions emerged in the euthyroid and subclinical groups, while the clinical group was estimated with 100% accuracy.
Conclusion
This paper describes an artificial neural network that was developed to determine Hashimoto’s thyroiditis sub-groups. Medical analyses and measurements, from 75 patients, were used to determine the most influential parameters on the disease sub-groups. The study used statistical analyses and a neural network that was trained by the determined parameters. In the test, outputs of the network were compared to the decisions of the doctor. The reason for the outcome was that euthyroid and subclinical sub groups were closely related. We consider the developed artificial neural network model adequate for use in helping doctors determine Hashimoto’s thyroiditis sub-groups.
Acknowledgement
We would like to thank Prof. Dr. Handan Ankarali and Dr. Merve Aktan for their support and valuable comments.
References
Castanho, M. J. P., Hernandes, F., De Re, A. M., Rautenberg, S., & Billis, A. (2013). Fuzzy expert system for predicting
pathological stage of prostate cancer. Expert systems with applications 466-470.
Caturegli, P., Remigis, A., & Rose, N. R. (2014). Hashimoto thyroiditis: Clinical and diagnostic criteria, Autoimmunity reviews.
Er, O., Temurtas, F., & Tanrıkulu, A. Ç. (2008). Tuberculosis disease diagnosis using artificial neural networks. Journal of Medical Systems 299-302.
Health Information (2016) www.niddk.nih.gov/health-information/health-topics/endocrine/hashimotos-disease/ 16.03.2016. Kaya, E., Aktan, M. E., Akdoğan, E., & Koru, A. T. (2015). Diagnosis of anemia in children via artificial neural network. International Journal of Intelligent Systems and Applications in Engineering, 24-27.
Omitek, Z., Burda, A., & Wojcik, W. (2013). The use of decision tree induction and artificial neural networks for automatic
diagnosis of Hashimoto’s disease. Expert Systems with Applications 6684-6689.
Ozyılmaz, L., & Yıldırım, T. (2002). Diagnosis of thyroid disease using artificial neural network methods. Proceedings of the 9th International Conference on Neural Information Processing Vol: 4,2033-2036.
Takahashi, M., Hayashi, H., & Watanabe, Y. (2010). Diagnostic classification of schizophrenia by neural network analysis of