MICRO ELECTRO DISCHARGE MACHINING OF TUNGSTEN CARBIDE AND POLYCRYSTALLINE DIAMOND: AN EXPERIMENTAL ANALYSIS OF
PROCESS PARAMETERS
A THESIS
SUBMITTED TO THE DEPARTMENT OF INDUSTRIAL ENGINEERING AND THE GRADUATE SCHOOL OF ENGINEERING AND SCIENCE
OF BILKENT UNIVERSITY
IN PARTIAL FULLFILLMENT OF THE REQUIREMENTS FOR THE DEGREE OF
MASTER OF SCIENCE
BY CEM ÖZDEMİR
I certify that I have read this thesis and that in my opinion it is full adequate, in scope and in quality, as a dissertation for the degree of Master of Science.
___________________________________ Asst. Prof. Yiğit Karpat (Advisor)
I certify that I have read this thesis and that in my opinion it is full adequate, in scope and in quality, as a dissertation for the degree of Master of Science.
______________________________________ Prof. M. Selim Aktürk
I certify that I have read this thesis and that in my opinion it is full adequate, in scope and in quality, as a dissertation for the degree of Master of Science.
______________________________________ Asst. Prof. Melih Çakmakcı
Approved for the Graduate School of Engineering and Science
____________________________________ Prof. Levent Onural
ii
ABSTRACT
MICRO ELECTRO DISCHARGE MACHINING OF TUNGSTEN CARBIDE AND POLYCRYSTALLINE DIAMOND: AN EXPERIMENTAL ANALYSIS OF
PROCESS PARAMETERS
CEM OZDEMIR M.S. in Industrial Engineering Supervisor: Assist. Prof. Yiğit Karpat
August, 2013
Electro discharge machining (EDM) is a manufacturing process where material removal is realized through electrical discharges between two conductive materials without applying any external forces. As a result, high aspect ratio micro features on difficult-to-cut materials such as tungsten carbide and polycrystalline diamond can be obtained. In this study, influences of micro-EDM process parameters such as voltage, capacitance, and rotational speed on material removal rate and surface quality have been investigated using experimental techniques. Experimental results have revealed that capacitance and voltage applied during EDM process have significant effects on material removal rate and surface roughness. Regression models have been calculated to represent the relationships between process inputs and outputs which can be used to calculate processing time and to predict surface finish. In addition, a process planning software for wire-EDM process, which is capable of
iii
generating necessary tool paths during fabrication of micro tools, has been developed. The software is also capable of producing the solid model of the micro tools which can be utilized in computer aided engineering applications.
Keywords: Electrical discharge machining, Micro cutting tools, Experimental analysis
iv
ÖZET
Cem Özdemir
Endüstri Mühendisliği, Yüksek Lisans Tez Yöneticisi: Yrd. Doç. Dr. Yiğit Karpat
Ağustos, 2013
Elektroerozyon işlemi, iki elektrik iletken malzeme arasında herhangi dış kuvvet uygulanmadan, malzemenin elektrik boşalmasıyla kaldırılmasıdır. Bu durumun bir sonucu olarak, kesimi zor olan tunsgten karbür ve çokkristalli elmas gibi malzemelerden çap/boy oranı yüksek mikro yapılar elde edilebilir. Bu çalışmada deneysel teknikler kullanılarak, mikro elektro erozyon parametlerinden olan kapasitans, voltaj ve dönme hızının malzeme kaldırma oranı ve yüzey pürüzlülüğü üzerine olan etkileri araştırılmıştır. Elektroerozyon işlemi sırasında uygulanan kapasitans ve voltajın malzeme kaldırma oranı ve yüzey pürüzlülüğü üzerinde önemli bir etkisi olduğu deneysel çalışmalar sonucunda görülmüştür. İşlem süresini ve yüzey pürüzlülüğünü tahmin etmede kullanılabilen, süreç girdileri ve çıktıları arasındaki ilişkiyi göstermesi bakımından regresyon modelleri geliştirilmiştir. Ek olarak, mikro takımın görüntülenme olanak sağlayan kullanıcı arayüzü geliştirilmiştir. Geliştirilen kullanıcı arayüzü mikro takım üretimi işlemi sürecinde gerekli olan takım yolunu üretme esnekliğine de sahiptir. Geliştirilen süreç planlama yazılımının mikro takım üretiminde başarılı bir şekilde kullanılabildiği gösterilmiştir.
v
ACKNOWLEDGEMENT
I would like to express my sincere gratitude to my advisor Asst. Prof. Dr. Yiğit Karpat. I appreciate his advices and his continuous support throughout my graduate studies. He motivated me with his enthusiasm and immense knowledge.
I also would like to thank The Scientific and Technological Research Council of Turkey (TÜBİTAK) and Ministry of Development of Turkey for their support of this work.
My thanks also go to Samad Nadimi Bavil Oliaei, who is PhD student in mechanical engineering, for support, encouragement during different periods of my research and for his helpful suggestions.
Last but not the least; I would like to extend my sincere appreciation to the members of Department of Industrial Engineering of Bilkent University.
vi
Contents
Chapter 1 ... 1 Introduction ... 1 Chapter 2 ... 5 Literature Review ... 52.1. Principle of Electrical Discharge Machining ... 5
2.2. Process Parameters of EDM ... 7
2.2.1. Electrode Material ... 7
2.3.2. Polarity ... 8
2.3.3. Pulse Duration ... 8
2.3.4. Peak Current ... 9
2.3.5. Capacitance ... 10
2.4. Fabricating micro tools using EDM methods ... 10
2.4.1. Wire electro discharge grinding (WEDG) ... 10
2.4.2 Block-EDM processes ... 14
2.5. Process Planning ... 17
Chapter 3 ... 20
Experimental Setup and Methodology ... 20
Chapter 4 ... 25
Experimental Investigation of Influence of EDM Parameters on Process Outputs ... 25
4.1. Experimental analysis of EDM process parameters on MRR of macro scale tools ... 26
4.1.1 Regression model ... 31
vii
4.2.1 Regression Analysis of the Tools in Micron Levels ... 36
4.3. Effect of process parameters on surface roughness ... 39
4.3.1 Regression Analysis for the Surface Roughness ... 44
4.4 Interpretation of the experimental results ... 45
Chapter 5 ... 49
Process Planning Software for EDM ... 49
Chapter 6 ... 60
Conclusion and Future Work ... 60
viii
List of Figures
Figure 1.1 Factors influcing EDM process ... 3
Figure 2.1 Principle of EDM process [4] ... 6
Figure 2.2 Voltage and Current waveforms in EDM operations [4]... 9
Figure 2.3 WEDG method to fabricate micro tools [13] ... 11
Figure 2.4 Fabrication process of the tool [14] ... 12
Figure 2.5 Micro conical tool and groove machined in soda-lime glass [15] ... 13
Figure 2.6 Designed and fabricated micro milling tool [16] ... 13
Figure 2.7 3D solid models [17] ... 14
Figure 2.8 Fabricated PCD micro ball end mill [17] ... 14
Figure 2.9 Block-EDM method [18] ... 15
Figure 2.10 Cutting tools in different geometries [19] ... 16
Figure 2.11 Fabrication steps of spherical PCD tool [20] ... 16
Figure 2.12 User form related to tool geometry definiton [21]... 18
Figure 2.13 User Interface of the system ... 19
Figure 3.1 Micro EDM setup ... 20
Figure 3.2 General views both VHX-1000 digital and VK-X100 3D laser scanning microscopes. ... 23
Figure 3.3 Ultrasonic cleaning process and micro scale ... 24
Figure 4.1 Main effects plot for the tools having diameter 3mm ... 29
Figure 4.2 Probability Plot Of Residuals for millimeter scale Tools ... 29
ix
Figure 4.4 Observation order for MRR experiments of milimeter scale tools... 31
Figure 4.5 Normal plot of the standardized effects of micron scale tools ... 34
Figure 4.6 Main effects plot for micron scale tools ... 34
Figure 4.7 Main effects plot for 0.75 mm tools ... 36
Figure 4.8 Equal variances for residuals ... 37
Figure 4.9 Observation order ... 38
Figure 4.10 Surface profiles at four different locations on the periphery of the rod. ... 40
Figure 4.11 Photos of the surfaces after EDM operation. ... 41
Figure 4.12 Main effects plot for surface roughness (Ra) ... 44
Figure 4.13 MRR versus capacitance and voltage for the tools in micron level ... 45
Figure 4.14 MRR versus capacitance and voltage for the tools in milimeter level ... 46
Figure 4.15 Surface roughness as a function of capacitance and voltage ... 46
Figure 4.16 Diameter reduction versus time ... 48
Figure 5.1 User interface ... 50
Figure 5.2 User interface and generated G-code for the fabrication of micro ball end mills ... 51
Figure 5.3 Appearance of the tool before and at the end of the block-EDM process ... 51
Figure 5.4 User form for tool and wire data... 52
Figure 5.5 The designation used for wire diameter compensation in this study ... 53
Figure 5.6 Obtained hemispherical tool after WEDG method ... 54
Figure 5.7 Tool profile of the micro ball end mill ... 55
Figure 5.8 D-Shape ball end mill user form ... 56
x
Figure 5.10 Solidwork design user form ... 58 Figure 5.11 Embedded macro in solidworks ... 59
xi
List Of Tables
Table 3.1 Properties of the tungsten carbide ... 21
Table 3.2 Properties of the polycrystalline diamond ... 21
Table 3.3 Physical properties of the pure tungsten ... 22
Table 3.4 Physical properties of the brass ... 22
Table 3.5 Properties of the EDM fluid 108 MP-S ... 22
Table 4.1 Design matrix of experiments and responses for milimeter scale tools ... 27
Table 4.2ANOVA result ... 28
Table 4.3 Regression coefficients ... 32
Table 4.4 Analysis of variance for tools in millimeter scale tools ... 32
Table 4.5 Design matrix of experiments and responses for micron scale tools ... 33
Table 4.6 Analysis of variance for MRR experiments of micron scale tools ... 35
Table 4.7 Regression coefficients ... 38
Table 4.8 Analysis of variance ... 39
Table 4.9 Design matrix of experiments and responses for surface response ... 42
Table 4.10 Analysis of variance for surface roughness (Ra) ... 43
Table 4.11 Regression coefficients ... 44
Table 5.1 Parameter values for both designed and fabricated PCD tools ... 57
1
Chapter 1
Introduction
Electro discharge machining (EDM) is a manufacturing process which removes material by means of rapid and repetitive spark charges resulting from local explosion of a dielectric fluid. Need to fabricate of hard and difficult-to-machine materials such as tool steels, composites, ceramics, super alloys, carbides, stainless steels which are commonly used in mold making and aerospace industries resulted in the development of EDM process. The main advantage of EDM process is that materials can be machined independent of their hardness as long as they conduct electricity [1].
Miniaturization of parts and components has become important for the development of high value added products and hence demand to micro parts have been increasing. Due to its advantages, micro EDM have become an indispensible process in micro manufacturing. Micro cutting tools made from tungsten carbide (WC) and polycrystalline diamond (PCD) materials can be fabricated using micro EDM technique and users have the ability to shape the electrodes according to their needs. Cost-efficient fabrication of micro cutting tools depends on material removal rate (MRR) which is considered as the major performance measure in EDM process since it is relatively slow compared to processes like micro turning and milling. Improvement of metal removal rate is an ongoing research area. Some variations on EDM process have been proposed
2
to improve material removal rate. However, these methods have not yet found application in EDM processes.
The advantages of EDM process can be listed as follows:
• EDM makes possible to machine complex shapes that would otherwise be difficult to produce with conventional cutting tools.
• It is possible to machine extremely hard material to very close tolerances via EDM.
• In EDM process, there is no direct contact between tool and work piece. Therefore delicate sections and weak materials can be machined without any distortion.
• A good surface finish can be obtained via EDM.
• Very small diameter holes can be easily drilled with EDM process.
The disadvantages of EDM process can also be listed as: • The slow rate of material removal.
• Potential fire hazard associated with use of combustible oil based dielectrics. • Reproducing sharp corners on the workpiece is difficult due to electrode wear. • "Overcut" is formed.
• Forming of thermally affected layer on the surface
• Excessive electrode tool wear occurs during machining. [2]
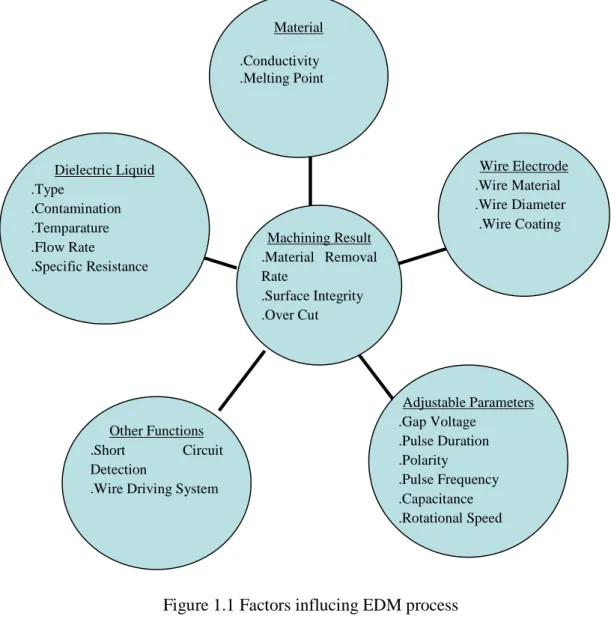
The below figure shows the factors which effects the EDM performance. It can be seen that the interaction between process inputs and outputs are quite complicated. It is difficult to model the relationships between process inputs and outputs using analytical techniques, therefore experimental techniques are usually preferred. In this study, in order to reduce the amount of experimental efforts, the number of process inputs is reduced to gap voltage, capacitance, and rotational speed. Process outputs are considered
3
as material removal rate and surface quality of the workpiece. The details of the EDM process parameters are explained in Chapter 2.
Manufacturing of parts having micro/nano features requires development of micro cutting tools. A recent trend in micro manufacturing is the development of hybrid
Dielectric Liquid .Type .Contamination .Temparature .Flow Rate .Specific Resistance Other Functions .Short Circuit Detection
.Wire Driving System
Adjustable Parameters .Gap Voltage .Pulse Duration .Polarity .Pulse Frequency .Capacitance .Rotational Speed Wire Electrode .Wire Material .Wire Diameter .Wire Coating Material .Conductivity .Melting Point Machining Result .Material Removal Rate .Surface Integrity .Over Cut
4
machines, which are both capable of fabricating micro cutting tools and utilizing these tools to obtain three dimensional micro features.
In industry, micro tools such as micro-end mills and drills are made from tungsten carbide (WC) and polycrystalline diamond (PCD). These tool materials exhibit high hardness and strength and due to their small grain size, sharp cutting edges can be obtained. Grinding technique is usually preferred for the fabrication of WC cutting tools. However, tool diameters less than 0.1 mm cannot be readily found in the market. PCD tools can only be fabricated by EDM process due to limitations of grinding process. WC and PCD blanks are obtained from tool manufacturers and diameters of the blanks are usually standardized to 2 and 3 mm. In order to obtain micro tools in the micron range, a large amount of material must be removed. It is important to be able to know the duration of the process and to predict the quality of the surface roughness of the finished tool. Therefore, process planning for the fabrication of micro cutting tools is important for tool manufacturers. Besides, computer aided manufacturing (CAM) software available for metal cutting operations do not exist for EDM processes to the same extent.
In order to be able to predict material removal rate and surface roughness for a given set EDM parameters, the influence of EDM parameters on the process outputs must be analyzed. For this purpose, experimental techniques are usually pursued to investigate material removal rate and surface quality. The goal of this thesis is to develop a process planning software that allows user in process planning while fabrication of micro tools. Process planning software also allows user the generate tool path (G-code) which will accelerate the tool development process. In addition, process plan must be done by considering physics of the process.
5
Chapter 2
Literature Review
This chapter provides a general overview on EDM process and effects of EDM parameters on process outputs. It also gives background information on micro cutting tool fabrication methods.
2.1. Principle of Electrical Discharge Machining
Micro-EDM is a thermal process where the material is removed by heat energy occurred by the flow of electricity between the electrode and workpiece. The dielectric fluid is used in electrical discharge machining act as an electrical insulator. It also fills the gap between electrode and the workpiece to avoid short circuiting. The ignition starts with a high voltage which overcomes the dielectric strength of the gap and a channel of plasma (electrically conductive gas) is formed between the electrode and the workpiece. At the point of discharge material is heated to the point where it vaporizes. As a result, a small crater is generated both on the electrode and on the workpiece. The dielectric fluid also helps cleaning the zone. At the end of the discharge duration, the temperature drops, and the dielectric fluid recovers its dielectric strength [3]. Sparks occurs with a frequency range from 2,000 to 500,000 sparks per seconds which seems that many sparks consisting simultaneously. However, only one spark emerges at a moment. The principle of EDM is represented in Figure 2.1.
6 (a)
(b)
Figure 2.1 Principle of EDM process [4]
Micro-EDM is different from conventional EDM in terms of pulse generator used. In micro EDM process, very small pulses are generated by pulse generator in which the pulse duration lasts micro or nanoseconds. As a result of that, micro-EDM employs low discharge energies to remove small volumes of material [5]
7 2.2. Process Parameters of EDM
2.2.1. Electrode Material
Electrode materials commonly used for electrical discharge machining (EDM) process have several characteristics in common such as high melting temperature, excellent electrical and thermal conductivity. Thus, graphite, copper, copper alloys, tungsten carbide and such materials are commonly used as electrode materials. Some studies related to effects of type of electrode material on EDM performance are presented below.
Lee and Li [6] have investigated the influence of operational parameters of EDM on the machining characteristics of tungsten carbide. Effectiveness of the EDM process is evaluated in terms of the material removal rate (MRR) and surface roughness. They conducted experiments using copper, copper tungsten and graphite electrodes. At the end of the study, they came up with the following conclusions. For all electrode materials, material removal rate increases with increasing peak current. In terms of effect of electrodes on material removal rate, it is observed that graphite electrode gives higher MRR compared to copper and tungsten electrodes. As for surface roughness, it was shown that for all electrode materials, machined workpiece surface roughness increases with increasing peak current. Among three electrodes, copper has the best performance with regard to surface finish. A similar study was done by Singh et al. [7] whereas only different types of electrodes were used. They studied brass, copper, aluminum, and copper-tungsten electrodes to investigate the EDM machining of hardened tool steel. The results showed that aluminum electrodes offer high material removal rate with the increase in discharge current compared to copper-tungsten and brass electrodes. Another conclusion of their study is that copper–tungsten electrode
8
gives low surface roughness at high discharge currents whereas copper and aluminum electrode resulted in poor machined surfaces at high currents.
2.3.2. Polarity
In EDM process, the choice of electrode polarity is another significant factor affecting the energy dissipation between anode and cathode. In die sinking EDM process, polarity of the tool is usually positive. Polarity is usually changed into negative during finishing. Lee and Li [6] have obtained higher material removal rate and lower relative wear ratio by using using negative electrode polarity in machining tungsten carbide. Besides, they achieved better surface finish with negative electrode polarity. Thus, since material removal rate and surface finish are the crucial factors on maching performance, their study shows that in machining tungsten carbide, the use of negative electrode polarity is more desirable. Wu et al. [8] have studied to improve of surface finish on steel with aluminum. They obtained poor surface roughness with negative polarity workpiece and positive polarity electrode. This is due to the fact that the discharge current generated in EDM is created by ion and electron flows. The proportion of ion flow increases with the pulse duration time. Therefore, the ion flow causes a inferior surface roughness. So, they have concluded similar results compared to Lee and Li [6].
2.3.3. Pulse Duration
Energy input in EDM process is directly proportional to the pulse duration. Thus, it has a great effect on EDM machining performance. Figure 2.2 shows voltage and current waveforms in EDM operations. When the process starts, the open voltage Uo is applied between the tool electrode and workpiece, but discharge does not occur immediately but occurs after the ignition delay time, td.
9
Figure 2.2 Voltage and Current waveforms in EDM operations [4]
This time lag is due to dielectric breakdown which initial electrons are generated in the gap, and then accelerated to generate the electron avalanche. After the dielectric breakdown, a discharge current, ie, occurs through the gap. Lee and Li [6] investigated the effect of the pulse duration on material removal rate and surface finish for various peak current settings. It is found that material removal rate consistently increases with increasing of pulse duration. On the other hand, decrease in material removal rate is observed with a pulse duration longer than 100 ms. This is due to the fact that insufficient pulse interval results in bad discharge. Similar effect of pulse duration is observed on surface roughness. Surface rougness increased with increasing pulse duration, this is because higher pulse duration means large amounts of energy which cause generation of large craters.
2.3.4. Peak Current
Lee and Li [6] showed that in low current settings, the material removal rate increases with the increase of the peak current for all values of pulse duration, then metal removal rate becomes constant at higher values of peak currents. Besides that, it was also observed that surface roughness of the workpiece increases steadily with increasing peak current.
10 2.3.5. Capacitance
Lim et al. [9] investigated different methods to fabricate a thin electrode into the desired dimension. The performance of the micro-EDM process in their study is evaluated in terms of the material removal rate (MRR) and the stability of the machining. They showed that more material is removed as capacitance value increases. Besides, it was emphasized that capacitance is one of the major parameters for the stability of the machining; therefore capacitance should be optimized for micro-EDM process. Liao et al. [10] attempted to achieve a fine surface finish in wire-EDM process and they identified that machining voltage, type of pulse-generating circuit and capacitance are the significant parameters affecting the surface roughness. They also showed that surface quality gets worse as capacitance increases. Simao et al. [11] studied the workpiece surface medication using electrical discharge machining and showed that the capacitance has the most influence on material removal rate compared to the voltage, peak current and electrode polarity. Additionally, it has a significant effect on workpiece surface roughness which gets worse with increasing of capacitance. Mao et al. [12] studied on micro electrical discharge machining of small hole and investigated the effect of capacitance on hole diameter. They have showed that as capacitance increases, the discharge gap and the hole diameter increase whereas the roundness of small holes is better.
2.4. Fabricating micro tools using EDM methods
2.4.1. Wire electro discharge grinding (WEDG)
Wire electro discharge grinding (WEDG) is known to be the most common technique to fabricate micro tools into various shapes. The principle of this technique, proposed by
11
Masuzawa [13], is illustrated in Figure 3.3. A rotating wire is used to erode the tool material where the tool is given positive polarity and the wire has negative polarity. Therefore, the aim is to erode the tool instead of the wire. Dielectric fluid is maintained between the wire and the tool in order to initiate and maintain sparks during EDM process. A specific tool path needs to be determined by the user depending on the final shape of the micro tool. In order to obtain symmetric tool shapes, the tool is rotated. It is also possible to obtain asymmetric shaped tools. In this case, tools follow the paths without rotating.
Figure 2.3 WEDG method to fabricate micro tools [13]
Using this technique meets many advantages. WEDG provides high accuracy and good repeatability with the error of less than 1µm. Many materials are successfully machined into a diameter of less than 15µm. In addition to these advantages, it can be used to make a variety of thin shapes, such as electrodes for EDM, punches, electron emitters, needle shaped parts, and so on. In another way, WEDG can act as lather except that the material is removed by erosion with electrical discharges. However, WEDG has a low material erosion rate. Therefore, this technique is particularly suitable for finishing.
12
By using WEDG method, Egashira and Mizutani [14] have fabricated D-shape micro tools to drill monocrystalline silicon. Fabrication process of the tool and the tool obtained after this processes is demonstrated in Figure 2.4 (a) and (b), respectively.
(a)
(b)
Figure 2.4 Fabrication process of the tool [14]
They have emphasized at the end of the their study that WEDG method is suitable for micro-tool fabrication owing to the short machining time and small machining force. Morgan et al. [15] prepared PCD tools in a variety of shapes via WEDM, WEDG, and µEDM. Wire EDM has been used to fabricate cylindrical tools which have 1 mm diameter. To reduce the diameter of fabricated cylindrical tools from 1mm to 50 µm, WEDG method has been used and as final step µEDM has been used to improve the geometric accuracy of the cutting surface. Fabricated tools have been effectively used to micro machine glass in a ductile mode so that they showed that the flexibility of this
13
three-step process enables a variety of tool shapes and sizes that can subsequently be used to mill grooves and pockets. In figure 2.5 shows the conical tipped PCD tool and typical groove machined in soda-lime glass by using conical PCD tool.
Figure 2.5 Micro conical tool and groove machined in soda-lime glass [15]
Fleisher et al. [16] have fabricated micro tool geometry as shown in figure 2.6. The one tooth micro tool has a diameter of 100 µm, and it has a more complex geometry compared to previous micro tools fabricated via WEDG method.
14
Cheng et al. [17] have focused on design and development of the micro ball end mill for micro machining of hard and brittle materials. Negative rake angle is designed for new ball end mill in order to get ductile mode machining efficiently for brittle materials and increasing the strength of the cutting edge. Designed and fabricated PCD tool by means of WEDM is shown in figure 2.7 and figure 2.8, respectively.
Figure 2.7 3D solid models [17]
Figure 2.8 Fabricated PCD micro ball end mill [17]
2.4.2 Block-EDM processes
Recently, Rahman et al. [18] used a pure tungsten block as a sacrificial electrode to erode PCD and WC tool materials to obtain micro cutting tools. Higher contact area of the tool in block-EDM yields faster tool material erosion rate than the WEDG method. However, maintaining the dimensional accuracy of the EDMed rod is straightworward
15
since the block also wears out during the process. On the other hand, compared to WEDG technique, dimensional change of the sacrificial electrode in WEDG has almost never effect on high-accuracy for designed micro tools due to use of continuous fresh wire.
Figure 2.9 Block-EDM method [18]
In present study, block-EDM technique is used for rough electro discharge machining which is followed by a finish electro discharge machining on WEDG for the fabrication of micro ball end mills. Experimental studies have been carried out on block-EDM method to analysis of the effect of machining parameters on material removal rate and surface roughness under various conditions. Conducted experimental study is given with details in the next section. Fabrication of different geometry cutting tools by means of block-EDM method has been carried out for micro grinding of BK7 glass by Perveen et al. [19].
16
Figure 2.10 Cutting tools in different geometries [19]
Takeshi et al. [20] have fabricated spherical PCD tool via micro-EDM method in order toaccomplish the microshape grinding of micro-free form surfaces and the capabilities of the grinding process by using the spherical PCD tool was investigated. Figure 2.11 demonstrates the both fabrication method (where pin gauge made of WC is used as tool electrode) of spherical poly crystalline diamond and obtained spherical PCD tool after applied fabrication method.
17
They have fabricated PCD tools under different process parameters which are tested in point processing where the surface roughness of the grinded area is determinative factor. They have observed that the area grinded by PCD tool fabricated lowest process parameter shows higher quality compared to other area grinded by the other PCD tools. Following test is to forming a flat plane with the PCD tool which gave the good performance at the test regarding grinding. They have succeeded to get surface roughness as to be 5 nm in Ra where the Rz is equal to 28 nm. Recently, they have observed that capability to shape a micro concave cylindrical surface and a micro convex spherical surface on tungsten carbide, silicon and alumina ceramic with spherical PCD tool is satisfied.
2.5. Process Planning
Special wire electro discharge machinig method (WEDM) for micro milling is not taken into consideration by the computer-aided manufacturing (CAM) systems available in the market. Additionally, CAM programs in the markets are limited in application of electro discharge machining. Hence, lack of that extented applications in CAM programs regarding EDM is engaged interest among researches and they have developed and proposed several CAM programs to literature.
Cheng et al. [21] have developed a computer assistant system tools for the multi-axis WEDM machine in order to generate the NC programs automatically which is used in fabrication of micro milling tools. Based on the CAM database, micro/nano milling tool geometries, default machining conditions, machine tool specifications and the controller properties can be selected or modified. Based on the CAM database that they developed, micro/nano milling tool geometries, default machining conditions, machine tool specifications and the controller properties can be selected. Hence, appropriate fabrication code with respect to entered datas is generated. They have showed that NC
18
program with high efficiency and high accuracy can be generated automatically by CAM system. Figure 2.12 shows a userform regarding tool geometry definition available into developed CAM program.
Figure 2.12 User form related to tool geometry definiton [21]
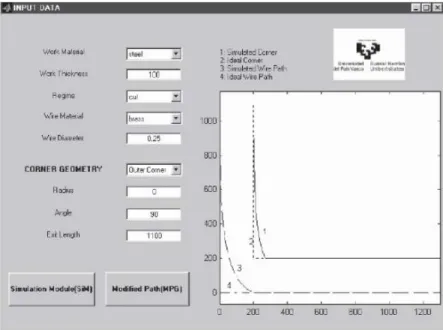
Sanchez et al. [22] have developed computer-integrated system for WEDM. Aim of developed computer assistant system is to enhance the corner cutting performance based on experimental knowledge of the process and numerical simulation. User may select the appropriate cutting strategy either by path modification or by cutting parameter modification. User selects path modification when productivity is main concern. If high accuracy is main concern then user will select cutting parameter modification. The modification of the cutting parameters at the corner aims at reducing the value of the ‘wire-lag’ by modified the parameters corresponding to lower cutting forces are related to lower cutting speeds. Wire path modification strategy aims at generating an alternative path in which the cutting parameters are not changed and the cutting speed can be maintained at its maximum value. They have tested the developed system
19
through a series of case studies which show the improvements in accuracy and productivity with respect to the commonly used strategies. Developed user interface of the system is demonstrated in Figure 2.13.
20
Chapter 3
Experimental Setup and Methodology
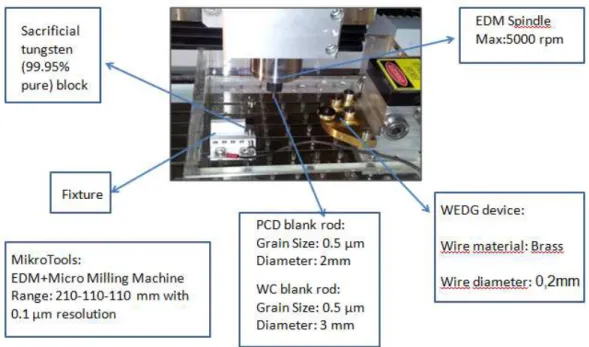
A multi-purpose miniature machine tool (DT 110, MIKROTOOLS) is used for conducting the block and wire EDG processes on both WC and PCD tool materials. Figure 3.1 gives schematic diagram of experimental setup with multi-purpose miniature machine tool.
21
As it can be seen from Figure 3.1, experimental setup is capable of performing both wire EDM, wire EDG and block EDM on the same setup. The electrode or the micro tool in our case is attached to the spindle and then EDM process is performed until the required shape on the tool is obtained. As mentioned earlier, rough macihining of tool material is performed on block for faster material removal rate and WEDG is used for better surface finish and better geometry control. In this study, tungsten carbide (WC) and polycrystalline diamond (PCD) tool materials are studied. Commercially available tungsten carbide (WC) and polycrystalline diamond(PCD) with 5 micron grain size are investigated in this study. The properties of tungsten carbide (WC) and polycrystalline diamond (PCD) are shown in table 3.1 and 3.2.
Table 3.1 Properties of the tungsten carbide Density ( g/cm3 ) Melting Point (°C) Thermal Conductivity Thermal Expansion coefficient Young's modulus (GPa) 15.63 2870 °C 84.02 W· m−1·K−1 5.8 µm·m−1·K−1 550
Table 3.2 Properties of the polycrystalline diamond Density ( g/cm3 ) Melting Point (°C) Thermal Expansion Coefficient (K−1) Max.Compressive Strength(Mpa)
Max. Heat Fusison (kJ/kg)
15.63 2870 °C 5.8x10⁻⁶ 6833 560
Pure tungsten (99.9%) is used as a sacrificial electrode in block-EDM process due to its high melting temperature. Brass wire of 200µm in diameter is used in WEDG process. The properties of these materials are given in table 3.3 and 3.4.
22
Table 3.3 Physical properties of the pure tungsten Density ( g/cm3 ) Melting Point (°C) Heat of vaporization (kJ.mol-1)
Thermal conductivity Heat Fusion (kJ.mol-1)
19.25 3422 °C 806.7 173 W·m−1·K−1 35.3
.
Table 3.4 Physical properties of the brass Density ( g/cm3 ) Melting Point (°C) Thermal Expansion Coefficient (K−1) Ultimate Strength(MPa) 8,4 940 18,7 550
Oil is used as dielectric fluid which has high flash point and low viscosity The EDM oil serves both the purpose of dielectric during WC and PCD tool fabrication. Properties of the oil (EDMfluid 108 MP-S) are shown in table 3.5.
Table 3.5 Properties of the EDMfluid 108 MP-S
Material Density (kg/l) Flash point (°C) Aromatic hydrocarbon Distillation range IBP/FBP Kinetic viscosity at 20°C 108 MP-S 0.767 108 0,001 245/250 3 cSt
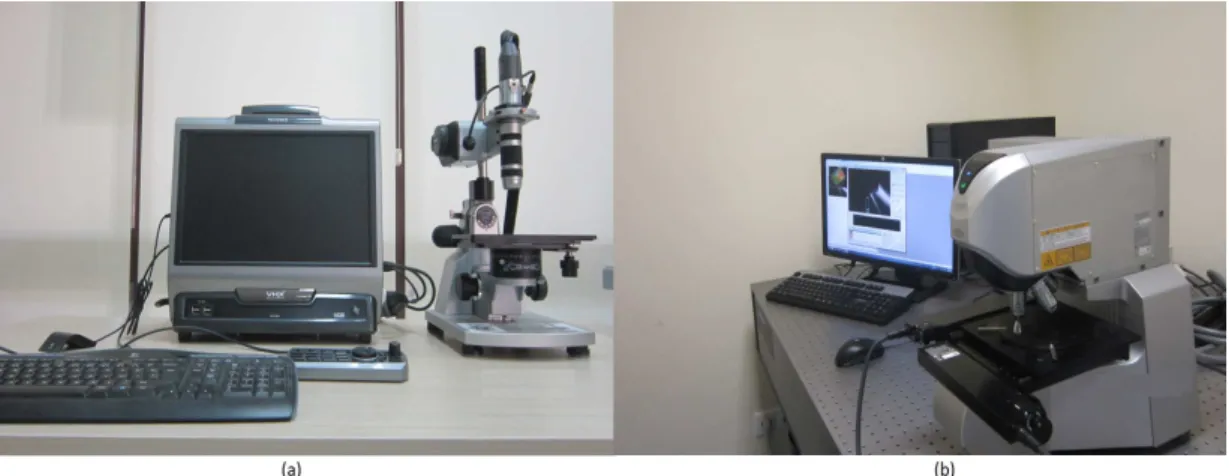
Analysis of the fabricated tools have been done by using the VHX-1000 digital microscope and VK-X100 3D laser scanning microscope. VHX-1000 digital microscope
23
serves to take 3D images of the fabricated tools and to analyze the accuracy of the fabricated tool. Detailed surface topography analysis includes measuring surface roughness, detecting craters on surface of the tools and measurement of cutting edge radius has been done with VK-X100 3D laser scanning microscope. The figure 3.2(a) and (b) shows VHX-1000 digital microscope and VK-X 3D laser scanning microscopes.
Figure 3.2 General views both VHX-1000 digital and VK-X100 3D laser scanning microscopes.
Ultrasonic Cleaner is a device which uses high frequency sound waves removes almost all kinds of contamination, including those of EDM debris, dielectric fluid and so on. Thus, an ultrasonic cleaner (Quantrex) has been used for cleaning the WC rods before and after EDMing to ensure accurate measurements. After completing the cleaning operation of the rods, all of the rods are weighed by using analytical balance (Mattler Toledo- NS204S) before and after EDMing. Figure 3.3 (a) and (b) demonstrates each procedure, respectively.
24
25
Chapter 4
Experimental Investigation of Influence of
EDM Parameters on Process Outputs
In design of experiments approach, significant changes are made to the input variables of a process and process outputs are observed with the goal of identifying the reasons for these changes in the output response. In present investigation, a full factorial design has been implemented for detecting the effects of process parameters on the EDM process performance. One of the advantages of that design is that, user can get maximum information regarding the factors and interactions between separate experiment factors can also be identifed. However, as the number of factors increases, the number of required experiments increases. It is reasonable to use full factorial designs with two levels as initial analysis of process variables. Once the significant process variables are identified, a more detailed experimental analysis can be conducted to obtain more information about the process. Process optimization can be conducted based on the details experimental results.
In this study, experiments have been carried out on tungsten carbide (WC) tools as two separate sets. WC blank tools have diameter of 3 mm which will be EDMed to couple hundred microns. The first set of experiments were performed on the 3mm diameter. The second set of experiments were performed on WC tools with round 0,75 mm diameter. The reason for this separation is that the duration of EDM process from initial to final diameter is very long. Experiments have been repeated three times to
26
have reliable and verifiable data at each experimental condition and totally 24 experiments have been conducted. Data obtained from each experiment were analyzed by MINITAB 16 software. The machining factors used are capacitance, voltage and rotational speed of electrode. Process outputs are considered as the material removal rate (MRR) and surface roughness (Ra) at the end of the process. To calculate the material removal rates, following equation has been used. Surface roughness is measured with laser scanning microscope.
Time Machining Weigth Electrode Eroded gr MRR( /min) = (1)
4.1. Experimental analysis of EDM process parameters on MRR of macro scale tools
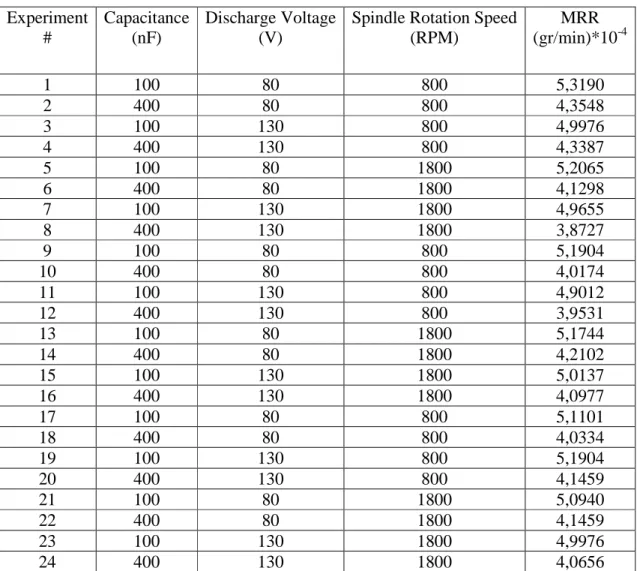
Experimental results presented in this section were performed on WC tools having a 3mm diameter using the block EDM method. Table 4.1 shows the 23 full factorial experimental design. Each experimental case is repeated three times. Experiments were performed randomly. At the beginning of the test, the weight of the tool was measured. The eroded weight of the material was measured after each test. The duration of EDM process was also recorded using a stopwatch. The material removal rate for each case is calculated using Equation (1). A different blank material from the same tool manufacturer was used in each experiment. The MRR results are also shown in Table 4.1.
27
Table 4.1 Design matrix of experiments and responses for milimeter scale tools Experiment # Capacitance (nF) Discharge Voltage (V)
Spindle Rotation Speed (RPM) MRR (gr/min)*10-4 1 100 80 800 5,3190 2 400 80 800 4,3548 3 100 130 800 4,9976 4 400 130 800 4,3387 5 100 80 1800 5,2065 6 400 80 1800 4,1298 7 100 130 1800 4,9655 8 400 130 1800 3,8727 9 100 80 800 5,1904 10 400 80 800 4,0174 11 100 130 800 4,9012 12 400 130 800 3,9531 13 100 80 1800 5,1744 14 400 80 1800 4,2102 15 100 130 1800 5,0137 16 400 130 1800 4,0977 17 100 80 800 5,1101 18 400 80 800 4,0334 19 100 130 800 5,1904 20 400 130 800 4,1459 21 100 80 1800 5,0940 22 400 80 1800 4,1459 23 100 130 1800 4,9976 24 400 130 1800 4,0656
The ANOVA table (Table 4.2) gives a summary of main effects and interactions of factors on the process outputs based on 95% confidence level (α = 0.05). Based on the ANOVA, both capacitance and voltage are significant whereas the effect of rotational speed is insignificant as evident from P values. P-value measures how likely the sample results are, assuming the null hypothesis is true. A small (<0.05), a commonly used level of significance, p-value indicates significant factors in ANOVA analysis.
28
Table 4.2ANOVA result
Source DF Seq SS*10-8 Adj SS*10-8 Adj MS*10-8 F P Main Effects 3 6,00664 6,00664 2,0002 144,81 0,000 Capacitance 1 5,89734 5,89734 5,89734 426,52 0,000 Voltage 1 0,09983 0,09983 0,09983 7,22 0,016 Rpm 1 0,00947 0,00947 0,00947 0,68 0,420 2-Way Interactions 3 0,01590 0,01590 0,01590 0,38 0,766 Capacitance*Voltage 1 0,01079 0,01079 0,01079 0,78 0,390 Capacitance*Rpm 1 0,00006 0,00006 0,00006 0,00 0,949 Voltage*Rpm 1 0,00505 0,00505 0,00505 0,37 0,554 3-Way Interactions 1 0,00709 0,00709 0,00709 0,51 0,484 Capacitance*Voltage*Rpm 1 0,00709 0,00709 0,00709 0,51 0,484 Residual Error 16 0,22123 0,22123 0,01383 Pure Error 16 0,22123 0,22123 0,01383 Total 23 6,25086
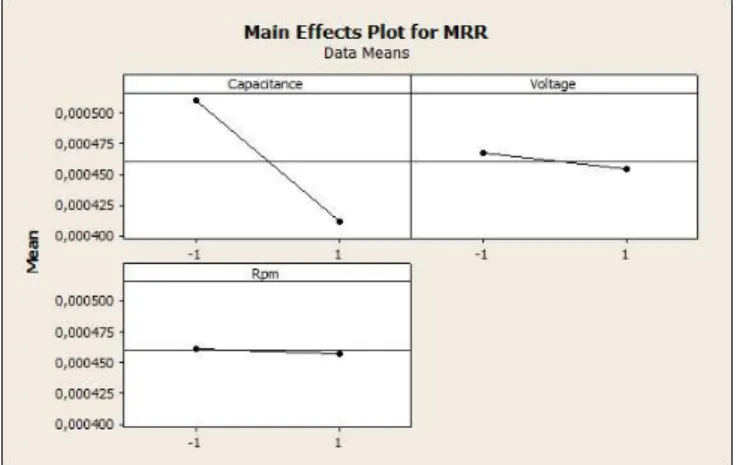
Main effects plots offer a quick and efficient way to observe the influence of each factor for low and high levels. The grand mean is plotted as a horizontal line. The average result is represented by dots for each factor level. Factors with steeper slopes have larger effects and thus larger impacts on the results.
The main effects plot is shown in Figure 4.1. There is an inverse relationship between the MRR and factor levels. In other words, changing factor levels from -1 to +1 for each parameter result in the decrease of the material removal rate (MRR). Therefore, factor levels at lower level give the highest material removal rate. In that manner, suitable parameter set is achieved when capacitance voltage and RPM are equal to 100nF, 80V and 800 RPM, respectively. It must be noted that the voltage and capacitance values can be set lower than those in our experimental setup. Rotational speed is not included in the analysis based on ANOVA results.
29
Figure 4.1 Main effects plot for the tools having diameter 3mm
ANOVA requires the population in each treatment where the samples are drawn is normally distributed. It can be checked with a normal probability plot of residuals. If the distribution of residuals is normal, the plot will resemble a straight line. Ryan-Joiner normality test can also be performed to check whether the residuals come from normal distribution or not. According to Figure 4.2 obtained after normality test (Ryan –Joiner normality test is applied) it is concluded that residuals come from a normal distribution since the p-value is greater than 0.05
30
Another ANOVA assumption is that, the variance of the observations in each treatment should be equal. Bartlett’s test is performed to check whether variance is constant or not. If p-value obtained by Bartlett’s test is larger or equal to α-level (0.05) then it is concluded that variance of residuals is constant and not violated (it is seen that p-value = 0.714> 0.05). Figure 4.3 shows the results obtained after Bartlett’s test.
Figure 4.3 Test for equal variances for residuals for milimeter scale tools
ANOVA requires that the observations should be randomly selected from the treatment population. The independence, especially of time-related effects, can be checked with the Residuals versus Order (time order of data collection) plot. A positive correlation or a negative correlation means the assumption is violated. If the plot does not reveal any pattern, the independence assumption is satisfied. Figure 4.4 shows the observation order where the response is MRR.
31
Figure 4.4 Observation order for MRR experiments of milimeter scale tools.
4.1.1 Regression model
Regression analysis is a mathematical technique for investigating and modeling the relationship between variables. Thus, by regression analysis, mathematical models relating to the machining performance to various machining parameters can be established. A linear model can be used to express the relationship between MRR and process parameters as in Equation (1) [23]. Since rotational speed in not significant on the material removal rate, it is not considered in the regression analysis.
MRR = 0,0004601 - 0,0000495704 Capacitance - 0,0000644958 Voltage (1)
P values in Table 4.3 tell whether or not the association between the response and predictor is statistically significant. If the p-value is smaller than α-level(0.05), then the association is statistically significantly. The p-values in table 4.3 for the estimated coefficients of capacitance and voltage are both 0.000 and 0.009, respectively, indicating that they are significantly related to MRR.
32
Table 4.3 Regression coefficients
Predictor Coef SE Coef T P
Constant 0,0004601 0,0000022 205,080 0,000
Capasitance -0,0000496 0,0000022 -22,095 0,000
Voltage -0,0000064 0,0000022 -2,875 0,009
S =0,0000109909 R-Sq = 95,94% R-Sq(adj) = 95,56% R-Sq(pred) = 94,70%
R-squared value (R2) indicates that the predictors explain 95,94% of the variance in MRR and adjusted R2 for the number of the predictors in the model found as 95.56%. Both values indicate that the model fits the data well. Predicted R-squared is used in regression analysis to indicate how well the model predicts responses for new observations. The predicted R2 value is 94,70%. Because the predicted R2 value is close to the R2 and adjusted R2 values, the model does not appear to be overfitting and has the adequate predictive ability.
Table 4.4 Analysis of variance for tools in millimeter scale tools
Source DF SS MS F P
Regression 2 5,99718E-08 2,99859E-08 248,23 0,000
Residual 21 2,53682E-09 1,20801E-10
Total 23 6,25086E-08
The p-value in the Analysis of Variance table (0.000) shows that the model estimated by the regression procedure is significant at a level of 0.05. This indicates that at least one coefficient is different from zero.
4.2. Effect of process parameters on MRR for tools in micron level
Experiments have been conducted by using the tools with initial diameters between 775 and 780 micron and results of the material removal rate experiments are studied by using ANOVA. The design matrix of experiments and responses are shown in table 4.5. EDM
33
dielectric fluid acts as a semiconductor between the electrode and workpiece to facilitate a stable and controlled spark gap ionization condition. Beside that, the EDM dielectric fluid also acts as a flushing agent to wash and remove the eroded debris from the spark gap area. As the fluid ages and breaks down, it loses dielectric strength and its semiconductor capabilities. Therefore, it can no longer provide consistent or repeatable semiconductor control to the spark gap, which directly affects machine performance. Hence, EDM dielectric fluid from the previous experimental study has been replaced with the fresh oil.
Table 4.5 Design matrix of experiments and responses for micron scale tools Experiment # Capacitance (F) Voltage (V)
Spindle Rotation Speed (RPM) MRR (gr/min)*10-4 1 10nF 80 800 0,696 2 100nF 80 800 0,842 3 10nF 130 800 0,769 4 100nF 130 800 0,879 5 10nF 80 1800 0,733 6 100nF 80 1800 0,806 7 10nF 130 1800 0,806 8 100nF 130 1800 0,842 9 10nF 80 800 0,733 10 100nF 80 800 0,879 11 10nF 130 800 0,806 12 100nF 130 800 0,916 13 10nF 80 1800 0,659 14 100nF 80 1800 0,806 15 10nF 130 1800 0,769 16 100nF 130 1800 0,879 17 10nF 80 800 0,733 18 100nF 80 800 0,806 19 10nF 130 800 0,806 20 100nF 130 800 0,916 21 10nF 80 1800 0,696 22 100nF 80 1800 0,842 23 10nF 130 1800 0,769 24 100nF 130 1800 0,879
34
Figure 4.5 Normal plot of the standardized effects of micron scale tools
As seen figure 4.5, capacitance, voltage and spindle speed are found to be effective factors on MRR.
Figure 4.6 Main effects plot for micron scale tools
As seen from the figure 4.6, capacitance and voltage have a positive relationship with the MRR. Changing factor levels of both capacitance and voltage -1 to +1 will be resulted in the increase of material removal rate (MRR). This is an expected result since
35
high voltage results in high thermal loading. Thus, it increases the energy of a single discharge to facilitate the action of melting and vaporization of the electrode and workpiece which results in higher amounts of material being removed from the both of them and hence leads to high MRR. On the other hand, there is an inverse relationship between the MRR and RPM. This is the most likely result of the instability of spark at this stage; the spark produced at this stage cannot concentrate directly to the closest point of the workpiece. This results in shallower crater formation which in turn gives low MRR. So, with respect to analysis most appropriate process parameters for material removal rate are achieved when capacitance, voltage and RPM are equal to 10nF, 130V and 800 RPM, respectively.
Table 4.6 Analysis of variance for MRR experiments of micron scale tools (coded units)
Source DF Seq SS*1010 Adj SS*1010 Adj MS*1010 F P Main Effects 3 10,2897 10,2897 3,42992 50,67 0,000 Capacitance 1 7,2270 7,2270 7,2270 106,77 0,000 Voltage 1 2,7001 2,7001 2,7001 39,89 0,000 Rpm 1 0,3626 0,3626 0,3626 5,36 0,034 2-Way Interactions 3 0,1098 0,1098 0,1098 0,54 0,661 Capacitance*Voltage 1 0,0876 0,0876 0,0876 1,29 0,272 Capacitance*Rpm 1 0,0222 0,0222 0,0222 0,33 0,575 Voltage*Rpm 1 0,000000 0,000000 0,000000 0,00 0,994 3-Way Interactions 1 0,0234 0,0234 0,0234 0,35 0,564 Capacitance*Voltage*Rpm 1 0,0234 0,0234 0,0234 0,35 0,564 Residual Error 16 1,0830 1,0830 0,06769 Pure Error 16 1,0830 1,0830 0,06769 Total 23 11,5060 11,5060
The analysis of variance table gives a summary of the main effects and interactions. The p-values less than α-level (0.05), indicate that all of the main factors are significantly related to MRR.
36
4.2.1 Regression Analysis of the Tools in Micron Levels
Analysis of the residuals of the model shown in equation 2 was performed to test assumptions of normality (fig. 4.7), constant variance (fig 4.8) and independence (fig 4.9) of residuals.
MRR= 0,0000802792 + 0,0000054875 Capacitance + 0,00000335417 Voltage - 0,00000122917 Rpm (2)
Figure 4.7 Main effects plot for 0.75 mm tools
After performing Ryan-Joiner normality test shown in figure 4.7, since p-value is greater than 0.05 then it is possible to state that residuals comes from normal distribution so it is possible to apply Bartlett’s test to check whether variance is constant or not. Figure 4.8 demonstrates the results which are obtained after Bartlett’s test.
37
Figure 4.8 Equal variances for residuals
So, with respect to figure 4.8, since p-value = 0,972> 0.05 then it is concluded that variance is constant and not violated. Durbin-Watson statistic has been used to check whether the autocorrelation exists in the residuals or not. The Durbin-Watson statistic ranges in value from 0 to 4. A value near 2 indicates non-autocorrelation; a value significantly below 2 indicates positive autocorrelation and values significantly above 2 indicates negative autocorrelation [24]. “d“ value is obtained as 2,32839 in Minitab software. So, we can say that the presence of autocorrelation does not exist in the residuals from a regression analysis. So, all assumptions are satisfied. Figure 4.9 shows the observation order where the response is MRR.
38
Figure 4.9 Observation order
The p-values in table 4.7 for the estimated coefficients of capacitance, voltage and RPM are 0.000, 0.000 and 0,024, respectively, indicating that they are significantly related to MRR.
Table 4.7 Regression coefficients
Predictor Coef SE Coef T P
Constant 0,0000802792 0,0000005 159,482 0,000
Capacitance 0,0000054875 0,0000005 10,901 0,000
Voltage 0,00000335417 0,0000005 6,663 0,000
Rpm -0,00000122917 0,0000005 -2,442 0,024
S = 0,0246602E-06 R-Sq = 89,43% R-Sq(adj) = 87,84% R-Sq(pred) = 84,78%
R-squared value (R2) indicates that the predictors explain 89,43% of the variance in MRR and adjusted R2 for the number of the predictors in the model was found as %87,6. Both values indicate that the model fits the data well. The predicted R2 value is 84,78%. Because the predicted R2 value is close to the R2 and adjusted R2 values, the model does
39
not appear to be overfit and has adequate predictive ability. Analysis of variance was carried out for the regression model as well and the results are presented in table 4.8.
Table 4.8 Analysis of variance
Source DF SS MS F P
Regression 3 1,02897E-09 3,42992 E-10 56,40 0,000
Residual 20 1,2162E-10 6,08125 E-12
Total 23 1,15060 E-09
The p-value in the Analysis of variance table (0.000) shows that the model estimated by the regression procedure is significant at an a-level of 0.05.
4.3. Effect of process parameters on surface roughness
Surface roughness is crucial to the quality and performance of the finished products. Beside that, it is also economical and desirable to finish parts without further grinding and polishing operations to meet required finish tolerances. It is known that the surface roughness of the electrode tool also affect the surface quality of machining parts. Thus, fabrication of high aspect ratio tools with high surface quality is important.
In this study, a 3 milimeter diameter tungsten carbide electrode was used to investigate the surface roughness of fabricated tools again by controlling three machining parameters such as capacitance, voltage and rotational speed. Analysis of variance (ANOVA) is used to figure out the effects of the main parameters and their interactions on surface roughness. Figure 4.10 shows the surface pictures after each experimental case. Each surface was measured from four different location around the diameter of the rod.
40
Figure 4.10 Surface profiles under exp 1 (800rpm,80V,1000pF) at four different locations on the periphery of the rod.
41
Figure 4.11 Photos of the surfaces after EDM operation. Experimental conditions : (a)800rpm,80V,1000pF, (b) 1200rpm,80V,1000pF, (c) 800rpm,130V,1000pF, (d)
1200rpm,130V,1000pF, (e) 800rpm,80V,10nF, (f) 1200rpm,80V,10nF, (g)800rpm,130V,10nF, (h) 1200rpm,130V,10nF
42
Meausured surface roughness values are shown in Table 4.9.
Table 4.9 Design matrix of experiments and responses for surface response Exp.no Spindle Rotation Speed (RPM) Discharge Voltage(V) Capacitance(F) Ra (nm) 1 800 80 1000pF 299 2 1200 80 1000pF 321 3 800 130 1000pF 363 4 1200 130 1000pF 369 5 800 80 10nF 688 6 1200 80 10nF 499 7 800 130 10nF 679 8 1200 130 10nF 804 9 800 80 1000pF 381 10 1200 80 1000pF 306 11 800 130 1000pF 385 12 1200 130 1000pF 359 13 800 80 10nF 627 14 1200 80 10nF 605 15 800 130 10nF 660 16 1200 130 10nF 697 17 800 80 1000pF 317 18 1200 80 1000pF 312 19 800 130 1000pF 379 20 1200 130 1000pF 371 21 800 80 10nF 566 22 1200 80 10nF 620 23 800 130 10nF 655 24 1200 130 10nF 750 25 800 80 1000pF 350 26 1200 80 1000pF 348 27 800 130 1000pF 371 28 1200 130 1000pF 410 29 800 80 10nF 645 30 1200 80 10nF 550 31 800 130 10nF 680 32 1200 130 10nF 665
43
Table 4.10 Analysis of variance for surface roughness (Ra)
Source DF Seq SS Adj SS Adj MS F P
Main Effects 3 747158 747158 249053 169,36 0,000 Rpm 1 109 109 109 0,07 0,788 Voltage 1 42268 42268 42268 28,74 0,000 Capacitance 1 704781 704781 704781 479,25 0,000 2-Way Interactions 3 15457 15457 5152 3,50 0,031 Rpm *Voltage 1 9976 9976 9976 6,78 0,016 Rpm * Capacitance 1 48 48 48 0,03 0,859 Voltage* Capacitance 1 5434 5434 5434 3,70 0,067 3-Way Interactions 1 5592 5592 5592 3,80 0,063 Rpm*Capacitance*Voltage 1 5592 5592 5592 3,80 0,063 Residual Error 24 35294 35294 1471 Pure Error 24 35294 35294 1471 Total 31 803501
With respect to ANOVA table 4.10, the p-values less than alpha-level indicate that all of the main factors are significantly related to MRR, thereby the p-values for the both Capacitance and Voltage (0.000) are significant at alpha = 0.05 significance level whereas RPM is found to be insignificant factor on surface roughness.
According to figure 4.12, it is seen that most effective paramater on surface roughness is capacitance followed by voltage. Additionally, changing factor levels -1 to +1 for main effective parameters results in the increase of the surface roughness (MRR). It is seen that an increase in voltage results in increase in Ra. This is because as the voltage increases, discharges strike the surface of the workpiece more intensely which results in larger cavities that leads to a deterioration of the surface roughness.
44
Figure 4.12 Main effects plot for surface roughness (Ra)
4.3.1 Regression Analysis for the Surface Roughness
Analysis of the residuals of the model shown in equation (3) was performed to test assumptions of normality (Figure 4.8), constant variance (Figure 4.9) and independence (Figure 4.10) of residuals.
Ra = 500,969 + 36,3438 Voltage + 148,406 Capacitance + 17,6562 Voltage*Rpm (3) Table 4.11 Regression coefficients
Predictor Coef SE Coef T P
Constant 500,969 7,20213 69,5584 0,000
Capacitance 148,406 7,20213 20,6059 0,000
Voltage 36,344 7,20213 5,0463 0,000
Voltage*Rpm 17,656 7,20213 2,4515 0,021
45 4.4 Interpretation of the experimental results
It is concluded that voltage and capacitance play an important role in the performance of EDM machining in which performance is determined by both material removal rate and surface roughness. Figure 4.13 shows the relationships between the response and input variables for micron scale tools.
Figure 4.13 MRR versus capacitance and voltage for the tools in micron level
Increasing values of voltage and capacitance results in increase in material removal rate as expected. However, in millimeter scale tools, increase in capacitance and voltage value results in decreasing material removal rate as shown in Figure 4.14.
46
Figure 4.14 MRR versus capacitance and voltage for the tools in milimeter level
It is believed that when the tool diameter increases the gap between the electrode and tool becomes hard to reach during flushing of the debris away. This causes unstable machining conditions and as a result reduces the material removal rate. It also shows the difference between micro and macro scale EDM operations. It must be noted that these results are specific to our EDM machine and setup. A different EDM machine with better flushing capability would have performed differently.
47
The typical morphology of an EDMed surface is caused by the huge amount of heat generated by the discharges, which causes melting and vaporization of the material, followed by rapid cooling. It is seen from the graph above that as voltage and capacitance are increased, Ra value increases. This is due to the fact that increasing of voltage and capacitance results in increase the energy in each spark. This increases the width and depth of the cracks that are formed on the micro-EDMed surface, and therefore, much molten metal is produced. The molten metal that is not flushed away by the dielectric undergoes rapid solidification and forms a randomly distributed series of overlapping craters. Hence, it leads increasing of the surface roughness. Best combination of process parameters which give high material removal rate have obtained by analyzes have been put into the MRR regression model to predict machining time. This evaluation is explained below. In determining the expected machining time for the tools in micron level suitable parameter set giving high MRR are used (namely +1 for capacitance and voltage and -1 for RPM). We have put these values into obtaining regression model shown in the equation below:
MRR = 0,0000802792 + 0,0000054875 Capacitance + 0,00000335417 Voltage - 0,00000122917 Rpm
= 0,0000802792 +(0,0000054875 *1)+ (0,00000335417 *1)-(0,00000122917 * -1) =0.00009035 (gr/min)
Suppose the diameter of the tool is reduced to 0.9 mm from 1 mm then reduction in volume of the tools can be calculated as follows :
Volume= π*(r12 - r12)*h
= π *((1/2)2 - (0,9/2)2)*1 = 0,149mm3
48
To get the mass of the eroded part can be obtained by considering the density (0,01563 gr/mm3) of the tungsten carbide tool (WC):
Mass= Volume * DWC
= 0,149mm3 * 0,01563 gr/mm3 = 2.3289*10-3 gr
Therefore, the machining time can be estimated as: Time(min)= 2.3289*10-3 gr / 0.9035 (gr/min)*10-4
=25,78 min
Figure 4.16 shows the time to obtain 0.1 mm with 1 mm initial diameter. It can be seen that as diameter decreases the elapsed time also decreases.
49
Chapter 5
Process Planning Software for EDM
The EDM process allows the manufacturing of high aspect ratio microstructures with fine surface finish. However, the process is slow. The users of EDM need to know the time it will take the fabrication of micro tools. In addition, micro tool geometries are usually custom, therefore, every time tool geometry changes, tool paths must be calculated from scratch. In addition to capacitance, voltage, and spindle speed, some other process variables such as feed rate, wire diameter, etc. also influence the outcome of the process. For example, for a given capacitance and voltage settings if the feed rate is set so that it is faster than the material removal rate, the tool would contact the electrode which results in a short circuit therefore EDM process stops. A process
planning software has been developed in order to assist with the process parameter selection process. The process planning software developed in this study also allows users to visualize the tool that is being fabricated since micrometer level dimensions cannot be visualized easily. In order to be able to that, a macro for Solidworks, a Computer Aided Design software, has been developed. This section describes the capabilities of the process planning software. Figure 5.1 shows the user interface of the software developed in Visual Basic software. The user interface consists of five buttons namely G-Code for ball end mill, G-Code for D-Shape, Solidworks Design, Clear and Exit.
50
Figure 5.1 User interface
G-Code for ball end mill and D-Shape buttons are directly related to fabrication process. G-Codes obtained from this software can be directly transferred to a micro-EDM machine and fabrication process immediately starts. Solidworks Design button allows user to enter parameters related to the micro tools and visualize the design in Solidworks environment. The process planning software and Solidworks are integrated seamlessly so that features of the cutting tool can be analyzed. The software takes necessary process parameters as inputs to generate the outputs as shown in Figure 5.2.
51
Figure 5.2 User interface and generated G-code for the fabrication of micro ball end mills
Usually, the block-EDM process is applied to bring the tool diameter to the specified value as shown in Figure 5.3(b).
52
In the process flow, first input from the user is the tool diameter and wire diameter information which are required to generate tool paths during WEDG process to convert cylindrical tool obtained from block-EDM method into hemispherical tool.
Figure 5.4 User form for tool and wire data
After reducing diameter to a desired radius via block-EDM, wire electro discharge machining (WEDM) is used for shaping of a hemispherical poly crystalline diamond (PCD) and tungsten carbide (WC) tools. With the WC and PCD tool material rotating, the machining path follows a set of points which are determined by developing formulations explained in Figure 5.5.
53
Figure 5.5 The designation used for wire diameter compensation in this study
(1) (2) (3)
where and are tool and wire diameter, respectively. (4)
54
(5) (6) therefore PS becomes
(7) From Eqs. 1 and 7 we have:
(8) and from Eqs. 2 and 5 we have:
(9)
For miro-ball end mill fabrication using WEDG should be in the range of . Cylindrical tool is converted into hemispherical tool at the end of the WEDG process. Obtained tool is seen in figure 5.6(b).
![Figure 2.5 Micro conical tool and groove machined in soda-lime glass [15]](https://thumb-eu.123doks.com/thumbv2/9libnet/5877356.121221/25.892.263.689.368.531/figure-micro-conical-tool-groove-machined-soda-glass.webp)
![Figure 2.11 Fabrication steps of spherical PCD tool [20]](https://thumb-eu.123doks.com/thumbv2/9libnet/5877356.121221/28.892.231.755.740.973/figure-fabrication-steps-spherical-pcd-tool.webp)
![Figure 2.12 User form related to tool geometry definiton [21]](https://thumb-eu.123doks.com/thumbv2/9libnet/5877356.121221/30.892.280.682.323.612/figure-user-form-related-tool-geometry-definiton.webp)