MOLTEN SALT ASSISTED SELF-ASSEMBLY (MASA):
SYNTHESIS, CHARACTERIZATION and SOLAR CELL
PERFORMANCES OF MESOPOROUS SILICA-CdSe and
TITANIA-CdSe THIN FILMS
A THESIS SUBMITTED TO
THE GRADUATE SCHOOL OF ENGINEERING AND SCIENCE OF BILKENT UNIVERSITY
IN PARTIAL FULFILLMENT OF THE REQUIREMENTS FOR THE DEGREE OF
MASTER OF SCIENCE IN
CHEMISTRY
By
Ahmet Selim Han May 2015
i
MOLTEN SALT ASSISTED SELF-ASSEMBLY (MASA): SYNTHESIS, CHARACTERIZATION and SOLAR CELL PERFORMANCES OF MESOPOROUS SILICA-CdSe and TITANIA-CdSe THIN FILMS By Ahmet Selim Han,
May, 2015
We certify that we have read this thesis and have found that it is fully adequate, in scope and in quality, as a thesis for the degree of Master of Science.
_______________________ Prof. Dr. Ömer Dağ(Advisor)
_______________________ Doç. Dr. Ayşen Yılmaz
_______________________ Yrd. Doç. Dr. Ferdi Karadaş
Approved for the Graduate School of Engineering and Science:
_______________________
Prof. Dr. Levent Onural Director of the Graduate School
ii ABSTRACT
MOLTEN SALT ASSISTED SELF-ASSEMBLY (MASA):
SYNTHESIS, CHARACTERIZATION and SOLAR CELL PERFORMANCES OF MESOPOROUS SILICA-CdSe and
TITANIA-CdSe THIN FILMS
Ahmet Selim Han
M.S. in Chemistry
Advisor: Prof. Dr. Ömer Dağ
May, 2015
A series of solutions of a salt ([Cd(H2O)4](NO3)2), a polymerizing agent (Si(OCH3)4, TMOS or Ti(OC4H9), TTBO), two surfactants (cetyltrimethylammonium bromide, CTAB and 10-lauryl ether, C12H25(OCH2CH2)10OH, C12EO10) have been prepared and used as the molten salt assisted self-assembly precursors by only changing the Cd(II)/surfactant mole ratios for the preparation of mesoporous films. The thin films were prepared in two steps: in the first step, the titania particles (titania particles are typically 20-25 nm (P25)), dispersed in ethanol, have been spin coated over various substrates and annealed at 450oC and in the second step, the clear solutions given above (salt, CTAB, C12E10, silica or titania source and ethanol) were drop casted or spin coated over the titania (P25) films and calcined at 450oC.
iii
Slow calcination of the films (with an increment of 1 oC/min), starting from the melting point of the salt (around 65oC) to 450 oC has produced the mesoporous silica/titania-cadmium oxide (CdO) thin films denoted as meso-CdO-SiO2-P25 and meso-CdTiO3-P25. The clear solutions were also used to make the thin films without P25 and denoted as meso-CdTiO3.
The films were then exposed to a H2Se atmosphere at 100oC for 30 min, and the samples were denoted as meso-CdSe-SiO2-P25, meso-CdSe-TiO2-P25 and meso-CdSe-TiO2. The silica sample was further treated with a dilute HF solution (etching process) that results silica free meso-CdSe-P25. The characterization of the materials produced in this thesis was made by using XRD, FT-IR spectroscopy, UV-VIS, Raman, EDX and Solar Measurement techniques.
Silica samples have greater amount of CdSe than titania samples according to the Raman and EDX data which implies that silica samples are more reactive. Also in both silica and titania, the samples with a Cd/surfactant mole ratio of 6 have the greatest amount of CdSe.
Fluorine doped SnO2 (FTO) has been used as a transparent conductive substrate for the preparation of the anode electrode for the solar measurements. According to the solar measurements, the silica and titania samples on P25 show greater efficiency than the titania samples without P25 and generally have similar efficiencies (the efficiency is the ratio of the electrical output of a solar cell to the incident energy in the form of sunlight). The most efficient samples are generally the samples prepared using Cd/surfactant mole ratios equal to 6 and 8. In order to increase the efficiency, 3rd row transition metal cations such as Mn(II), Fe(III),
iv
Cu(II) and Co(II) are doped into above samples. The efficiency has been increased by 10 % in the silica and 30 % in the titania samples upon doping with 15% Mn(II). The solar cell characteristics of the electrodes were tested using the following parameters; by changing the Cd(II)/surfactant mole ratio (many samples were prepared and used for this purpose), by changing the aging of the electrolyte (Na2S/S8), by using multiple coating the MASA solution in the preparation stage of the electrodes, by doping the samples with various transition metal ions, and finally by modifying the surface of the electrode by coating with ZnS or CTAB. Each of these parameters has an effect on the cell performance. The effect of each parameter is monitored by measuring the I-V characteristics of the cells and found out that the best results were obtained from the electrodes made using 6 or 8 Cd/surfactant mole ratio in MASA system, freshly prepared Na2S/S8 electrolyte, coating of the MASA solution twice on electrode, doping Mn(II) cations with 0.15 Mn(II)/Cd(II) ratio and using CTAB for coating anode electrode.
Keywords: MASA process, mesoporous CdO-SiO2, mesoporous CdTiO3, mesoporous CdSe-TiO2, Quantum dot sensitized solar cells, thin films.
v ÖZET
ERİYİK TUZ YARDIMLI KENDİLİĞİNDEN OLUŞMA (EYKO): MEZOGÖZENEKLİ SiO2-CdSe ve TiO2-CdSe İNCE FİLMLERİNİN
SENTEZİ, KARAKTERİZASYONU VE GÜNEŞ PİLİ PERFORMANSLARI
Ahmet Selim Han
Kimya Bölümü, Yüksek Lisans Tezi
Tez Yöneticisi: Ömer Dağ Mayıs, 2015
Bu çalışmada [Cd(H2O)4](NO3)2 tuzu, Si(OCH3)4, TMOS veya Ti(OC4H9), TTBO polimerleştirici ajanları, iki yüzeyaktif madde (setiltrimetilamonyum bromür, CTAB ve 10-löril eter, C12H25(OCH2CH2)10OH, C12EO10); eriyik tuz yapılı kendiliğinden oluşma (EYKO) öncülleri olarak kullanıldı ve Cd(II)/yüzeyaktif mol oranları değiştirilerek ince mezogözenekli filmler hazırlandı. İnce filmler 2 basamakta hazırlandı: ilk adımda TiO2 parçacıkları (P25) (parçacıklar tipik olarak 20-25 nm civarında), etanol içinde iyice homojenize edilip ardından uygun bir alttaş üzerine spin kaplama yöntemiyle kaplandı ve 450oC’ye kadar ısıtıldı. İkinci basamakta ise yukarıda bahsedilen berrak çözelti (tuz, CTAB, C12E10, SiO2 veya TiO2 kaynağı ve etanol) TiO2 (P25) üzerine
vi
damlatıldı ve tekrar spin kaplama yöntemiyle TiO2 film üzerine homojen dağılması sağlandı ve tekrar 450 o
C’ye ısıtıldı.
Filmin tuzun erime noktasından (65oC civarı) başlayarak 450 o
C’ye kadar yavaşça ısıtılmasıyla (1 o
C/dakika hızla) mezogözenekli SiO2/TiO2-kadmiyum oksit(CdO) ince filmleri oluşturuldu ve mezo-CdO-SiO2-P25 ve mezo-CdTiO3 -P25 olarak adlandırıldı. Berrak çözelti kullanılarak ayrıca -P25 kullanılmadan doğrudan cam üstüne spin kaplama yapılarak mezo-CdTiO3 ince filmi de elde edildi.
Hazırlanan filmler daha sonra 100 oC’de 30 dakika boyunca H
2Se gazı ile tepkimeye sokuldu ve mezo-CdSe-SiO2-P25, mezo-CdSe-TiO2-P25 ve mezo-CdSe-TiO2 filmleri elde edildi. SiO2 örneği daha sonra seyreltik HF çözeltisiyle muamele edildi ve SiO2’den arındırılmış mezo-CdSe-P25 elde edildi. Elde edilen ürünlerin karakterizasyonları XRD, FT-IR, UV-VIS ve Raman spektroskopileri, EDX ve Solar Ölçüm teknikleriyle yapıldı.
Raman ve EDX ölçümlerine göre, SiO2 örneklerindeki CdSe miktarının TiO2 örneklerinden daha fazla olduğu belirlendi ve bu sonuç ile SiO2 örneklerinin daha reaktif olduğu tesbit edildi. Ayrıca hem SiO2 hem TiO2 örneklerinde CdSe miktarının en yüksek olduğu Cd/yüzeyaktif mol oranının 6 olduğu tesbit edildi.
Flor doplanmış kalay oksit (FTO) camı, güneş pili ölçümleri için kullanılan anot elektrotunun yapımında şeffaf ve iletken bir alttaş olarak kullanılmıştır. Güneş pili ölçümlerine göre, P25 üzerinde hazırlanan SiO2 ve TiO2 örneklerinin P25 kullanılmadan hazırlanan TiO2 örneğine göre daha yüksek verim
vii
gösterdiği ve P25 üzerinde sentezlenen bu iki örneğin verim değerlerinin birbirlerine yakın olduğu görüldü(güneş pilinde verim, güneş pilinin verdiği elektrik enerjisi çıktısının güneşten gelen enerjiye oranı olarak tanımlanır). En verimli örneklerin genel olarak 6 veya 8 Cd/yüzeyaktif mol oranına sahip örnekler olduğu belirlendi. Pil verimini arttırmak için Mn(II), Fe(III), Cu(II) ve Co(II) bazı 3d grubu geçiş metal katyonları dopant olarak kullanıldı. Pil veriminde Mn(II) eklenmiş SiO2 örneklerinde 10%, TiO2 örneklerinde 30% oranında artış gözlendi. Cd(II)/yüzeyaktif mol oranları değiştirilerek, elektrolitin (Na2S/S8) hazırlandıktan sonraki bekleme süresi değiştirilerek, film hazırlama esnasında EYKO çözeltisi birden fazla defa spin kaplama yapılarak, EYKO çözeltisine değişik metal katyonları farklı mol oranlarında ilave edilerek ve son olarak anot elektrodun üzeri ZnS veya CTAB gibi moleküllerle kaplanıp modifiye edilerek güneş pili ölçüm karakterizasyonları yapıldı. Yukarıda bahsedilen her bir parametrenin güneş pili performansını değiştirdiği görüldü. Her bir parametrenin güneş pili verimine etkisi I-V eğrisi ile tesbit edildi. Sonuç olarak, Na2S/S8 elektrolitinin yeni hazırlanmış olmasının, EYKO çözeltisini 2 defa kaplamanın, Mn(II) katyonunu dopant olarak seçmenin ve Mn(II)/Cd(II) mol oranını 0.15 olarak ayarlamanın ve anodu kaplamak için CTAB kullanmanın isabetli olduğu görüldü.
Anahtar sözcükler: EYKO prosesi, mezogözenekli CdO-SiO2, mezogözenekli CdTiO3, mezogözenekli CdSe-TiO2, quantum nokta duyarlı güneş pilleri, ince filmler.
viii
Acknowledgements
Firstly, I would like to express my sincere thanks to my supervisor Prof. Dr. Ömer Dağ for his excellent supervision, guidance, support and patience during my M.S. studies. He spent so much time to improve my thesis. I will never forget his support throughout my life.
I also thank to my thesis committee members Assoc. Prof. Dr. Ayşen Yılmaz and Asst. Prof. Dr. Ferdi Karadaş.
I want to express my special thanks to Melih Bacı, Cüneyt Karakaya and Bilal Uyar for their great supports and partnership during my research.
I want to thank our group members Dr. Cemal Albayrak, Ebrima Tunkara, Gözde Barım, Civan Avcı, Dr. Fadime Mert Balcı, Dr. Elif Berna Olutaş, Gülbahar Saat, Ezgi Yılmaz, Muammer Yusuf Yaman, Ulugbek Barotov, Dr. Muhammad Reza Etmınanfar, Tuluhan Olcayto Çolak, Berna Aykal, Nüveyre Polat, Simge Uzunok.
I want to thank technician Ethem Anber for his memorable helps and contributions in my research experiments.
I also want to express my special thanks to Cengiz Duran and Sencer Selçuk for their guidance and valuable support during my research.
I want to thank my close friends; Alperen, Oğuz, Yusuf, Emre, Ömer Faruk, Halil İbrahim, Fatih, İbrahim, Ertuğrul and Tarık for their encouragements and sincere friendship.
ix
I would like to thank to TÜBİTAK (The Scientific and Technological Research Council of Turkey) for financial support. (Project no: 112T407)
And finally, I am sincerely thankful to my family: my mother Filiz Han, my father Vahit Han and my sister Bilge Su Han for their continuous supports throughout my life.
x
Contents
Introduction ... 1
1.1. Mesoporous Structures ... 1
1.2. Lyotropic Liquid Crystalline (LLC) Mesophases as Reaction Media for the Assembly of Mesoporous Materials ... 5
1.3. Molten Salt Assisted Self-Assembly (MASA) Process ... 7
1.4. Sensitizing Mesoporous Materials with Using Titania Nanoparticles (P25) 9 1.5. Sensitizing Mesoporous Materials ... 10
1.5.1. Sensitizing Using Dye Molecules ... 10
1.5.2. Sensitizing Mesoporous Titania Using Quantum Dots... 13
1.6. The CdSe-TiO2 Solar Cells ... 16
1.7. Efficiency Measurements and Calculations of the Solar Cells ... 18
Experimental... 20
2.1. Materials ... 20
2.2. Coating of FTO with Protecting Layer ... 21
2.3. Synthesis of Mesoporous Cadmium Titanate Thin Films (meso-CdTiO3) 21 2.4. Preparation of Mesoporous Titania(P25) Films (meso-TiO2) ... 21
xi
2.5. Synthesis of Mesoporous Cadmium Titanate-Titania Films
(meso-CdTiO3-TiO2) ... 22
2.6. Synthesis of Mesoporous Cadmium Oxide-Silica-Titania Films (meso-CdO-SiO2-TiO2)... 22
2.7. Synthesis of Mesoporous Cadmium Selenide-Titania Thin Films(meso-CdSe-TiO2), Cadmium Selenide-Silica-Titania Films (meso-CdSe-SiO2-TiO2) and Cadmium Selenide-Titania-Titania Films(meso-CdSe-TiO2-TiO2) ... 23
2.8. Removing Silica from the meso-CdSe-SiO2-TiO2 Films ... 24
2.9. Synthesis of Mesoporous Cadmium Metal Titanate Thin Films (meso-CdxM1-xTiO3), Cadmium oxide-Metal Oxide-Silica-Titania Films (meso-CdO-MO-SiO2-TiO2) or Cadmium Metal Titanate-Titania Films (meso-CdxM 1-xTiO3-TiO2) and Their H2Se Reactions ... 25
2.10. Preparation of the Electrolyte Solution and Counter Electrode. ... 25
2.11. Coating the Anode Electrode with Passivation Layers ... 25
2.11.1. Coating with CTAB ... 25
2.11.2. Coating with Zinc Sulfide ... 26
2.11.3. Coating with branched-Polyethyleneimine ... 26
Chapter 3: ... 28
Instrumental ... 28
3.1. Raman Spectra ... 28
xii
3.3. X-Ray Diffraction (XRD) Patterns ... 29
3.4. FTIR Spectra ... 29
3.5. UV-Vis Absorption Spectra ... 29
3.6. SEM Imaging and EDX Analysis ... 30
Results and Discussion... 31
4.1. Preparation of the Anode Electrode ... 31
4.2. Raman Studies ... 43
4.3. Solar Performances ... 60
4.3.1. Usage of solar light by anode electrodes ... 60
4.3.2. Solar measurements of meso-CdSe-TiO2 thin films(without P25) . 64 4.3.3. Doctor Blade and Spin Coatings of P25 and Differences ... 65
4.3.4. Effect of Fresh Electrolyte ... 65
4.3.5. Importance of Surfactant in General... 66
4.3.6. Solar Cell Response with Time ... 67
4.3.7. Effect of Coating Materials ... 69
4.3.7.1. Cetyltrimethylammonium Bromide (CTAB) as a Protecting Layer 70 4.3.7.2. Zinc Sulfide (ZnS) as a Protecting Layer ... 71
4.3.7.3. Polyethyleneimine (PEI)-branched as a Protecting Layer ... 71 4.3.8. Comparing the Solar Efficiencies of the Titania and Silica Samples
xiii
4.3.9. Effect of Etching Silica and Heat Treatment after Etching ... 74 4.3.10. Effect of Calcination Temperature on the Solar Cell Performance of the Silica and Titania Samples ... 75 4.3.11. Silica and Titania Systems with Different Cd(II) Ratios ... 77 4.3.12. Loading Dependence of the Silica and Titania Samples ... 79 4.3.13. Effect of Adding Different Transition Metal Cations into the above Anode Materials and Their Effects on the Solar Cell Efficiency ... 82 4.3.13.1. Mn(II) Incorporation into Silica and Titania Samples ... 82 4.3.13.2. Co(II) Incorporation into Silica and Titania Samples ... 83 4.3.13.3. Cu(II) and Fe(III) Incorporations to Silica and Titania Samples
84
4.3.13.4. Zn(II) Incorporation into the Silica and Titania Systems ... 86 Conclusion ... 88 References ... 91
xiv
List of Figures
Figure 1. Schematic represantation of pore size rage of microporous, mesoporous and macroporous materials. ... 1 Figure 2. Synthesis pathway of MCM-41. ... 3 Figure 3. The structure of the mesoporous M41S family. ... 4 Figure 4. Schematic representation of an hexagonal LLC phase of a salt-surfactant system. ... 7 Figure 5. Schematic representation of the MASA process. ... 8 Figure 6. Schematic representation of the enegy levels of titania and sensitizer and the photophysical process during solar action. ... 10 Figure 7. Schematic representation of a DSSC. ... 12 Figure 8. Structures of some of the most efficient dye molecules(cis-Bis(isothiocyanato)bis(2,2-bipyridyl-4,4-dicarboxylato)ruthenium(II)(N3), Di-tetrabutylammonium cis-bis(isothiocyanato)bis(2,2′-bipyridyl-4,4′-dicarboxylato)ruthenium(II)(N719),
cis-Bis(isothiocyanato)(2,2′-bipyridyl-4,4′-dicarboxylato)(4,4′-di-nonyl-2′-bipyridyl)ruthenium(II)(Z907), “black dye” (tris(cyanato)-2,2',2”-terpyridyl-4,4',4”-tricarboxylate)Ru(II)) for dye sensitized solar cells. ... 13 Figure 9. Changing of the band gap of QDs with respect to particle size... 14 Figure 10. Schematic representation of a QDSC. ... 16 Figure 11. Schematic representation of the operation of the CdSe-TiO2(P25) solar cell. ... 17 Figure 12. I-V curve of a solar cell. ... 19
xv
Figure 13. Experimental setup for H2Se reaction. ... 24
Figure 14. Low angle XRD pattern of the films, obtained using the MASA process, before (black) and after (red) calcination. ... 33
Figure 15. Conversion of the MASA ingredients in entire process. ... 34
Figure 16. Synthesis pathway of 3 films; meso-CdSe-SiO2-TiO2, meso-CdSe-TiO2-TiO2 and meso-CdSe-TiO2 thin films. ... 35
Figure 17. EDX Spectra for si8 and ti8 samples. ... 36
Figure 18. Raman spectrum of si8 sample. ... 37
Figure 19. Raman spectrum of ti8 sample... 38
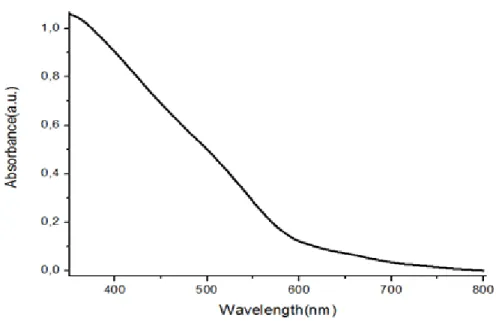
Figure 20. UV-Vis absorption spectrum of the si8 sample. ... 39
Figure 21. UV-Vis absorption spectrum of the ti8 sample. ... 39
Figure 22. UV-Vis absorption spectrum of the CdSe-TiO2 thin film. ... 40
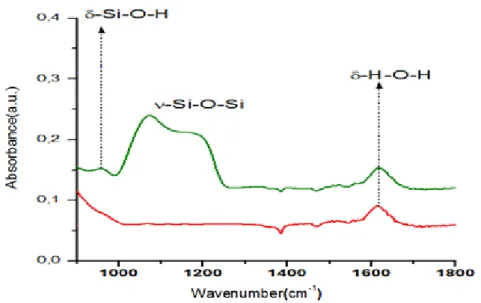
Figure 23. IR spectrum of the CdSe-SiO2 sample before (top) and after (bottom) etching. ... 41
Figure 24. Raman spectrum of titania, anatase phase. ... 43
Figure 25. Raman spectra of the CdSe-SiO2-TiO2 samples. ... 44
Figure 26. Raman spectra of pure selenium(a) and meso-CdSe-TiO2-TiO2(b) film. ... 45
Figure 27. Raman spectral changes over time of the si4(a) and ti4(b) samples. ... 47
Figure 28. Normalized Raman spectra of CdSe-TiO2 film for the si6(a) and ti6(b) samples. ... 48
Figure 29. Normalized Raman spectra of the CdSe-TiO2 film for the si8(a) and ti8(b) samples. ... 50
xvi
Figure 30. Normalized Raman spectra of the CdSe-TiO2 films for si10(up) and
ti10(down) sample. ... 52
Figure 31. [CdSe]t/[CdSe]o (a) and [CdSe]t/[TiO2]t(b) peak ratios change over time for the si4 and ti4 samples. ... 54
Figure 32. [CdSe]t/[CdSe]o (a) and [CdSe]t/[TiO2]t(b) peak ratios change with time from the si6 and ti6 samples. ... 56
Figure 33. [CdSe]t/[CdSe]o(a) and [CdSe]t/[TiO2]t(b) peak ratio changes over time in the si8 and ti8 samples. ... 57
Figure 34. [CdSe]t/[CdSe]o (a) and [CdSe]t/[TiO2]t(b) peak ratios changes over time in the si10 and ti10 samples. ... 58
Figure 35. The [CdSe]t/[CdSe]o (a,c) and [CdSe]t/[TiO2]t (b,d) peak ratios changes over time for the all si(a,b) and ti(c,d) samples. ... 59
Figure 36. The picture of the cell used in all solar experiments... 60
Figure 37. Schematic representation of the sun light through different layers in cell. ... 61
Figure 38. I-V curve of the most efficient sample of the CdSe-TiO2 thin films. .. 64
Figure 39. I-V curve of the CdSe-P25 samples with surfactant and without surfactant. ... 67
Figure 40. Efficiency changes of DB and SC samples with time... 69
Figure 41. Operation scheme for CdSe-TiO2(P25) solar cell. ... 70
Figure 42. Structure of CTAB. ... 70
Figure 43. Structure of PEI... 71
Figure 44. Solar efficiencies of silica and titania samples at different calcination temperature. ... 76
xvii
Figure 45. Efficiencies of silica and titania systems with different Cd/surfactant mole ratios. ... 79 Figure 46. Photographs of the 4, 6, and 8-Cd(II)/surfactants mole ratio samples loaded once and reacted with H2Se (left to right). ... 80 Figure 47. Photographs of the 4-Cd(II)/surfactants mole ratio samples loaded 1, 2 and 3 times and reacted with H2Se (left to right). ... 80 Figure 48. Photographs of the 6-Cd(II)/surfactants mole ratio samples loaded , 2 and 3 times reacted under H2Se (left to right). ... 81 Figure 49. Photographs of the 4-Cd(II)/surfactants mole ratio samples loaded 1, 2 and 3 times and reacted with H2Se (left to right). ... 81 Figure 50. Efficiencies of the si8 and ti8 samples with different Mn(II)/Cd(II) ratios. ... 83 Figure 51. Efficiencies of the ti8 samples with different Co(II)/Cd(II) ratios. ... 84 Figure 52. Efficiencies of the ti8 samples with different Co(II)/Cd(II) or Fe(III)/Cd(II) ratios. ... 85 Figure 53. Efficiencies (normalized to the undoped ti8 sample) of the ti8 samples with different metal/Cd(II) ratios... 86 Figure 54. Picture of the meso-ZnSe-TiO2-TiO2 films before and after solar measurement. ... 87 Figure 55. I-V curve of the meso-ZnSe-TiO2-TiO2 film at 6 Zn/surfactant ratio. 87
xviii
List of Tables
Table 1. The amounts of chemicals used in the preparation of meso-silica-CdO and meso-CdTiO3. ... 27 Table 2. The amounts of extra metal sources(metal salts). All of these salts are added to si8 or ti8 systems (see Table 1). ... 27 Table 3. Se/Cd ratios and relative Se amounts of si and ti samples at different Cd concentrations.(from 4 to 10 Cd/surfactant ratio)... 37 Table 4. The light intensity and %transmittance values of different experiment sets... 62 Table 5. Solar measurement variables of the same silica sample with fresh and old electrolyte. ... 66 Table 6. Solar measurement variables of the CdSe-P25 samples with surfactant and without surfactant. ... 67 Table 7. Solar measurement variables of the silica samples with different protecting layers... 72 Table 8. Efficiencies and percentage increases in efficiency of silica samples with different protecting layers. ... 73 Table 9. Solar measurement data for silica and titania samples. ... 74 Table 10. Solar measurement variables for etched, not-etched and both etched and heated samples. ... 75 Table 11. Efficiencies of the si4, si6 and si8 samples with different loadings. .... 81
Chapter 1:
Introduction
1.1. Mesoporous Structures
Mesoporous materials are the materials that have pores with a diameter between 2 and 50 nm. According to IUPAC notation, the diameters of the microporous materials are less than 2 nm and diameters of the macroporous materials are greater than 50 nm[1]. (see Figure 1)
Figure 1. Schematic represantation of pore size rage of microporous, mesoporous and
macroporous materials.
Presence of internal channels and cavities in the mesoporous materials provide high surface areas[2] and even large host molecules can diffuse inside
2
these cavities in mesoporous materials. Therefore, the mesoporous materials can be used in catalysis, gas sensing, sorption, photovoltaics and optics[3].
In 1992, the first periodic mesoporous material (PMM) was synthesized by Kresge et. al. from Mobil Oil Company[4]. Kresge and his co-workers used surfactants as a template and controlled the pore size of PMMs[4]. Until 1992, the main focus was on microporous materials, such as zeolites (the largest pore dimensions are around 10–12 Å[5]), metallophosphates[4][6] and mineral cacoxenite (pore dimensions 14 A)[7]. However, in Kresge’s work the pore sizes of synthesized materials (M41S) were in the range between 16 and 100 Å depending on the type of surfactant used[8]. The first investigations of mesoporous materials focus on the synthesis of pure silica. The synthesis pathway is schematically shown in Figure 2.
3
Figure 2. Synthesis pathway of MCM-41.
MCM-41 is the most common and most widely studied mesostructure in M41S family and it has hexagonally packed arrays of pores. Also cubic MCM-48 and lamellar MCM-50 are foremost structures, investigated in the M41S family, see Figure 3[9].
4
Figure 3. The structure of the mesoporous M41S family.1
The formation of these mesostructures occurs via a liquid crystal templating mechanism, where the silica precursors polymerize in the hydrophilic domains of the surfactant micelles and/or preformed lyotropic liquid crystalline mesophase[10].
Furthermore, by changing the surfactant type or sizes, different mesoporous structures have been developed. Using cationic or nonionic surfactants in acidic solution SBA-n series were synthesized in 1996[11]. Stucky
et. al. synthesized the SBA-15(Santa Barbara Amorphous) material, which is also
mesoporous hexagonal silica and the pore size of this mesostructure is larger (46 to 300 Å) and the wall thickness is thicker (around 20 nm). In this assembly process, the poly(alkylene oxide) triblock copolymers, such as poly(ethylene oxide)–poly(propylene oxide)–poly(ethylene oxide) (PEO-PPO-PEO) have been used as the structure directing agents[11].
1
Reprinted from New J. Chem., vol. 32, A. Corma, M. Moliner, M. J. Díaz-Cabañas, P. Serna, B. Femenia, J. Primo, and H. García, “Biomimetic synthesis of microporous and mesoporous materials at room temperature and neutral pH, with application in electronics, controlled release of chemicals, and catalysis,” (2008), with permission from RSC.
5
1.2. Lyotropic Liquid Crystalline (LLC) Mesophases as Reaction Media for the Assembly of Mesoporous Materials
The LLC mesophase has been demonstrated to be a right media for the synthesis of mesoporous oriented thin film and monolith in 1995[12]. Attard, in his pioneering work, showed that the silica species can be polymerized in the hydrophilic domains of the LLC mesophase and named the assembly process, true liquid crystalline templating (TLCT)[12]. In this process, the surfactant is a nonionic oligo ethylene oxide (such as C16H33(OCH2CH2)8OH, C16EO10) and silica precursor is tetramethylortosilicate (Si(OCH3)4, TMOS). A small amount of acid helps to polymerize the hydrolyzed TMOS. After polymerizing silica and removing surfactants by calcination, a 2D hexagonal mesoporous silica structure is obtained, see Figure 2.
In the LLC phase, concentration of the components is the most important variable on determining the structure of the mesophase. Changing the concentration and type of surfactants, many mesoporous materials such as meso-metals, meso-metal oxides have been synthesized using the TLCT method. Attard’s group synthesized well characterized mesoporous tin[13], platinum[14][15] and their alloys[16]. Stucky’s group synthesized different mesoporous metal oxides such as TiO2, WO3, SnO2, Nb2O5, HfO2, ZrTiO4[17] and Stupp’s group synthesized mesostructured ZnS, CdS and CdSe which are semiconductors[18][19].
6
In all these synthesis, the metal ion concentrations were kept very low because the LLC phase of water-surfactant is not stable at high metal salt concentrations. The metal ions are not actually one of the main components of the LLC phase. The solvent water and surfactant forms the LLC phase, where the metal salt is a host in the media; the amount of metal salt that can be incorporated into the water-surfactant LLC mesophase is limited. As a result of this fact, the mesostructured metals and metal oxides have only be formed of very fine, ultra-small powders and ultra-small quantities[12][13][17][18].
Dag’s group introduced a new type of LLC mesophase that consists of a transition metal aqua complex salt, such as [Cd(H2O)4](NO3)2 and [Zn(H2O)6](NO3)2 and oligo(ethylene oxide) type surfactant[20][21][22]. The salt species behave like a solvent and form the LLC mesophase in this new LLC system[23].
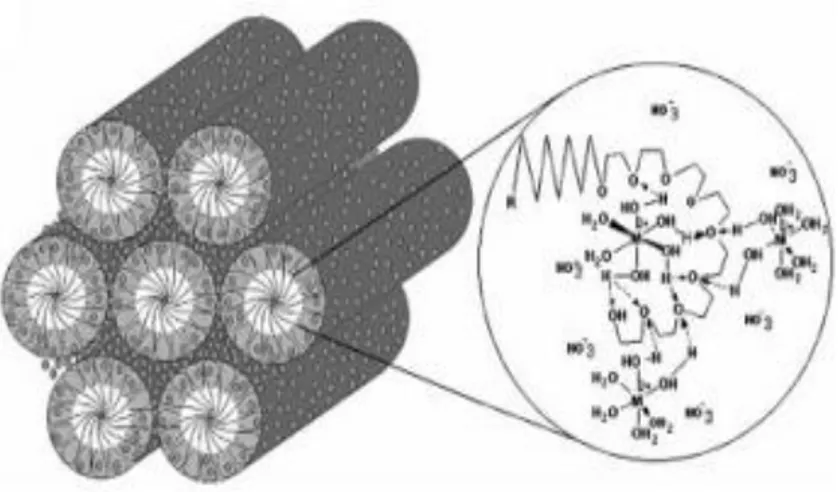
It has been shown that the surfactant molecules form cubic or hexagonal mesostructures, in which the coordinated water molecules stabilize the mesophase through hydrogen bonding interactions with oxygen atoms of the ethylene oxide groups of the surfactant (C12H25(CH2CH2O)10OH, C12EO10, 10-lauryl ether), see Figure 4[20]. It has been shown that it is possible to prepare stable [Zn(H2O)6](NO3)2-C12EO10 LLC phase up to 70 w/w% (weight percent of salt)[20].
7
Figure 4. Schematic representation of an hexagonal LLC phase of a salt-surfactant
system.2
Adding charged surfactants, such as sodium dodecyl sulphate (SDS) or cetyltrimethylammonium bromide (CTAB) to the salt-surfactant system makes possible to increase the amount of metal salts up to 8/1 metal salt/surfactant mole ratio[24]. The role of charged surfactants is to balance the charge of the metal salts at the surfactant molten salt interface that makes the LLC mesophase stable even at very high concentrations. As a result, Dag group’s studies have been shown that the [Zn(H2O)6](NO3)2 salt is in the molten phase in the hydrophilic domains of the mesophase and assists to form LLC mesophase[23].
1.3. Molten Salt Assisted Self-Assembly (MASA) Process
The MASA process is a new self-assembly process, introduced by Dag’s group in 2011[25]. In this assembly process, two surfactants, CTAB and C12EO10 with a 1:1 mole ratio, are used as structure directing agents. The solvents are
2
Reprinted from Angew. Chemie Int. Ed. English, vol. 40, no. 20, pp. 3799–3803, Ö. Çelik and Ö. Dag, “A new lyotropic liquid-crystalline phase is formed from oligo- (ethylene oxide) surfactants and M(H2O)”, (2001), with the permission from John Wiley and Sons.
8
ethanol (volatile) and the salt (non-volatile). There is also a polymerizing reagent that is either Ti(OC4H9)4 (titanium butoxide) [26] [27] or Si(OCH3)4 (TMOS)[25]. All these ingredients turn into metal titanates or metal oxide-silica at the end of the MASA process, see Figure 5[25]. The metal salt/surfactant mole ratios have been varied from 4 to 10 that corresponds to 4/7 and 10/7 metal salt/titania or silica (the Ti(IV) or Si(IV)/C12EO10 mole ratio is kept constant as 7) [23][24][25][26][27].
Figure 5. Schematic representation of the MASA process.3
The use of titanium butoxide as a precursor produces the mesoporous metal titanate thin films (such as CdTiO3, Zn2TiO4, Li4Ti5O12, CoTiO3, MnTiO3 etc.) [26] [27] and use of TMOS produces the mesoporous metal oxides and silica (such as CdO-SiO2 or ZnO-SiO2)[25]. It is also possible to synthesize mesoporous semiconductors such as CdS, CdSe, ZnS and ZnSe by reacting meso metal oxides
3
Reprinted from Chem. Mater., vol. 23, pp. 3062–3071, C. Karakaya, Y. Türker, C. Albayrak, and Ö. Dag, “Assembly of Molten Transition Metal Salt À Surfactant in a Confined Space for the Synthesis of Mesoporous Metal Oxide-Rich Metal Oxide À Silica Thin Films”(2011), with the permission from ACS.
9
with H2S or H2Se gases and these mesostructured semiconductors can be used in solar cells[26][28].
1.4. Sensitizing Mesoporous Materials with Using Titania Nanoparticles (P25)
In solar cells; a mesoporous film, prepared using nanoparticles of anatase phase of titania (TiO2, the trade name is P25) has been the mostly used material in the literature[29][30][31][32]. P25 comprises of nanoparticles less than 25 nm sized. It has a high surface area (specific surface area is between 45 and 55 m2/g) that enables to bind or load enough sensitizer(dyes or quantum dots)[33][34] [35] [36]. The sensitizers are usually loaded from the solution phase into the calcined mesoporous titania.
P25 can be prepared using pure TiCl4 liquid that is vaporized and mixed with air and hydrogen gas[35]. These gases react suddenly at temperatures between 1000 and 2400oC to form nanostructured titanium dioxides:
TiCl4 + 2H2 + O2 TiO2 + 4 HCl
By regulating the process parameters, it is possible to obtain the P25 nanoparticles with different sizes[35][36].
The role of titania in solar cell system is to take electron(s) from excited sensitizer(s) and to transfer them to conducting glass (indium tin oxide, ITO or fluoride doped tin oxide, FTO). Titania is a wide band gap (3.2 eV)[37]
10
semiconductor and the energy level of conduction band of titania is suitable for accepting electrons from the excited sensitizers, see Figure 6.
Figure 6. Schematic representation of the enegy levels of titania and sensitizer and the
photophysical process during solar action.
1.5. Sensitizing Mesoporous Materials
1.5.1. Sensitizing Using Dye Molecules
At the beginning of 1970s, it was discovered that organic dye molecules can be used in electrochemical cells[38]. The dye sensitized solar cell (DSSC) concept was introduced by Herman Tributsch in 1972[39]. The DSSCs are members of the thin-film solar cells[40]. In the DSSC system, the dye molecules absorb the sunlight and get excited and the excited molecule undergoes to an oxidation upon transferring its electron to the conduction band of mesoporous titania and then to conducting glass (FTO or ITO) electrode. Then these electrons are transferred to the cathode, Pt electrode, where the electrons are transferred to
11
the I3-/I- redox couple in the electrolyte between the two electrodes in the photovoltaic cells. Then this redox couple supplies the electron of the oxidized dye to regenerate the dye and completes the circuit for the photo generation of the current in the cell, see the following reactions and Figure 6 and 7.
DSSC reactions;[41]
S0 + hv S*
(dye absorbs solar light and electrons move from HOMO to LUMO)
S* + TiO2 S+ + TiO2-
(excited dye molecule transfers electron to titania)
TiO2- + 2/3 I3- TiO2 + 2I-
(electron goes to cathode side and reduce I3- to I-)
2I- + S+ S + 2/3 I3-
12
Figure 7. Schematic representation of a DSSC.
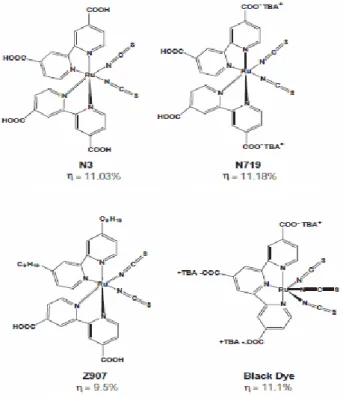
The investigations and experiments have shown that the polypyridyl complexes of ruthenium and osmium (see Figure 8)[42] have greater efficiency and long-term stability[43][44][45]. The maximum efficiencies of DSSCs are around 12-13%[43][45]. The goal in efficiency for DSSCs is to increase the efficiency to around 15 % for the commercialization of these cells.
13
Figure 8. Structures of some of the most efficient dye
molecules(cis-Bis(isothiocyanato)bis(2,2-bipyridyl-4,4-dicarboxylato)ruthenium(II)(N3), Di-tetrabutylammonium cis-bis(isothiocyanato)bis(2,2′-bipyridyl-4,4′-dicarboxylato)ruthenium(II)(N719),
cis-Bis(isothiocyanato)(2,2′-bipyridyl-4,4′-dicarboxylato)(4,4′-di-nonyl-2′-bipyridyl)ruthenium(II)(Z907), “black dye” (tris(cyanato)-2,2',2”-terpyridyl-4,4',4”-tricarboxylate)Ru(II)) for dye sensitized solar
cells.
1.5.2. Sensitizing Mesoporous Titania Using Quantum Dots
Highly efficient and cheap solar cells were produced using Ru based dyes at the beginning of 90s and many researchers have contributed to the DSSCs until now. Another group of researchers show that quantum dots can be a good alternative to the dyes for the solar cells; because the optical and electrical properties of quantum dots are suitable for solar cells[46][47]. Semiconductor
14
quantum dots have narrow emission spectrum, broad excitation spectra, very high extinction coefficient. In addition to these, by changing the sizes of the QDs, physical and chemical properties can be changed. For instance, band gap energy is very important for solar process and it is possible to control band gap energy of the quantum dots by controlling their particle size, see Figure 9[48].
Figure 9. Changing of the band gap of QDs with respect to particle size.
The operation of QDSCs is very similar to DSSCs. Firstly QDs absorb the sunlight and electrons move from the valance band of the QD to the conduction band of the QD. After that these electrons are transferred to conduction band of mesoporous titania and to conducting glass (FTO or ITO). Then electrons move to the cathode side of the electrochemical cell. In the cathode side, brass[48] or graphene and its derivatives especially RGO (reduced graphene oxide)-coated
15
FTO[49] is used and generally Sn2-/S2- redox couple is preferred as an
electrolyte.[50]
QDSC reactions;
QD + hv QD*(e-, h+)
(QD absorbs solar light and electrons move from the VB to CB)
QD*(e-, h+) + TiO2 QD(h+) + TiO2(e-)
(excited QD transfers electron to the CB of titania)
TiO2(e-) + ½ Sn-2 TiO2 + ½ Sn-12- + ½ S2-
(electron goes to cathode side and reduce Sn2- to S2-)
½ Sn-12- + ½ S2- + QD(h+) QD + ½ Sn2-
(S2- is oxidized to Sn2- by giving electron to the VB of QD)[51]
Actually reducing half reaction for sulfur is;
S + 2e- S
2-When the concentrated S and S2- solution is prepared in water, sulfurs combine both other sulfurs and one of sulfide to form Sn2- ;[52]
(n-1)S + S2- Sn
2-Therefore, the reduction half reaction of sulfur in water can be written as;[52]
2-16
Figure 10. Schematic representation of a QDSC.
In recent years, cadmium chalcogenides QDs (CdS, CdSe, CdTe) have been more popular in QDSC research[53][54][55][56]. The band gaps of bulk CdS, CdSe and CdTe are 2.25, 1.73, 1.49 eV, respectively and these QDs, especially CdSe and CdTe, can absorb nearly all visible spectrum[57]. Most efficient examples of these cadmium chalcogenide QDSCs are around 5-6% [58][59][60]. Nowadays, QDSC efficiencies pass over 7% and the highest value for efficiency is 8.6%[61][62].
1.6. The CdSe-TiO2 Solar Cells
If the energy of photon is equal to or greater than the band gap energy of the semiconductor; the photon can be absorbed by the semiconductor by exciting
17
an electron to the CB. The bulk band gap of CdSe is 1.74 eV, which means CdSe can absorb nearly all visible range[63].
A similar electrochemical/photochemical process takes place in the CdSe sensitized TiO2 solar cells similar to dye sensitized solar cells (Route 2 in Figure 11 and route 4 in Figure 11). However, there are other paths for these electrons to flow in the cell, which reduce the solar efficiency of the cells. The excited electrons can be directly transferred to the electrolyte from the CB of CdSe (Route 5 in Figure 11) and/or from the CB of TiO2(P25) (route 6 in Figure 11) due to direct contact of the electrolyte solution and the electrodes in these electrochemical cells. To minimize this problem; a protecting layer is coated over the CdSe-TiO2 anode electrode[59][64].
Figure 11. Schematic representation of the operation of the CdSe-TiO2(P25) solar cell.
In the literature, the highest efficiencies of CdSe based QDSCs are around 5-6%[58][59][60]. Many groups, in the world, are trying to increase the efficiency
18
of these cells using different methods, such as doping different metal ions, mixing cadmium selenide with cadmium sulfide, and modifying anode side etc.[58]
1.7. Efficiency Measurements and Calculations of the Solar Cells
The efficiency for a solar cell can be described as the ratio of energy output from the cell to input energy, energy of the 1 sun exposed to the cell. Efficiency of a solar cell is the best parameter to compare the performance of one solar cell to another[65].
In order to get a comparable efficiency, some parameters must be kept constant. For instance the temperature and power of the light source have effects on the efficiency. Generally, the temperature is kept constant at 25 oC and the power of the light source, at 1 sun(1000 W/m2)[66][67].
The efficiency of a solar cell is equal to ratio of maximum power (Pmax) to input power (Pin).
η = Pmax/Pin, where Pmax is calculated from the following equation, Pmax = VOC*ISC*FF,
Pin = 1000 W/m2(under 1 sun condition)
FF = (Vmp*Imp)/(Voc*Isc) = AreaA/AreaB (in Figure 12) [68]
FF(fill factor) is one of the most important parameter for efficiency. If any cell has high fill factor, it has a low equivalent series resistance and a high equivalent of shunt resistance, which means that produced current does not dissipate much inside the cell[69]. Typical commercial solar cell has a fill factor of 0.70 or greater and generally in thin film cells between 0.4 and 0.7[70].
19
The short circuit current (ISC) is the current, when the solar cell is short circuited, where the voltage is equal to zero. The open circuit voltage(VOC) is the voltage at zero current and it is the maximum voltage available from a solar cell. The Vmp and Imp are the voltage and current values at maximum power (maximum I*V value), respectivelly [69] (see Figure 12).
20
Chapter 2:
Experimental
2.1. MaterialsAll chemicals and solvents were reagent grade and used as received without any further treatment.
The surfactants are 10-lauryl ether, CH3(CH2)11(OCH2CH2)10OH, (designated as C12EO10, Mw = 626.9 g/mol, Aldrich) and cetyltrimethylammonium bromide, C16H33N(CH3)3Br, (designated as CTAB, Mw = 364.45 g/mol, Aldrich). The used salts are: cadmium(II) nitrate tetrahydrate ([Cd(H2O)4](NO3)2 99%, Fluka), zinc(II) nitrate hexahydrate ([Zn(H2O)6](NO3)2. 98%, Aldrich), copper(II) nitrate pentahydrate ([Cu(H2O)5](NO3)2., Aldrich), iron(III) nitrate nonahydrate (Fe(NO3)3.9H2O, 99%, Aldrich), cobalt(II) nitrate hexahydrate ([Co(H2O)6](NO3)2, 98%, Aldrich), manganese(II) nitrate tetrahydrate ([Mn(H2O)4](NO3)2., 98%, Aldrich), sodium sulfide nonahydrate (Na2S.9H2O, 98%, Aldrich). The other compounds are: Hydrogen selenide (H2Se, 99.99%, Air Products), ethanol (C2H5OH, 99.9%, Merck), hydrochloric acid (HCl, %37, Reidel-de Haën), hydrofluoric acid(HF, 40-45%, Aldrich), nitric acid (HNO3, %65, Reidel-de Haën), titanium tetrabutoxide (Ti(OC4H9)4, %98, Aldrich), tetramethylorthosilicate (TMOS, %99, Aldrich), polyethylenimine, branched (designated as PEI, MW = 25000 g/mol) and sulfur (S8, 99.5%, Aldrich).
21 2.2. Coating of FTO with Protecting Layer
Fluorine doped tin dioxide (FTO) coated glass was used for the deposition of anode that was first coated with a thin layer of bulk titania. Firstly, some part of the FTO glass is isolated by a scotch tape. Then, the FTO glass is spin coated with a solution of 5 ml ethanol and 0.25 g of Ti(BuO)4 and 0.5 g nitric acid at 2000 rpm and heated at 450 oC for 15 min.
2.3. Synthesis of Mesoporous Cadmium Titanate Thin Films (meso-CdTiO3)
Dissolve 0.500 g C12EO10 and 0.291 g CTAB in 5 ml ethanol. Then add 1.970 g (for 8:1 salt: surfactant ratio) [Cd(H2O)4](NO3)2 and stir the solution for 5 min. Add 0.50 g HNO3 and then 1.970 g Ti(OBu)4 to the above solution and stir the solution for another 5 min. Locate the glass or FTO coated glass over the spin coater and put an above solution as drops and spin at 1000 rpm for 30 seconds. Immediately after spin coating, place the film into an oven at 65 oC and calcine the sample up to 450oC with a 1o/min increments. The same procedure was employed for the other composition by only changing the cadmium nitrate amounts, see Table 1.
2.4. Preparation of Mesoporous Titania(P25) Films (meso-TiO2)
1.5 g P25 (titania, Aldrich grade) was dispersed into 5 ml ethanol and stirred and sonicated for 30 min and then 0.25 ml of Ti(BuO)4 was dropped into
22
the dispersion and stirred for 5 minutes. The dispersion is spread over glass or FTO coated glass by using either a spin coater or doctor-blade method. Then the films were calcined at 450oC for 1 hour, denoted as meso-TiO2.
2.5. Synthesis of Mesoporous Cadmium Titanate-Titania Films (meso-CdTiO3-TiO2)
Dissolve 0.500 g C12EO10 and 0.291 g CTAB in 5 ml ethanol. Then add 1.970 g(for 8:1 salt: surfactant ratio) [Cd(H2O)4](NO3)2 and stir the solution for 5 min. Add 0.5 g HNO3 and 1.90 g Ti(OBu)4 to the above solution and stir the solution again for another 5 min. Locate the meso-TiO2 film over the spin coater and put an above solution as drops (make sure the solution really soaks into the film) and spin at 1000 rpm for 30 seconds. Immediately after spin coating, place the film into an oven at 65oC and heat the sample up to 450oC with a 1o/min increments. The same procedure was employed for the other composition by only changing the cadmium nitrate amounts, see Table 1.
2.6. Synthesis of Mesoporous Cadmium Oxide-Silica-Titania Films (meso-CdO-SiO2-TiO2)
Dissolve 0.500 g C12EO10 and 0.291 g CTAB in 5 ml ethanol. Then add 1.970 g(for 8:1 salt: surfactant ratio) [Cd(H2O)4](NO3)2 and stir the solution 5 min. Add 0.85 g TMOS and 0.05 g HNO3 to the above solution and stir the solution for 5 min again. Locate the meso-TiO2 film over the spin coater and put an above solution as drops (make sure the solution really soaks into the film) and spin at 1000 rpm for 30 seconds. Immediately after spin coating, place the film
23
into an oven at 65oC and heat the sample up to 450oC with a 1o/min increments. The same procedure was employed for the other composition by only changing the cadmium nitrate amounts, see Table 1.
2.7. Synthesis of Mesoporous Cadmium Selenide-Titania Thin
Films(meso-CdSe-TiO2), Cadmium Selenide-Silica-Titania Films (meso-CdSe-SiO2-TiO2) and Cadmium Selenide-Titania-Titania Films(meso-CdSe-TiO2-TiO2)
Insert the calcined meso-CdTiO3, meso-CdO-SiO2-TiO2 or meso-CdTiO3 -TiO2 into vacuum chamber designed for an H2Se reaction (see Figure 13) and evacuate the chamber for a few minutes before exposing the sample to an H2Se atmosphere. Put about 100 torrs of H2Se and carry the reaction for 30 min at 100oC. Evacuate the chamber by pumping the unreacted H2Se and water (side product) to the atmosphere through the fume hood and remove the films for analysis and further treatments.
24
Figure 13. Experimental setup for H2Se reaction.
2.8. Removing Silica from the meso-CdSe-SiO2-TiO2 Films
Gently wash the above films (section 2.7) by using few drops of 4% HF acid over the films (this step is critical to keep the film over the substrate as one piece). Then, immediately wash with a large amount of ethanol and dry using air-dryer.
25
2.9. Synthesis of Mesoporous Cadmium Metal Titanate Thin Films (meso-CdxM1-xTiO3), Cadmium oxide-Metal Oxide-Silica-Titania Films (meso-CdO-MO-SiO2-TiO2) or Cadmium Metal Titanate-Titania Films (meso-CdxM1-xTiO3-TiO2) and Their H2Se Reactions
The procedures in section 2.3, 2.5 and 2.6 were employed by adding dopant metal source (Cu(NO3)2, Fe(NO3)3, Co(NO3)2, Zn(NO3)2 and Mn(NO3)2 salts) together with the cadmium nitrate salt. The dopant metal content was varied between 0.01 and 0.15 Metal/Cd mole ratio (Table 2). The other synthesis steps for the samples are the same as in the sections 2.3, 2.5 and 2.6 respectively. Then the films were exposed to H2Se gas as in section 2.7.
2.10. Preparation of the Electrolyte Solution and Counter Electrode.
Prepare the electrolyte solution containing 2 M Na2S.10H20 and 2 M S8 in 10 ml water. The counter electrode was prepared by etching brass with 1 M HCl for 5 min at 70oC and reacted with 0.10 M Na2S.10H2O solution.
2.11. Coating the Anode Electrode with Passivation Layers
2.11.1. Coating with CTAB
40 mL 0.1 M CTAB solution was prepared with ethanol (20 mL) and water (20 mL). The CdSe-TiO2 films are immersed into the CTAB solution and kept 20 seconds in the solution. After washing the film with ethanol, this dipping process was repeated twice and then dried in an oven at 80oC to remove ethanol.
26 2.11.2. Coating with Zinc Sulfide
40 mL 0.1 M Zn(NO3)2 solution and 40 mL 0.1 M Na2S solution were prepared. The solvents were ethanol (20 mL) and water (20 mL). The CdSe-TiO2 films are immersed into the Zn2+ solution at first and kept for 20 seconds in this solution. Then the films are washed with ethanol. Then these films are immersed into the S2- solution and kept for 20 seconds in this solution (ZnS forms). After washing with ethanol, this process is repeated 2 more times to ensure enough coverage of the empty titania and CdSe surfaces, and finally dried in an oven at 80oC to remove ethanol.
2.11.3. Coating with branched-Polyethyleneimine
40 mL 0.1 M branched-polyethyleneimine (PEI) solution was prepared in ethanol. The CdSe-TiO2 films are immersed into the PEI solution and kept for 5 to 10 minutes in this solution. The waiting time is greater than CTAB and ZnS because PEI’s diffusion is slower. After washing with ethanol, this process was not repeated any more -because the waiting time was long enough- and after all the films are dried in oven at 80oC to remove ethanol.
27 sample code Cd/silica or titania mole ratio Cd/surf actant mole ratio
The amounts of chemicals(g)
[Cd[(H2O)4]
(NO3)2 C12EO10 CTAB TMOS Ti(OBu)4 HNO3 C2H5OH
si4 0.57 4 0.99 0.50 0.29 0.85 - 0.05 5.00 si6 0.86 6 1.48 0.50 0.29 0.85 - 0.05 5.00 si8 1.14 8 1.97 0.50 0.29 0.85 - 0.05 5.00 si10 1.43 10 2.47 0.50 0.29 0.85 - 0.05 5.00 ti4 0.57 4 0.99 0.50 0.29 - 1.90 0.50 5.00 ti6 0.86 6 1.48 0.50 0.29 - 1.90 0.50 5.00 ti8 1.14 8 1.97 0.50 0.29 - 1.90 0.50 5.00 ti10 1.43 10 2.47 0.50 0.29 - 1.90 0.50 5.00
Table 1. The amounts of chemicals used in the preparation of meso-silica-CdO and
meso-CdTiO3.
Metal/C d mole ratio
The amounts of chemicals(g) [Cu(H2O)5] (NO3)2 Fe(NO3)3. 9H2O [Co(H2O)6] (NO3)2 [Zn(H2O)6] (NO3)2 [Mn(H2O)2] (NO3)2 0.01 0.018 0.026 0.019 0.019 0.014 0.05 0.09 0.13 0.09 0.10 0.07 0.10 0.18 0.26 0.19 0.19 0.14 0.15 0.27 0.39 0.28 0.29 0.21
Table 2. The amounts of extra metal sources(metal salts). All of these salts are added to
28
Chapter 3:
Instrumental
3.1. Raman SpectraThe Raman spectra were obtained by using LabRam model confocal Raman microscope with a 300 mm confocal length. The spectrometer is equipped with HeNe laser operated at 20 mW, polarized 500:1 with a wavelength of 632.814 nm and a diode-pumped solid state laser operated at 50 mW, polarized 100:1 with a wavelength of 532.1 nm and a 1024 x 256 element CCD camera. The collected signal was transmitted via a fiber optic cable into a spectrometer with 600 or 1800 g/mm gratings. The spectra was collected by manually placing the probe tip on the desired point of the sample over the glass, FTO glass or silicon wafer. Changes in Raman spectra are followed using a timer.
3.2. Solar Simulator and I-V curves
Solar performance measurements were made by using an AM 1.5 solar Simulator equipped with a 300 W xenon lamp (Model no. 81172, Oriel). The light intensity was set to 1000 W/m2 by using a reference Si photodiode. I-V curves were obtained by applying an external bias to the cell and measuring the generated photocurrent using a Keithley model 2400 digital source meter.
29 3.3. X-Ray Diffraction (XRD) Patterns
The XRD patterns were collected by using Rigaku Miniflex diffractometer. The source was high power Cu-Kα operates at 30 kV/15 mA and generates x-rays with a wavelength of 1.54054 Å filtered using a Ni filter. The detector was a Scintillator NaI(T1) detector with a Be window. The samples were prepared on glass by spin coating. The measurements were made at small angles between 1o and 5o 2θ range with a 1 o/min scan rate and at high angles, between 20o and 80o, 2θ, range with a 5 o/min scan rate.
3.4. FTIR Spectra
The FT-IR (Fourier Transform-Infrared) spectra were collected using a Bruker Tensor 27 model FTIR spectrometer. The detector was a Digi Tech TM DLATGS with a resolution of 4.0 cm-1 in the 400-4000 cm-1 range and scan number was 128. For FTIR measurements, samples were prepared on IR transparent silicon wafers or pressed as a KBr pallets.
3.5. UV-Vis Absorption Spectra
The UV-Vis absorption spectra were obtained by using a Varian Carry 5 double beam spectrophotometer with a 600 nm/min speed and 0.2 nm resolution over a wavelength range from 200 nm to 800 nm. Measurements were collected on absorbance mode. Samples were spin coated on quartz for the measurements.
30 3.6. SEM Imaging and EDX Analysis
The SEM (Scanning Electron Microscopy) images were obtained using Zeiss EVO-40, operated at 20 kV equipped with a Bruker AXS XFlash EDX (Energy Dispersive X-ray Spectroscopy) detector 4010. Samples were prepared on silicon wafers and these wafers were attached to the aluminum sample holders using conducting carbon adhesive tabs.
31
Chapter 4:
Results and Discussion
The aim of the thesis is to synthesize anode materials for a solar cell using the MASA method. 3 different anode electrodes were prepared and 2 of them were investigated in detail. These are meso-CdSe-SiO2-TiO2 and meso-CdSe-TiO2-TiO2 films. The following abbreviations, si# and ti#, were used throughout the thesis. For instance, si6 means that the sample is meso-CdSe-SiO2-TiO2 and Cd/surfactant mole ratio is 6 and similarly ti8 means the sample is meso-CdSe-TiO2-TiO2 and Cd/surfactant mole ratio is 8.
4.1. Preparation of the Anode Electrode
The molten-salt assisted self-assembly (MASA) approach has been used for the preparation of the anode electrodes. The electrode materials have been characterized using FT-IR, UV-Vis absorption, Raman spectroscopy, SEM-EDX and X-ray diffraction (XRD) techniques. The MASA solution includes salt (Cd(NO3)2), surfactants (C12EO10 and CTAB), acid (HNO3), a polymerizing precursor (TMOS or Ti(OBu)4), and ethanol (solvent). There are two types of MASA solutions. Both solutions contain two surfactants, cadmium salt, acid with different amounts and a solvent; either water or ethanol depending on the polymerizing precursors. The difference arise from polymerizing precursors; solution 1 contains TMOS and water and solution 2 contains Ti(OBu)4 and
32
ethanol. Using these two solutions, 3 different main products were obtained (see Schema 4.1.1 and 4.1.2).
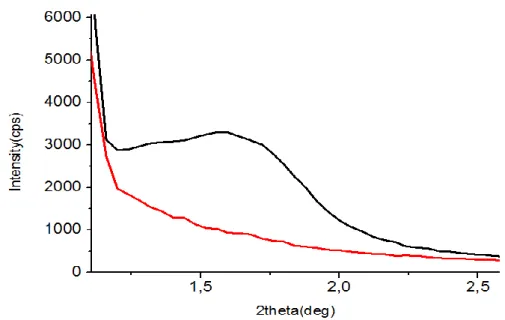
The above solutions are spin coated over a glass or P25 coated glass. The volatile solvent of the ingredients evaporate immediately after spin coating and results a gel-phase over the substrate as thin films or embedded into the pores of P25 films. The freshly prepared films diffract at small angles, indicating the formation of a mesophase. The small angle diffraction prove that there are surfactant domains and the distance between these regularly repeating domains are quite large that their diffractions are observed at small angles (1 to 5o, 2θ). After calcination of the films (silica and titania), the surfactant molecules are burned out and random mesopores are obtained, therefore x-ray diffractions at small angles disappear (see Figure 14). Burning of the surfactants has been followed by Karakaya et. al using FT-IR spectroscopy and it is found that the C-H bond frequencies at around 2900 cm-1 disappeared at around 250 oC[26][28].
33
Figure 14. Low angle XRD pattern of the films, obtained using the MASA process,
before (black) and after (red) calcination.
Figure 15 summarizes the entire process used in this thesis. The MASA process has been established and the materials have been well characterized in our group, using various microscopy, diffraction and spectroscopy techniques[26][28]. Therefore further characterization has been limited to XRD, Raman, and FT-IR techniques to ensure that the same materials to investigate its solar performance. The MASA process produces mesoporous CdO-SiO2 in the silica system and CdTiO3 in the titania systems[28].
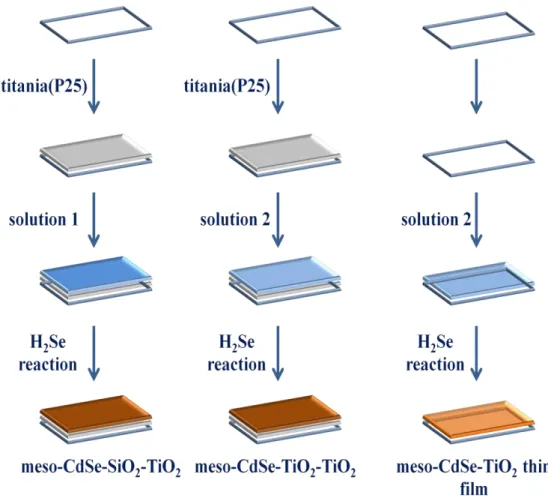
Figure 16 shows the coating processes, which are mostly developed in this thesis. The films upon calcination were exposed to H2Se to convert CdO and CdTiO3 into CdSe and CdSe-TiO2, respectively.
34
35
Figure 16. Synthesis pathway of 3 films; meso-CdSe-SiO2-TiO2, meso-CdSe-TiO2-TiO2
and meso-CdSe-TiO2 thin films.
After H2Se reaction, in all systems, the CdSe nanoparticles are formed. The SiO2 represents the silica pore walls in the mesoporous silica systems and TiO2 represent either mesoporous titania pore-walls or P25 (degussa) used to form the P25 based films. Upon CdSe formation, Raman, EDX and UV-Vis absorption techniques were used as major characterization techniques. It is clearly seen from the EDX spectra that the films have huge amount of selenium element after H2Se reaction (see Figure 17). The intense peak at 206 cm-1 in Raman spectrum also
36
proves the formation of CdSe nanoparticles. The small peak at 245 cm-1 is due to elemental selenium (see Figures 18 and 19).
However the Se/Cd ratio is low in the titania samples. The EDX data show that the Cd(II) in the silica react completely but the same reaction in the titania samples are not complete, see Figure 17 and Table 3.
Figure 17. EDX Spectra for si8 and ti8 samples.
The EDX studies of the silica and titania samples, with different Cd concentrations, show that both samples of 8 Cd/surfactant mole ratio have greater amount of Se (See Table 3). Moreover, the EDX and Raman spectra collectively show that the silica samples are more reactive than that of the titania samples. Therefore the amount of CdSe is greater in the silica sample.
37 cd/surfactant Si Ti Se/Cd Se Se/Cd Se 4 1.98 7.92 1.26 5.04 6 1.49 8.94 1.06 6.36 8 1.42 11.36 1.04 8.32 10 0.75 7.50 0.52 5.20
Table 3. Se/Cd ratios and relative Se amounts of si and ti samples at different Cd
concentrations.(from 4 to 10 Cd/surfactant ratio).
38
Figure 19. Raman spectrum of ti8 sample.
A huge absorption in the UV-Vis absorption spectrum also shows the formation of the CdSe nanoparticles, because the CdSe nanoparticles can absorb almost the entire visible spectrum. The P25 films have more absorbance than the CdSe thin films (see Figures 20, 21 and 22). According to the UV-Vis data, the samples prepared as thin films, without P25, absorb the visible light weakly, because these films are ultra-thin (typical thickness is around 400 nm). Therefore the solar efficiency measurements were generally made using P25 samples.
39
Figure 20. UV-Vis absorption spectrum of the si8 sample.
Figure 21. UV-Vis absorption spectrum of the ti8 sample.
40
Figure 22. UV-Vis absorption spectrum of the CdSe-TiO2 thin film.
For the silica samples, one more step may be necessary, the etching step. The silica sample reacts with very dilute HF solution and leach out from the samples as silicon fluorides. This can be monitored using FT-IR spectroscopy. The silica peak located at around 1050-1200 cm-1 completely disappears after washing with 4% HF solution. This step is carried out to enhance the efficiency in solar cell however the un-etched silica anodes work as well as etched samples (see chapter 4.3.9).
41
43 4.2. Raman Studies
Raman is a very useful technique for the characterization of CdSe-TiO2 films because both anatase and CdSe are very good Raman scatterers. Titania, anatase nanoparticles, has 4 characteristic peaks at around 140, 390, 510 and 630 cm-1. The peak at 135 cm-1 has the greatest intensity (see Figure 24)[71].
Figure 24. Raman spectrum of titania, anatase phase.
The CdSe nanoparticles also exhibit an intense peak at 206 cm-1 and in some spectra its first overtone can easily be seen at 415 cm-1 (see Figure 25). Both CdSe and TiO2 peaks are very intense and do not overlap to each other. Therefore it is easy to follow the variation in the CdSe amounts forming on constant amount of TiO2.
44
Figure 25. Raman spectra of the CdSe-SiO2-TiO2 samples.
During H2Se reaction of CdO, selenium can also form beside CdSe as aside product. Pure selenium has a Raman peak at 245 cm-1 and doesn’t overlap with the anatase or CdSe peaks (see Figure 26). So it is also possible to see the amount of selenium in the films. Selenium is also a good Raman scatterer but the Se amount is generally not as much as CdSe. Therefore Se peak (245 cm-1) cannot
45
be seen-especially if there is a large amount of CdSe beside the CdSe peak (206 cm-1).
Figure 26. Raman spectra of pure selenium(a) and meso-CdSe-TiO2-TiO2(b) film.
The intensity of CdSe peak was also monitored over time during laser exposure. If the substrate used is an insulator, such as microscope slides (glass), the CdSe intensity will be stable but if the substrate material is a conductor, such
46
as FTO or silicon, the CdSe intensity decreases over time during the Raman measurements and exposure of the laser light.
The Raman intensity of CdSe monotonically decreases if the samples are prepared over FTO or on silicon wafer. In this process, the Raman light pumps electron (from the valance band to the conduction band of CdSe, CdSe + hυ → CdSe*). With the help of a conducting substrate, these electrons flow into ground before they recombine with the holes in the CdSe nanoparticles. Thus, the CdSe nanoparticles decompose and its Raman intensity decreases over time. Actually, this process is the half reaction of a solar cell process; in the solar cell, the excited electrons move to cathode side, then to the electrolyte and finally to the VB of CdSe. In Raman process, there is no cathode side and CdSe decomposes. However, it is possible to change this problematic situation to an advantage. The rate of decomposition of CdSe nanoparticles is important and can give important information about the amount of CdSe or activity of CdSe in solar cells.
In the CdSe-TiO2 films, the amount of titania is constant therefore the spectra, recorded over time, can be normalized to titania peaks and the change of the amount of CdSe can be easily monitored. In all compositions, the CdSe peak intensity decreases over time (see Figures below). Although the CdSe on silicon is unstable for the Raman measurement; it is still possible to make a comment about the amount of CdSe in the samples.
Firstly, even though the cadmium salt concentrations are the same for the silica and titania samples, the CdSe amount is higher in the silica samples than that of the titania samples. Even for the silica sample prepared using 4:1
47
salt/surfactant concentration, the CdSe peak is very intense, even more intense than the most intense titania peak. However for the ti-4 sample, the CdSe peak is nearly not visible beside the titania peak (see Figure 27).
Figure 27. Raman spectral changes over time of the si4(a) and ti4(b) samples.
The CdSe peak intensity increases in both titania and silica samples with increasing Cd(II) in the oxides (CdO in the silica and CdTiO3 in the titania
48
samples) and the highest intensity of the CdSe peak is observed from the si8 sample, not from the si10 sample (see Figure 29 and 30). This result is also consistent with the EDX data. According to the EDX spectrum, the si-8 sample has more CdSe than si-10 sample (see Figure 30). Therefore it can be said that at 10 Cd/surfactant mole ratio, larger (bulk) CdO particles are produced and not as reactive with H2Se as the CdOs in the mesoporous structure to form CdSe.
Figure 28. Normalized Raman spectra of CdSe-TiO2 film for the si6(a) and ti6(b)
49
It is also possible to observe the first overtone of the CdSe nanoparticles at at 415 cm-1 from the silica samples. Normally the intensity of this peak is not very intense and overlaps with the characteristic peak of anatase at 388 cm-1. However in the silica systems, because of high intensity of CdSe, its first overtone can also be observed over the anatase peak and decreases in intensity over time under the laser beam, see Figure 29.
50
Figure 29. Normalized Raman spectra of the CdSe-TiO2 film for the si8(a) and ti8(b)
samples.
Another difference between the silica and titania samples is the amount of selenium. Around 250-260 cm-1, there is a broad peak that originates from the selenium particles. The Se/CdSe peak ratios are greater in the titania samples than that of the silica samples. In the titania system, the selenium formation is more prominent, for instance for the ti-4 sample, Se/CdSe peak ratio is near to 1. Over
51
the time, the Se peak also decreases, similar to the CdSe peak. So it can be concluded that Se also decomposes like CdSe, however the decomposition also takes place on the glass substrate, therefore the origin of the decomposition can be a chemical reaction (such as reaction with O2 to form selenium oxides) under the laser beam, instead of an electron transfer that derives the decomposition of CdSe particles. However, elucidation of the decomposition mechanism requires further investigations.
52
Figure 30. Normalized Raman spectra of the CdSe-TiO2 films for si10(up) and
ti10(down) sample.
Decomposition of the CdSe nanoparticles is normally a disadvantage but following the CdSe peak over time is possible and provides kinetics of the decompositions in various systems. Two different peak ratios are followed and plotted: [CdSe]t/[CdSe]0 and [CdSe]t/[TiO2]t, where [CdSe]t is the CdSe peak intensity at 206 cm-1 at any time, [CdSe]o is the CdSe peak intensity at first