XXX-X-XXXX-XXXX-X/XX/$XX.00 ©20XX IEEE
Modules of correlated genes in a gene expression
regulatory network of CDDP-resistant cancer cells
Dennis Jiménez-Vargas Posgrado en Ciencias Biomédicas, Sistema de Estudios
de Posgrado Universidad de Costa Rica
San José, Costa Rica [email protected]
Man Sai Acón Posgrado en Ciencias Biomédicas, Sistema de Estudios
de Posgrado Universidad de Costa Rica
San José, Costa Rica [email protected]
Özgür Sahin
Department of Molecular Biology and Genetics, Faculty of Science
Bilkent University Ankara, Turkey [email protected]
Erol Eyüpoğlu
Department of Molecular Biology and Genetics, Faculty of Science
Bilkent University Ankara, Turkey [email protected]
Yasser Riazalhosseini Department of Human Genetics
McGill University Quebec, Canada [email protected]
Jose Molina-Mora CIET, Facultad de Microbiología
Universidad de Costa Rica San José, Costa Rica [email protected]
Jose Guevara-Coto CIBCM / Escuela de Biología
Universidad de Costa Rica San José, Costa Rica [email protected]
Rodrigo Mora-Rodríguez CIET / Laboratorio de Quimisensibilidad Tumoral,
Facultad de Microbiología Universidad de Costa Rica
San José, Costa Rica [email protected]
Abstract—Chemotherapeutic drugs have been used as important
strategies in cancer treatment. However, chemotherapy-resistant tumors arise especially in relapsing and progressive disease. Understanding of mechanisms underlaying Cisplatin-CDDP chemotherapy resistance may help find new therapeutic targets to revert this phenotype. The aim of this work, through an integrative Systems Biology approach, is to optimize an in silico model of TFs-miRNAs gene expression regulatory network of CDDP-chemoresistant cancer cell lines. By identifying modules of co-expressed genes in this regulatory network we expect further understanding of CDDP-chemoresistant phenotype. A set of deregulated genes was determined for two CDDP-chemoresistant cancer cell lines by considering gene copy number and transcriptomics. These genes were used as input targets for the construction and fitting of a large scale ordinary differential equations (ODE) model using our biocomputational platform previously reported. Model optimization was performed using COPASI and modules of correlated genes were determined using WGCNA. A model of 108 deregulated target genes, 44 transcription factors and 21 miRNAs was successfully constructed and optimized. Eleven modules of correlated genes were determined along with their gene product annotation. This report contributes to the understanding of the complex regulatory networks of CDDP-resistance and the future design of therapeutic strategies to overcome drug resistance.
Keywords—Cancer, Chemoresistance, CDDP, TF, miRNA, Gene expression regulatory network, Modules of correlated genes
I. INTRODUCTION
Cancer describes a heterogeneous group of diseases characterized by the ability of cells to sustain chronic proliferation (tumor growth) and invasion of other tissues (metastasis) [1,2,3]. Normal cells carefully control their progression through the cell cycle, ensuring a normal tissue architecture and function. In contrast, cancer cells deregulate
the signals that control cell cycle, losing its normal function and acquiring the traits that enable them to become pathogenic [1].
The hallmarks of cancer are functional capabilities that allow cancer cells to survive, proliferate and disseminate [1]. Despite all the progress in the understanding of cancers, the complexity and diversity of all the cellular processes involved as well as the adaptive and evasive strategies developed by cancers under attack, have hampered our ability to develop curative therapies. Therefore, scientific effort will have to continue to better understand cancers and to explore different treatment strategies [2].
Chemotherapeutic drugs, which interfere with cancer cells metabolism, have been used as important strategies in cancer treatment. However, as soon as these drugs were used in clinical practice, resistant tumors arose, especially in relapsing and progressive disease [4]. The mechanisms underlying chemotherapy resistance are diverse: drug inactivation, detoxifying systems, membrane transport proteins changes, differential expression of proteins, activation of DNA repair systems, loss of tumor suppressor systems, among others [4,5]; and chemotherapy resistance seems to be intrinsic to the early steps of the pathway for full malignant transformation of cancer cells [4].
Cisplatin (cis-diammine-dichloro-platinumII-CDDP) is one of the most potent chemotherapies known [5–10]. The initial response rate to cisplatin-based chemotherapy is high, although it is not lasting durable, due to the emergence of cisplatin-resistant tumors, which are cross-cisplatin-resistant to diverse unrelated antitumor drugs, complicating thereby the treatment of these patients [5,6]. The cytotoxicity of CDDP and other platinating agents is mediated mainly by their interaction with DNA to form DNA adducts (nuclear and mitochondrial), which activate several signal transduction pathways and culminate in
apoptosis [5–10]. Nevertheless, DNA damage-mediated apoptotic signals can be attenuated, and the resistance that ensues is a major limitation of CDDP-based chemotherapy [5,6].
The mechanism that promotes CDDP-chemoresistance seems to be multifactorial. They may include inhibition of drug intake, increased drug efflux, increased inactivation by thiol-containing molecules (GSH increase and metallothioneins), increased xenobiotic detoxification, increased DNA damage repair, inhibition of proapoptotic pathways and increased tolerance to DNA damage (frequently by p53 dysfunction); furthermore, a combination of the above is usually observed in chemoresistant cells [5–9]. More recently, epigenetic changes, deregulation of miRNA expression, and activation of EMT pathway have been also involved in CDDP-chemoresistance [8–10].
During the last years, a high number of high-content/high-throughput studies have analyzed the complex problem of CDDP-resistance, as reviewed in [10]. Reference [10] reports studies that examined genomic, transcriptomic, methylomic and proteomic data and their correlation with CDDP-resistance; [10] also reports studies of large-scale silencing approaches and functional screenings to determine whether the inhibition of specific proteins alters CDDP-sensitivity; and additionally, [10] reports studies that assessed whether particular (or combinations) of SNPs are associated with CDDP-sensitivity. However, the need to explore and determine the networks regulating the phenotype of sensitive and chemoresistant cancer cells remains. This is especially true for the transcription factors-miRNAs interactions (TFs-miRNAs) [11], described as potentially key regulatory nodes of the network. This could make them therapeutic targets to revert chemoresistance.
The aim of this work, through an integrative Systems Biology approach, was to optimize an in silico model of TFs-miRNAs gene expression regulatory network of a group of target genes deregulated in CDDP-resistant cancer cells. By identifying modules of co-expressed networks associated with miRNAs, we expect further understanding of chemoresistant phenotype in cancer cell lines.
II. METHODOLOGY
A. Target gene selection for model construction
Selection of target genes for construction of the gene expression regulatory network of CDDP-resistance was performed using information from cancer cell line studies from our collaborators at the Özgür Sahin Laboratory, Bilkent University, Turkey (http://ozgursahinlab.com/). DNA copy number and transcriptomic analysis (RNA-microarray) of two CDDP-resistant breast cancer cell lines (HCC1937 = HC and MDA-MB-436 = MD) were performed, and results were compared with the expected relation function exp = log2 (DNA-ratio), where exp represents the expected gene expression level
(log2_change) and DNA-ratio is the DNA copy-number-ratio between CDDP-resistant and CDDP-sensitive cell lines. The genes where the function exp was properly calculated, were
considered targets and used in the construction of gene expression regulatory network model.
B. Construction of TFs-miRNA gene expression regulatory network
We used the biocomputational platform developed by Acón
et al. 2016 [12] to model the TFs-miRNAs gene expression
regulatory network. The platform was designed to include data from multiple sources. DNA copy number, RNA gene expression and protein expression data were incorporated from experiments on the NCI60 panel gene. miRNA data from Mirtarbase and MiRBase, and regulation data from Transmir, Pazar, TRED and CircuitsDB was also incorporated by the platform. Using the list of target genes as inputs, the platform identifies TFs and miRNAs that regulate each input, and a model topology is built using these three types of species (target genes, TFs and miRNAs), which are incorporated in a SBML model. A series of parameters are included in the SBML model: for each species synthesis and degradation rates; for miRNAs repression rate; and for TFs activation and repression rates. The SBML model was later imported into COPASI [13] altogether with experimental data of CGH, RNA and miRNA expression.
C. Optimization of the TFs-miRNA gene expression network model
Optimization (fitting) of CDDP-resistant cancer cell lines model was performed utilizing the “Parameter Estimation” function in COPASI [13]. This process calculates parameters using a dataset, which was the experimental data previously obtained by the biocomputational platform [12]. Parameter Estimation process was performed using the method of Hooke and Jeeves, which is a direct search algorithm for the minimum of a nonlinear function without requiring derivatives. It uses a heuristic that suggests a descending direction according to values of the function calculated in a number of previous iterations. The Hooke and Jeeves searches for a local minimum of the objective function.
The adjustable variables in Parameter Estimation process included target genes, transcription factors and miRNAs. Adjustment to the experimental data after the Parameter Estimation process was analyzed using a paired-sample t-student test in R [14], where initial concentration for experimental data and model was compared for each species in the 59 experiments (59 cell lines in the NCI60 panel).
D. Determination of modules of correlated genes affected by miRNAs and their gene ontology
Determination of modules correlated genes associated with miRNAs in the model of TFs-miRNA gene expression regulatory network for CDDP-resistant cancer cell lines was performed in two main steps. In the first step, “Steady-State Analysis” function in COPASI [13] was used to determine the stability and the initial concentration values of all the species of the adjusted model. Next, the same Steady-State Analysis function was used in an iterative process for each miRNA: the parameter CGH was set to 0 to simulate the absence of the miRNA of interest in each iteration, and the stability and initial
concentration values of all the species were obtained. Finally, the ratio of change log2_change = log2(conc_miR/conc_adj) for
each species was calculated, where conc_miR is the concentration of a species in a specific iteration of miRNA-Cgh-change and conc_adj is the concentration of that species in the adjusted model.
Subsequently, the ratio of change (log2_change) of all the
model species was used to determine the gene regulation modules and their gene product annotation (gene ontology). The R-package WGCNA [15] was implemented to find modules of highly correlated genes. A gene co-expression network finds groups of correlated genes. As such, the measure of correlation is used to quantify gene co-expression. Genes are grouped through hierarchical clustering, and dynamic tree cut function allows module identification and outlier removal, respectively [15]. In this test case, the input data was gene expression profile (ratio of change of all target genes of the model) for n samples (n is the number of iterations of miRNA-CGH-change). Finally, from DAVID-Bioinformatics Resources 6.8 [16], the tool Gene Functional Classification was used to determine provide functional annotation of the models.
III. RESULTS
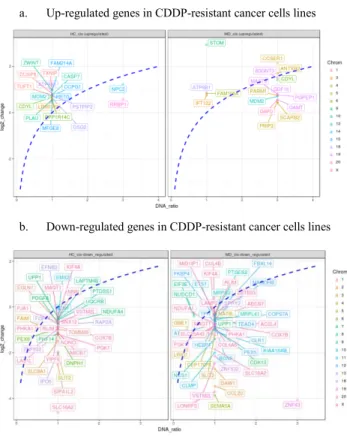
A. The analysis of DNA copy number and transcriptomic information of CDDP-resistant cancer cell lines resulted in 108 target genes for model construction
To obtain the set of target genes for the construction of the gene expression regulatory network, we analyzed the DNA copy number and transcriptomic data from two CDDP-resistant breast cancer cell lines (HC and MD). Our results indicated 108 deregulated target genes (Fig.1). These candidates were subsequently used to construct the gene expression regulatory network.
B. The model of TFs-miRNA gene expression regulatory network of CDDP-resistant cells constructed consists of 108 target genes, 44 transcription factors and 21 miRNAs
To construct the model of TFs-miRNA gene expression regulatory network of CDDP-resistant cells we used the biocomputational platform [12] and the 108 deregulated genes as inputs. Our model included the following gene species: 108 deregulated target genes (observables), 44 transcription factors and 21 miRNAs, which are represented in a model topology (Fig.2).
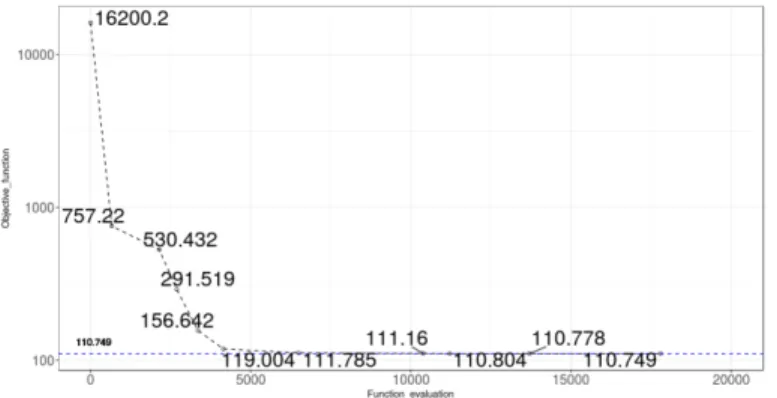
C. The model of TFs-miRNA gene expression regulatory network of CDDP-resistant cells was adjusted to the experimental data of the NCI60 panel after 17796 evaluations of Hooke and Jeeves method
To adjust the generated model of TF-miRNAs gene expression regulatory network with the experimental data of NCI-60 panel, the Parameter Estimation function in COPASI [13] was utilized with the method of Hooke and Jeeves, with
a. Up-regulated genes in CDDP-resistant cancer cells lines
b. Down-regulated genes in CDDP-resistant cancer cells lines
Fig. 1. Relation between DNA copy number (DNA-ratio) and transcriptomic analysis (log2_change) of two CDDP-resistant breast cancer cell lines (HC and MD) for target gene selection. 1.a. Significantly up-regulated genes in CDDP-resistant cancer cells lines 1.b. Significantly down-regulated genes in CDDP-resistant cancer cells lines. Chrom color indicates chromosomal location of each gene. Blue-dashed line denotes the expected relation function exp = log2(DNA-ratio), where exp is the expected gene expression level (log2_change) and DNA-ratio is the DNA copy-number-ratio between CDDP-resistant and CDDP-sensitive cell lines
Fig. 2. Topology of the TF-miRs gene expression regulatory network of CDDP-resistant cancer cell lines
iteration limit of 10 and tolerance of 10-5. The fitting of the
parameters of the model to the experimental data, after the Parameter Estimation process, was analyzed using a paired-sample t-student test in R (14) for the observed (experimental data) and calculated (model) initial concentration for each model species in the 59 experiments (59 cell lines in the NCI60 panel). The initial objective function value (error) calculated for the model was 16200.2, and, after 17796 evaluations, the final objective function value calculated for the model was 110.749 (Fig.3A). All the 173 species of the model had non-significant differences between the experimental and model initial concentration values (Fig.3B). Overall, the process of adjustment shows small differences between experimental and modelled initial concentration values for the dependent species (target genes, TFs and miRs) (Fig.3C).
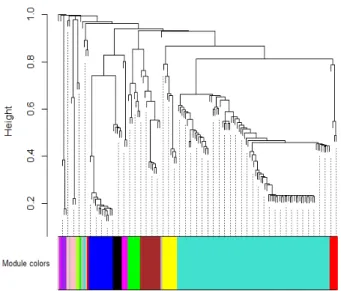
D. Eleven modules of correlated genes affected by miRNAs are found in the model of gene expression regulatory network by TFs-miRNA of CDDP-resistant cells
To determine the modules correlated genes associated with miRNAs of the model of TFs-miRNAs gene expression regulatory network for CDDP-resistant cancer cell lines, the ratio of change of the concentration of all the species was determined from the Steady-State Analysis in COPASI [13], where we defined a value of CGH=0 for each miRNA in an iterative manner. Based on these ratios, WGCNA [15] was implemented which resulted in a co-expression network (Fig.4) which corresponded to correlated genes. These modules were then analyzed with functional annotation using DAVID-Bioinformatics Resources 6.8 [16]. Eleven modules of correlated genes were found in the model of gene expression regulatory network (Fig.4) and their functional annotation was determined (Table 1). The Steady-State Analysis function is based on the eigenvalues of the Jacobian matrix; all the analysis performed, including the adjusted model and the iterations of miRNA-effect present an asymptotically stable state, with transient states in its vicinity that have oscillatory components. These last results indicate that, after small perturbations in the parameters of each model, the steady-state will be eventually reached.
IV. DISCUSSION
Cisplatin (cis-diammine-dichloro-platinumII-CDDP) is one of the most effective broad-spectrum anticancer drugs [8]. Patients usually have good initial response to the therapy, but eventually the disease relapse due to chemoresistance [8]. The approach presented of this study, based on systems biology, which build a model of TFs-miRNAs gene regulation and weighted gene correlation network analysis WGCNA, for target identification in CDDP-chemoresistant cancer cell lines, may further help understand chemoresistance.
The search of informative genes is a major focus of health-oriented research. The potential discoveries can lead to valuable information that can be used on drug-target research as well as in drug trials. The information generated in studies such as the one presented here can provide valuable insights into the development, prognosis, and treatment response of cancer patients [17]. By focusing on the behavior of common
a.Progress of fit (objective_fuction = error)
b. t-student test results
c. Initial concentration values for all the species in the model (calculated), experimental (NIC-60 panel) and their difference. Top = target genes. Bottom left = TFs. Bottom rigth = miRNAs.
Fig. 3. Results of the process of model optimization. 3.a. Progress of fit of the optimization process of the model. 3.b.Probability of the t-student test for all the species in the model (dashed-blue-line represents p=0.05). 3.c. Model and experimental initial concentration values for all the species included in the model.
traits of target genes, which is the main purpose constructing networks, is possible to better describe the properties of complex human diseases, such a cancer. Based on this, recent studies have examined the properties of expression profiles through a network perspective, focusing on several cancer types [17–19]. For example, Chen et al. [18], using a co-expression approach, identified target genes that could be used as prognostic markers and provide information for the development of treatment targets in gastric cancer. Jin et al. [19], similarly, identified modules with deregulated pathways for hepatocellular carcinoma. These insights demonstrate the power of the network approach for target gene identification. Our data (Table 1), suggests that it is possible to identify gene modules, comprising correlated genes, and subsequently, using annotation to identify associated function. This provided significant insight about the biological processes and molecular functions that were assigned to each module and demonstrates that an integrative approach based on Systems Biology can further our comprehension on target identification for chemoresistance studies.
Regarding our results of module functional annotation (Table1), regulation of gene expression was associated with seven modules (Blue, Brown, Black, Purple, Red, Turquoise and Yellow), oxygen metabolism and response to hypoxia were associated with one module (Green), apoptotic process and its signaling were associated with two modules (Magenta, Purple), organ development and tissue healing were associated with three modules (Pink, Red, Turquoise), signal transduction pathways were associated with 2 modules (Blue, Yellow) cell proliferation and cell size were associated with two modules (Greenyellow, Pink, Turquoise), and miRNA metabolism was associated with one module (Yellow).
This work is different from previous studies because it describes modules of correlated genes that are directly influenced by miRNAs, which have been reported as master regulators of gene expression. It is possible that, by experimentally altering miRNAs, many deregulated genes may change their expression, and modify cancer cells phenotype. Furthermore, module Turquoise is a relevant result because it contains 80 co-expressed genes in this TFs-miRNAs gene regulatory network, which may have a major role in the CDDP-chemoresistant phenotype. Altogether, these results imply a highly compartmentalized regulatory network of gene expression in CDDP-chemoresistant cancer cell lines.
TABLE I. FUNCTIONAL ANNOTATION FOR THE 11 MODULES OF CORRELATED GENES ASSOCIATED WITH MIRNAS OF THE TFS-MIR MODEL OF GENE EXPRESSION REGULATORY NETWORK OF CD-DP-RESISTANT CANCER CELL LINES
Modules of correlated genes
Color Number of Genesa Gene ontology enrichment
Blue 13 GO:0010628~positive regulation of gene expression GO:0030522~intracellular receptor signaling pathway Brown 11 GO:0000122~negative regulation of transcription from RNA polymerase II
promoter
GO:0006351~transcription, DNA-templated
Black 5 GO:0005515~protein binding GO:0006351~transcription
Green 8
GO:0032364~oxygen homeostasis GO:0061418~regulation of transcription from RNA polymerase II
promoter in response to hypoxia Greenyellow 2 GO:0008361~regulation of cell size
Magenta 4
GO:0006915~apoptotic process GO:1900740~positive regulation of protein insertion into mitochondrial membrane involved in apoptotic
signaling pathway
Pink 4
GO:0042060~wound healing GO:0070374~positive regulation of
ERK1 and ERK2 cascade
Purple 3
GO:0045893~positive regulation of transcription, DNA-templated GO:0006915~apoptotic process
Red 5
GO:0008584~male gonad development GO:0006366~transcription from RNA
polymerase II promoter
Turquoise 80
GO:0000122~negative regulation of transcription from RNA polymerase II
promoter GO:0009887~organ morphogenesis GO:0045893~positive regulation of transcription, DNA-templated GO:0008285~negative regulation of cell proliferation Yellow 8 GO:1902895~positive regulation of pri-miRNA transcription from RNA
polymerase II promoter GO:0007183~SMAD protein complex
assembly
Gray 5 Genes not-included in any module a.Genes included are target genes and transcription factors Fig. 4. Cluster Dendrogram for the modules of correlated genes affected by
miRNAs in the model of gene expression regulatory network by TFs-miTNA of CDDP-resistant cells. Height is a measure of dissimilarity and the colors represent each module
Previous studies have revealed complex and multifactorial changes in CDDP-chemoresistant cancer cell lines, including changes in gene expression patterns, DNA metabolism and miRNA metabolism, among others, as reviewed in [8]. Future experimental research will have to address the exact contribution of the modules of correlated genes described here on CDDP-chemoresistance.
V. CONCLUSIONS
Our Systems Biology integrative approach enabled the construction of a model that represents the gene expression regulatory network of CDDP-chemoresistant cancer cell lines and the functional annotation for modules of correlated genes. We adjusted a SBML model of 108 deregulated target genes, 44 TFs and 21 miRNAs to experimental data from NCI-60 panel. Eleven modules of co-expressed genes associated with miRNA inhibition were determined alongside its functional annotation. Further experimental work is required to confirm therapeutic potential of these miRNA target inhibition for the design of novel therapeutic strategies to overcome CDDP-resistance in cancer.
ACKNOWLEDGMENT
We thank the Master Program of Bioinformatics and Systems Biology of Universidad de Costa Rica for the continuous support. We also thank Guillermo Oviedo for the annotation of the chromosomal locations of our genes of interest.
REFERENCES
[1] Hanahan, D. and R. Weinberg. 2011. Hallmarks of Cancer: The Next Generation. Cell 144: 646-674.
[2] Hanahan, D. 2014. Rethinking the war on cancer. Lancet 383: 558-263. [3] Vineis, P and C. Wild. 2014. Global cancer patterns: causes and
prevention. Lancet 383: 549-557.
[4] Raguz, S. and E. Yagüe. 2008. Resistance to chemotherapy: new treatments and novel insights into an old problem. British Journal of Cancer 99: 387-391.
[5] Siddik, Z. 2003. Cisplatin: mode of cytotoxic action and molecular basis of resistance. Oncogene 22: 7265-7279.
[6] Rabik, C. and E. Dolan. 2007. Molecular Mechanisms of Resistance and Toxicity Associated with Platinating Agents. Cancer Treatment Reviews 33: 9-23.
[7] Stordal, B. and M. Davey. 2007. Understanding Cisplatin Resistance Using Cellular Models. Life 59: 696-699.
[8] Shen, D., L. Pouliot, M. Hall and M. Gottesman. 2012. Cisplatin Resistance: A Cellular Self-defense Mechanism Resulting from Multiple Epigenetic and Genetic Changes. Pharmacological Reviews 64: 706-721.
[9] Dasari, S. and P. Tchounwou. 2014. Cisplatin in cancer therapy: molecular mechanisms of action. European Journal of Pharmacology 740: 364-378.
[10] Galluzzi, L., I. Vitale, J. Michels, C. Brenner, G. Szabadkai, A. Harel-Bellan, M. Castedo and G. Kroemer. 2014. Systems biology of cisplatin resistance: past, present and future. Cell Death and Disease 5: e1257. [11] Lin, C., Y. Chen, C. Chen, Y. Oyang, H. Juan and H. Huang. 2012.
Crosstalk between transcription factors and micro-RNAs in human protein interaction network. BMC Systems Biology 8:18
[12] Acón, M., F. Siles-Canales and R. Mora-Rodriguez. 2016. A Biocomputational platform for the automated construction of large-scale
mathematical models of miRNA - transcription factor networks for studies on gene dosage compensation. University of Costa Rica. [13] Hoops S., S. Sahle, R. Gauges, C. Lee, J. Pahle, N. Simus, M. Singhal,
L. Xu, P. Mendes and U. Kummer. 2006. COPASI: a COmplex PAthway SImulator. Bioinformatics 22: 3067-3074.
[14] R Development Core Team (2008). R: A language and environment for statistical computing. R Foundation for Statistical Computing, Vienna, Austria. ISBN 3-900051-07-0, URL: http://www.R-project.org. [15] Langfelder, P., and Horvath, S. 2008. WGCNA: an R package for
weighted correlation network analysis. BMC bioinformatics, 9(1), 559. [16] Jiao, X., Sherman, B. T., Huang, D. W., Stephens, R., Baseler, M. W.,
Lane, H. C., and Lempicki, R. A. 2012. DAVID-WS: a stateful web service to facilitate gene/protein list analysis. Bioinformatics, 28(13), 1805–1806.
[17] Yang, Y., Han, L., Yuan, Y., Li, J., Hei, N., & Liang, H. 2014. Gene co-expression network analysis reveals common system-level properties of prognostic genes across cancer types. Nature communications, 5, 3231 [18] Chen, J., Wang, X., Hu, B., He, Y., Qian, X., & Wang, W. 2018.
Candidate genes in gastric cancer identified by constructing a weighted gene co-expression network. PeerJ, 6. DOI 10.7717/peerj.4692 [19] Jin, B., Wang, W., Du, G., Huang, G. Z., Han, L. T., Tang, Z. Y., Fang,
Z.Y., Li, J. & Zhang, S. Z. 2015. Identifying hub genes and dysregulated pathways in hepatocellular carcinoma. Eur Rev Med Pharmacol Sci, 19(4), 592-601.