CORE-CROWN QUANTUM-WELL NANOPLATELET
FUNCTIONALIZED TIO
2FOR PHOTOCATALYTIC NO
XABATEMENT
A THESIS SUBMITTED TO
THE GRADUATE SCHOOL OF ENGINEERING AND SCIENCE
OF BILKENT UNIVERSITY
IN PARTIAL FULFILMENT OF THE REQUIREMENTS
FOR THE DEGREE OF
MASTER OF SCIENCE
IN
CHEMISTRY
BY
Elnaz Ebrahimi
July 2020
i
CORE-CROWN QUANTUM-WELL NANOPLATELET FUNCTIONALIZED TiO2 FOR PHOTOCATALYTIC NOX ABATEMENT
By Elnaz Ebrahimi
July 2020
We certify that we have read this thesis and that in our opinion it is fully adequate, in scope and in quality, as a thesis for the degree of Master of Science.
Assoc. Prof. Emrah Özensoy (Advisor)
Prof. Dr. Şefık Süzer
Asst. Prof. Burak Ülgüt
Asst. Prof. Ferdi Karadaş
Prof. Dr. Deniz Üner
Approved for the Graduate School of Engineering and Science
Ezhan Karaşan
ii
ABSTRACT
CORE-CROWN QUANTUM-WELL NANOPLATELET
FUNCTIONALIZED TiO
2FOR PHOTOCATALYTIC NO
XABATEMENT
Elnaz Ebrahimi
M.Sc. in Chemistry
Advisor: Emrah Özensoy
July 2020
Oleic acid capped core/crown CdSe/CdSeTe quantum-well nanoplatelets (NPL) were used
in the surface functionalization of TiO2. Structural characterization of the synthesized
photocatalytic architecture was carried out to shed light on its surface chemistry, electronic,
and crystallographic structure. NPL/TiO2 composites were tested in NO photo-oxidation under
ultraviolet-A (UVA) and visible (VIS) light, showing a remarkable activity in NOx abatement
and high selectivity for nitrate storage as compared to standard benchmark TiO2 photocatalyst
(i.e. P25). Improved photocatalytic behavior can be attributed to the decrease in the bandgap
and enhanced photogenerated electron-hole pair separation as a result of the incorporation of
CdSe/CdSeTe NPL onto TiO2. Stability of composites was also investigated in durability tests.
Even though some decrease in photocatalytic activity and selectivity of NPL/TiO2 composites
was observed, performance of the NPL/TiO2 composites was found to be significantly better
than pure TiO2.
Keywords: Photocatalytic NOx abatement, PHONOS, DeNOx index, titanium dioxide,
iii
ÖZET
FOTOKATALİTİK NO
XARITIMI İÇİN ÇEKİRDEK-ÇEPER
YAPILI KUANTUM-KUYU NANOPLAKALARI İLE
ZENGİNLEŞTİRİLMİŞ TiO
2MALZEMELERİ
Elnaz Ebrahimi
Kimya Yüksek Lisans Tezi Danışman: Emrah Özensoy
Temmuz 2020
Oleik asit ile kaplanmış CdSe/CdSeTe kuantum kuyu nanoplakaları (KKN), TiO2
yüzeylerinin zenginleştirilmesinde kullanılmıştır. Sentezlenen malzemelerin yüzey kimyasal,
kristalografik ve elektronik yapılarının aydınlatılması için karakterizasyon çalışmaları
gerçekleştirilmiştir. KKN/TiO2 kompozitlerin, mor ötesi-A (UVA) ve görünür (VIS) ışık
altında, NO foto-oksidasyon tepkimesinde, yüksek dönüşüm ve nitrat depolama seçiciliği
gösterdiği ve referans ticari titanya katalizöründen (yani P25’den) daha başarılı olduğu
saptanmıştır. KKN/TiO2 malzemesinin üstün performansı, küçük elektronik bant aralığı ve
uzun ömürlü elektron-boşluk çiftlerinin oluşmasıyla açıklanmıştır. Uzun soluklu dayanım
testlerinde, KKN/TiO2 sistemlerinde kısmi olarak bir performans düşüşü ölçülse de; bu
sistemlerin performansı, ticari P25 referans fotokalizörünün her zaman üzerinde kalmayı başarmıştır.
Anahtar Kelimeler: Fotokatalitik NOx arıtımı, PHONOS, DeNOx indeks, titanyum
iv
Acknowledgment
I would like to express my sincere gratitude to my advisor Assoc. Prof. Emrah Özensoy for
giving me the opportunity to be a part of his research group and providing valuable guidance
throughout this research. His guidance and endless motivation have deeply inspired me.
I would also like to offer my special thanks to our collaborator Prof. Hilmi Volkan Demir and
his PhD student Farzan Shabani for providing quantum well nanoplatelets.
I am very thankful to all Chemistry department faculty members for providing friendly
environment as well as UNAM research center for offering various sources and equipment
which I made use of them to full fill my master research.
I would like to extend my gratitude to all past and present lab mates in Özensoy research group;
especially PHONOS group; Sean William McWhorter, Merve Balcı,Gökberk Katırcı and İlker
Deveci. My Special thanks goes to Dr. Muhammad Irfan, for enlightening me particularly
during the initial stages of my research. He always helped and supported me willingly during
my research and never stopped inspiring me to learn more and follow my targets. I wish him
to have a continuous success in his objectives and a happy and healthy life with his family.
Also, I thank my friends, Sinem Gürbüz and Zeynep Kap for all nice and fun times we have
had together during these two years and making the lab a nice place to work.
Last but not the least, I would like to thank my family for their continuous prayers, support,
caring and unconditional love. And finally, I would like to express my deepest thank to my
husband Sina Sadigh Akbari, for all his understanding and motivation. Without his support I
v
1 INTRODUCTION 1
1.1 AIR POLLUTION……….…...….…………..1
1.1.1 NOx Emission……….….…2
1.1.2 Formation of Secindary Air Pollutants due to NOx Compounds………3
1.1.3 NOx Sources………4
1.1.3.1 Thermal NOx ……….………..………5
1.1.3.2 Fuel NOx ………..………..…6
1.1.3.3 Prompt NOx ……….………….………….………6
1.1.4 Approaches for NOx Removal.………6
1.1.4.1 Thermal catalytic methods for NOx Removal..………..………7
1.1.4.2 Photocatalytic methods for NOx removal……..………9
1.2 TITANIUM DIOXIDE ……….…11
1.3 QUANTUM CONFINEMENT EFFECT………..………...15
1.4 QUANTUM WELL NANOPLATELETS………...….…...16
1.4.1 Core/Shell NPL ………...17
1.4.2 Core/Crown NPL……….………18
1.5 SCOPE OF THE STUDY……….……20
2 EXPERIMENTAL 23
2.1 SAMPLE PREPARATION………..23
2.1.1 Preparation of CdSe/CdSe0.75Te0.25/P25 composite Materials………..24
2.2 PHOTOCATALYTIC ACTIVITY MEASUREMENTS ………...………..…..……….26
2.2.1 Flow Reactor Setup for Photocatalytic NOx Oxidation and Storage (PHONOS) 26 2.2.2 Photocatalytic Performance Indicators ……….31
vi
2.2.2.1 %NO Conversion and Selectivity ………31
2.2.2.2 DeNOx Index ………..……….……….………32
2.2.2.3 Photonic Efficiency ………..………...33
2.2.3 Characterization Methods……….…………35
3 RESULTS AND DISCUSSION 37
3.1 CHARACTERIZATION………37
3.1.1 Structural analysis by XRD………...37
3.1.2 Electron microscopy analysis via TEM………38
3.1.3 Surface structural analysis via XPS………...39
3.1.3.1 XPS Analysis of CdSe/CdSeTe core/crown NPL………..……….….39
3.1.3.2 XPS Analysis of CdSe/CdSeTe/P25 composites………..……….…..41
3.1.4 Specific surface area (SSA) analysis with BET………45
3.1.5 Electronic structural analysis via DR-UV-A-VIS and Photoluminescence spectroscopy ………...46
3.1.6 Electron and hole trapping analysis of Cd Se/CdSeTe NPL via EPR Spectroscopy………...51
3.2 PHOTOCATALYTIC NOX(G) OXIDATION AND STORAGE (PHONOS) PERFORMANCE TESTS………...……….………52
3.2.1 Photocatalytic performance of P25 under UV-A and VIS irradiation…………..53
3.2.2 Photocatalytic performance of fresh and aged CdSe/CdSeTe/P25 catalysts under UV-A light ………..55
3.2.3 Photocatalytic performance of fresh and aged CdSe/CdSeTe/P25 catalysts under VIS light………..60
vii
3.2.4 Effect of NPL dispersion medium (toluene) on the photocatalytic performance of
P25………..63
3.2.5 Photochemical stability of NPL/P25 composites and reusability………..68
3.2.6 Effect of temperature on photocatalytic performance during VIS irradiation…...71
viii
List of Figures
Figure 1.1: Distribution of NOx emissions among different sectors in EU (2011). Adapted
from Ref. [14]……….5
Figure 1.2: NOx Removal Techniques [17]………..7
Figure 1.3: General mechanism of photocatalysis on TiO2………10
Figure 1.4: UV–visible reflectance spectra of for the phase-pure titania nanomaterials A: anatase, R: rutile and B: brookite. Adapted from Ref [44]………..13
Figure 1.5: Recombination process of photogenerated electron-hole for a) direct bandgap rutile. b) indirect bandgap anatase. Adapted from Ref [45]……….14
Figure 1.6: Electronic density od states for semiconductors as a function of dimensions. Adapted from Ref [50]……….16
Figure 1.7: Schematic representation of different configurations in NPL. Adapted from Ref. [57]………...………17
Figure 1.8: Absorption spectra of a) core/shell NPL, b) core/crown NPL. Adapted from Ref [56]………...18
Figure 1.9: Schematic representation of energy structures for core/shell- core/crown
heterojunctions. Adapted from Ref [62]………...20
Figure 1.10: A possible illustration of electron-hole transport in CdSe/CdSeTe/P25
catalyst………..21
Figure 1.11: Overall PHONOS process on NPL/P25. ... 22 Figure 2.1: Schematic representation of Oleic acid capped CdSe/CdSeTe core/crown
NPL………..26
Figure 2.2: Schematic representation of custom-made photocatalytic NOx Oxidation flow
ix
Figure 2.3: Illustration of the sample holders designed for photocatalytic performance
tests………...31
Figure 2.4: Schematic demonstration of a typical Concentration vs time profile recorded
during Photocatalytic NOx Oxidation and storage test……….35
Figure 3.1: XRD diffraction patterns of a) CdSe/CdSeTe NPL (without TiO2) and b) pure P25
and CdSe/CdSeTe/P25 composite materials with various NPL loadings……….38
Figure 3.2: (a-d) TEM images of CdSe/CdSeTe NPL……….39 Figure 3.3: XPS spectra of CdSe/CdSeTe NPL (in the absence of TiO2): a) O1s, b) C1s, c)
Cd3d, d) Te3d, and e) Se3d regions………..40
Figure 3.4: XPS spectra of fresh (green curves) and UV-A-aged (blue curves) CdSe/CdSeTe/TiO2 composite system and pure TiO2 (red curves) under PHONOS reaction: a)
Ti2p, b) C1s, c) O1s d) Te3d/Ti2s, and e) Cd3d regions. ... 42 Figure 3.5: XPS spectra of fresh (green curves) and VIS-aged (blue curves) CdSe/CdSeTe/TiO2 composite system and pure TiO2 (red curves) under PHONOS reaction: a)
Ti2p, b) C1s, c) O1s d) Te3d/Ti2s, and e) Cd3d regions………..44
Figure 3.6: Absorption spectrum of 4ML-thick core/crown CdSe/CdSeTe quantum well nanoplatelets……….46
Figure 3.7: Tauc plot and bandgap calculation for CdSe/CdSeTe NPL………..47 Figure 3.8: PL spectra of core/crown Cedes/CdSeTe quantum well NPL………...47 Figure 3.9: Diffuse reflectance UV-VIS spectra (plotted as the Kubelka-Munk function of the reflectance, R) for P25, 0.1NPL/P25 and 2NPL/P25………48
Figure 3.10: Electron energy diagram for core/crown CdSe/CdSeTe NPL on TiO2 ………..50
Figure 3.11: Room temperature X-band EPR spectra of CdSe/CdSeTe NLP (without TiO2)
x
Figure 3.12: NO(g) conversion %, and NOx storage selectivity % for fresh and aged P25 under
UV-A & VIS illumination……….54
Figure 3.13: DeNOx index values for fresh and aged P25 under UV-A & VIS illumination.55
Figure 3.14: % Photonic efficiency of P25 under UV-A & VIS illumination………..55 Figure 3.15: % NO(g) conversion and %NOx storage selectivity values for P25 and NPL/P25
under UV-A light for fresh and aged samples………...57
Figure 3.16: DeNOx Index values for P25 and NPL/P25 under UV-A light for fresh and aged
samples……….57
Figure 3.17: % Photonic efficiency values for P25 and NPL/P25 under UV-A light for fresh and aged samples………..58
Figure 3.18: % NO(g) conversion and %NOx storage selectivity values for P25 and NPL/P25
under VIS light for fresh and aged samples………..61
Figure 3.19: DeNOx index values for P25 and NPL/P25 under VIS light for fresh and aged
samples……….61
Figure 3.20: % Photonic efficiency values for P25 and NPL/P25 under VIS light for fresh and aged samples……….62
Figure 3.21: Possible route for photocatalytic degradation of toluene Ref [84]………..64 Figure 3.22: % NO(g) conversion and %NOx storage selectivity values for P25 and T/P25
under UV-A light for fresh and aged samples………...64
Figure 3.23: DeNOx index values for P25 and T/P25 under UV-A light for fresh and aged
samples……….65
Figure 3.24: % Photonic efficiency values for P25 and NPL/P25 under VIS light for fresh and aged samples……….65
Figure 3.25: % NO(g) conversion and %NOx storage selectivity values for P25 and T/P25
xi
Figure 3.26: DeNOx index values for P25 and T/P25 under VIS light for fresh and aged
samples………66
Figure 3.27: % Photonic efficiency values for P25 and T/P25 under VIS light for fresh and aged samples……….67
Figure 3.28: Long term photocatalytic results of P25 TiO2 under UV-A light irradiation…..68
Figure 3.29: Long term photocatalytic results of P25 TiO2 under VIS light irradiation……..68
Figure 3.30: Long term %NO conversion, % NOx storage selectivity and DeNOx index results
of P25 and 2.0NPL/P25 under UV-A light irradiation………..69
Figure 3.31: Long term %NO conversion, % NOx storage selectivity and DeNOx index results
of P25 and 0.1 NPL/P25 under VIS light irradiation……….70
Figure 3.32: Temperature-dependent PHONOS data for pure P25 and 0.1NPL/P25 under VIS-light illumination………..73
xii
List of Tables
Table 1.1: Properties of Nitrogen oxide Ref [5]. ... 2
Table 1.2: Some properties of anatase, rutile and brookite Ref [37]. ... 12
Table 2.1: List of used chemicals in synthesis part... 23
1
1 Introduction
1.1 Air Pollution
Relationship between humans and their environment involves a delicate balance. The
population of the world has progressively risen since the modernization and industrial
revolution, and with population growth, the ecosystem has been tremendously affected. The
air we breathe is one of the most precious resources. However, it is contaminated with natural
sources (e.g. volcanic eruptions, soil erosion and forest fires) as well as anthropogenic
emissions (agricultural activities, combustion of fossil fuels and industrial exhaust) which are
endangering human health, animal life and the environment [1]. Many regulations and studies
are taken into consideration by environmental agencies to control and reduce the harmful
pollutants in the atmosphere. United States Environmental Protection Agency (EPA) has set
ambient air quality standards for six common air pollutants including sulfur dioxide, carbon
monoxide, lead, ground level ozone, particulate matter and nitrogen dioxide [2].
Atmospheric pollutants can be classified into two categories. Pollutants such as carbon
monoxide (CO), sulfur dioxide (SO2), volatile organic compounds (VOC) and nitrogen oxides
(NOx) that are released directly from the source into the atmosphere are known as the primary
pollutants. The other category involves pollutants generated by subsequent chemical reactions
in the atmosphere and these pollutants are called secondary pollutants (e.g. tropospheric ozone
2
1.1.1 NOx Emission
Of all gas contaminants, nitrogen oxides (NOx), are among the most harmful atmospheric
pollutant gases. Although environmental protection agencies set a value of ≤ 0.2 ppm for NOx
emissions, it is often exceeded in urban settings [4]. Different types of nitrogen oxides such as
N2O, NO, NO2, N2O3, N2O4, and N2O5 can exist in the atmosphere. Various properties of
nitrogen oxide compounds are listed in Table 1.1.
Table 1.1: Nitrogen oxide and their properties. Adapted from Ref [5].
Formula Name Nitrogen
Valence
Properties
N2O nitrous oxide 1 colorless gas
water soluble NO N2O2 nitric oxide dinitrogen dioxide 2 colorless gas
slightly water soluble
N2O3 dinitrogen trioxide 3 black solid
water soluble, decomposes in water NO2
N2O4
nitrogen dioxide dinitrogen tetroxide
4 red-brown gas
very water soluble, decomposes in water
N2O5 dinitrogen pentoxide 5 white solid
very water soluble, decomposes in water
The term NOx usually refers to nitrogen monoxide (NO) and nitrogen dioxide (NO2). NOx
species are poisonous and are also highly reactive. Therefore, they can contribute to the
formation of secondary air pollutants via numerous reactions in air. Furthermore, human respiratory and immune systems are severely affected by NO and NO2 [6].
3
1.1.2 Formation of Secondary Air Pollutants due to NOx Compounds
• Ground Level Ozone: The ozone layer is a part of the atmosphere, containing relatively high concentration of O3. It is mainly found in the lower part of the stratosphere and
plays a crucial role as a natural UV irradiation shield for earth [7], [8]. However, accumulation
of ozone close to the sea level, which is called the “ground level ozone” is undesirable which
can lead to detrimental effects on lung tissue and loss of respiratory function, especially in
vulnerable populations (children, elderly people, asthmatics). Ground level ozone formation
occurs by the chemical reaction of NOx, VOCs and CO generated by man-made sources in the
presence of sunlight. Rate of ground level ozone formation is also influenced by the rate of the
initial reaction between VOCs or CO with hydroxyl radicals (•OH). Reactions (1-6) summarize
the simplified chemical pathways of ground level ozone formation [9]–[11].
VOC + •OH ⟶ RO2• + H2 (1) CO + •OH (+ O2) ⟶ HO2• + CO2 (2) RO2• + NO ⟶ VOC + H2O + NO2 (3) HO2• + NO ⟶ OH + NO2 (4) NO2 + hv ⟶ NO + O• (5) O + O2 + M⟶ O3 + M (6)
4
• Acid Rain: While rain may help to eliminate air contaminants from the atmosphere, NO2 may also be dissolved in rain to produce highly corrosive nitrous acid (HNO2) and nitric
acid (HNO3). The reactions during the formation of acid rain are given below [12].
VOC + •OH ⟶ RO2• + H2 (7)
4NO + 3O2 + 2H2O → 4HNO3 (8)
4NO2 + 2H2O + O2 → 4HNO3 (9)
3NO2 + H2O → 2HNO3 + NO (10)
• Smog: Interest in the control of NOx emissions has continuously grown since 1952, i.e.
after the role of atmospheric NOx species in the development of photochemical smog was
proposed by Haagen-Smit in Los Angeles, USA [13]. Smog is a combination of smoke (i.e.
aerial CO, particulate matter and VOCs) and fog (i.e. a visible aerosol containing aerial
microscopic water droplets or ice) that is generated when high levels of emissions are
combined with fog. As sunlight meets a mixture of NO2 and unburned hydrocarbons in the
atmosphere, photochemical smog is formed.
1.1.3 NOx Sources
NOx can be emitted to the atmosphere from mobile sources (e.g. vehicles, engines, marine
vessels, etc.) or stationary sources (e.g. power plants, chemical plants, refineries, cement plants,
foundries, manufacturing plants, etc.) Figure 1.1 shows distribution of NOx emissions among
5
Figure 1.1: Distribution of NOx emissions among different sectors in EU (2011). Adapted
from Ref [14].
Primary mechanisms of NOx formation can be categorized in three groups:
1.1.3.1 Thermal NOx
Thermal NOx is formed by the reaction of atmospheric oxygen, nitrogen, and also
hydroxyl radicals (which are abundant in a flame) at elevated temperatures through a pathway
first suggested by Zeldovich in 1947 [15][16]. The reactions are extremely temperature reliant,
therefore higher the combustion temperature, the more NOx is formed.
N2 + O ⟶ NO + N (11)
N + O2⟶ NO + O (12)
6
1.1.3.2 Fuel NOx
This form of NOx forms by the oxidation of nitrogen containing organic compound in fuels
through the reaction 14 [8].
RxNy + O2⟶ NO, NO2, CO2, H2O (14)
For high- quality gaseous fuels which are free of nitrogen containing compounds, the fuel
NOx is not a concern. However, in the case of liquid and solid fuels containing large amounts
nitrogen enormous amounts of NOx can be formed via reaction (14) [8].
1.1.3.3 Prompt NOx
Prompt NOx is the product of the fast reaction between atmospheric nitrogen and
hydrocarbon radicals in the earliest stages of combustion at lower temperatures. This kind of
NOx is less of importance compared to others and it becomes predominant under fuel-rich
conditions [8].
1.1.4 Approaches for NOx Removal
NOx control techniques can be divided into primary and secondary procedures shown in
Figure 1.2. Primary methods of NOx removal also known as pre-combustion methods, are
mostly applied in the combustion zone by adjusting the combustion parameters to reduce
NOx formation without the need for another reactor. Whereas the secondary methods (i.e.
post-combustion processes) are based on chemical reactions in order to decrease NOx species
7
NO
xRemoval
Techniques
Secondary Ways Primary Ways
Fuel staging Air staging
Thermal-Catalytic Methods Photo-Catalytic Methods Photo-Oxidation Photo-Decomposition Photo-S elective catalytic Reduction S elective catalytic Reduction NOxS torage and Reduction Three-Way Catalysis Others
Figure 1.2: NOx Removal Techniques Ref [17].
1.1.4.1 Thermal catalytic methods for NOx Removal
NOx abatement can be performed efficiently using thermal catalytic technologies at
elevated temperatures (e.g. 200 - 550 ℃) with an intend to curtail the toxic NOx emissions at the
source of generation [18]. Three of the important secondary methods that use thermal catalytic technology for NOx abatement may be described as follows:
• selective catalytic reduction/SCR • NOx storage and reduction/NSR
• three-way catalysis/TWC
Selective catalytic reduction (SCR) is one of the methods commonly used for NOx control.
Generally, SCR is performed with either ammonia (NH3) or urea (NH2-CO-NH2) as a reducing
8
4NH3 + 4NO + O2 → 4N2 + 6H2O (15)
6NO + 4NH3→ 5N2 + 6H2O (16)
6NO2 + 8NH3→ 7N2 + 12H2O (17)
2NO2 + 4NH3 + O2→ 3N2 + 6H2O (18)
The optimum temperature range for the reaction varies between 200-550 ⁰C according to
the catalyst used. The intense use of NH3 can cause undesirable species to form which may
lead to catalyst poisoning and deactivation [17].
NOx storage and reduction (NSR) also known as the Lean NOx Trap (LNT), is another
heterogeneous catalytic approach that was first developed by Toyota in 1994 [21], [22]. This
method operates in cycles where, NO is continuously oxidized into NO2 over a catalyst (i.e.
precious metal such as Pt, Pd or Rh). Subsequently the generated NO2 is captured on a basic
oxide (e.g. BaO) in the nitrate form (NO3-). A reductant is fed to the exhaust that desorbs and
reduces the stored NOx to regenerate catalyst for the next period [23]–[25]. An important
limitation of using NSR method is the sulfur poisoning which occurs by the interaction of SOx
with BaO and alumina to yield sulfates that block several storage sites for further adsorption
of nitrates. [26]. The three-way catalysts (TWC) is another method for NOx control, emitted
from gasoline engines which employs noble metals such as platinum or rhodium, supported
on a high surface area oxide, and an oxygen storage component [27]. Thermal catalytic DeNOx
technologies need to be operated at elevated temperatures at the source of generation. A major
challenge is the reduction of gaseous NOx species after their point of origin under ambient
9
1.1.4.2 Photocatalytic methods for NOx removal
Photocatalysis is another technology which uses solar energy to remove undesirable NO in
an economically sensible and environmentally friendly way. Photocatalytic NOx removal can
be categorized into three approaches: photo-decomposition, photo- SCR and photo-oxidation
[17]. Photo- decomposition and photo-SCR are based on the chemical reduction methods.
Therefore, conversion of NO into N2 and other harmless compounds is desired. On the other
hand, the main aim in photo-oxidation is to transform NOx species into surface nitrate and
nitrite species using a semiconductor material possessing a suitable band structure that can be
activated by sun light.
1.1.4.2.1 Photocatalytic NOx Oxidation and Storage (PHONOS)
Photocatalytic NOx Oxidation and storage (PHONOS) is a DeNOx technique that can store
airborne NOx in the solid state under ambient conditions after the point of NOx emission to the
atmosphere [28]–[31]. The aim of this approach is converting NOx species into surface nitrate
and nitrite using a semiconductor material, solar energy, water and atmospheric oxygen [32].
In this methodology, photocatalysts based on titanium dioxide (TiO2), has been widely utilized
to combat urban NOx pollution [33]. The mechanism for the photocatalytic oxidation of NO on
TiO2 proceeds through multiple pathways which yield nitrites and/or nitrates on the catalyst
surface [34]–[36]. NO photooxidation on TiO2 starts when a photon with sufficient energy is
absorbed by TiO2, which leads to promotion of electrons from valance to conduction band and
consequent formation of electron and hole (i.e. e- - h+) charge carriers and proceeds with the
trapping of these charge carriers to form various surface species (reactions 19-21). As
demonstrated in Figure 1.3, the generated holes oxidize water molecules to form hydroxyl
radicals and electrons in the conduction band can reduce oxygen in the air and lead the formation of superoxide anions [37]. NO on the TiO2 surface is photo-oxidized via its
10
interaction with surface hydroxyl radicals (•OHads) or holes (h+) forming HNO2 and NO2 as
by-products, finally yielding HNO3 by the attack of hydroxyl radicals or holes [38].
TiO2 + hν ⟶ TiO2 (h+ + e-) (19)
TiO2 (h+) + H2Oads⟶ TiO2 + •OH ads + H+ (20)
TiO2 (e-) + O2ads⟶ TiO2 + O2•-ads (21)
NO ads + •OH ads⟶ HNO2ads (22)
HNO2ads + •OH ads⟶ NO2ads + H2O (23)
NO2ads + •OHads⟶ HNO3 ads (20)
TiO2 (h+) + NO ads + H2Oads⟶ HNO2ads + H+ (21)
TiO2 (h+) + HNO2 ads⟶ NO2 ads + H+ (22)
TiO2 (h+) + NO2 ads + H2Oads⟶ HNO3 ads + H+ (23)
EᵒO2/ • O2– EᵒH 2O / • OH VB CB h+ e -3.2 ev 390 nm O2 • – H2O e -•OH + H+ TiO2
11
In another mechanism [39], [40], NO oxidation can occur either via superoxide anions
(reactions 28-29) or via an electron deficient surface oxygen species (reactions 30-32). It is
crucial to emphasize that adsorbed water plays an important role in the photocatalytic oxidation
of NO, as indicated in reactions 19-32.
NOads O2•-ads H+ NO2ads+ •OH HNO3ads (28) (29)
TiO2(h+) + TiO2(Os) TiO2(Os•)
NOads TiO2(Os•) NO2ads+ TiO2 (V) H2O TiO2+ 2H+ (30) (31) NO2ads TiO2(Os•) H2O TiO2+ NO3-ads+ 2H+ (32) 1.2 Titanium Dioxide
TiO2 in various forms and types has revealed great potential for photocatalytic oxidation of
harmful species both for gas and liquid phases due to its chemical and thermal stability,
nontoxicity, cost effectiveness and availability. Photocatalytic performance of TiO2 is strongly
influenced by the particle size, degree of crystallinity and morphology. It is well known that
titania has three main polymorphs in nature under normal atmospheric pressures: anatase, rutile
and brookite. Rutile is the most stable form of titanium dioxide while anatase and brookite both
are metastable phases and with calcination at high temperatures exceeding 600°C, they
transform into the thermodynamically stable rutile polymorph [41][42]. Because brookite is
difficult to be synthesized, it is rarely reported as a photocatalyst and mainly anatase and rutile
12
are also reported in the literature [43] such as TiO2 (II) with the alpha-PbO2 structure, TiO2
(B), TiO2 (H), baddeleyite phase, fluorite phase and pyrite phase.The stability of these phases
has been studied in several publications However, these are of minor importance for research
and development applications due to their limited stabilities under ambient conditions [43].
Crystal structure along with some fundamental properties for the three main titania
polymorphs are summarized in Table 1.2.
Table 1.2: Some properties of anatase, rutile and brookite. Adapted from Ref [43].
Anatase Rutile Brookite
Unit cell
Crystal structure Tetragonal Tetragonal Rhombohedral
Atoms per unit cell 4 2 8
Lattice parameters (nm) a = b = 0.3785, c = 0.9514 a = b = 0.4594, c = 0.2959 a = c = 0.5436, b = 0.9166
Crystal size (nm) <11 >35 11–35
Bandgap (eV) 3.21 3.0 3.13
UV-UV-visible reflectance spectra for anatase, rutile and brookite polymorphs with
13
Figure 1.4: UV–visible reflectance spectra of for the phase-pure titania nanomaterials A: anatase, R: rutile and B: brookite. Adapted from Ref [44].
Another parameter on which the photocatalytic efficiency of TiO2 is strongly dependent is
the electron-hole recombination. While ability of anatase to absorb solar light is lower than
rutile considering the greater band gap for anatase (3.2 eV) than rutile (3.0 eV), photocatalytic
activity of anatase is claimed to be better than rutile [41]. This is due to the higher surface
coverage of hydroxyl radicals, smaller grain size, and most importantly slower charge carrier
(electron-hole pair) recombination rate of anatase (0.2 ns) compared to rutile phase (5.0 ns)
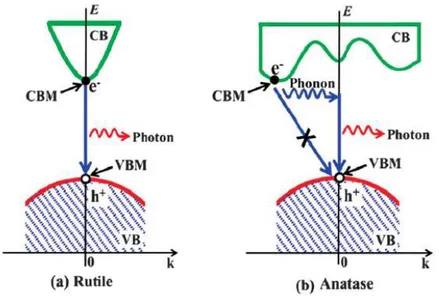
[45]. Figure 1.5.a displays direct recombination of photogenerated electrons f rom conduction
to valance band of rutile. Indirect bandgap of anatase shown in Figure 1.5.b, prohibits direct
recombination of electron-hole pairs, extending the life- time of photogenerated excitons
14
Figure 1.5: Recombination process of photogenerated electron-hole for a) direct bandgap rutile. b) indirect bandgap anatase. Adapted from Ref [41].
Despite its advantages, large bandgap of TiO2 (3.2 eV corresponding to a wavelength of ~
390 nm, allowing the harvesting of only UV-A light), high recombination rate and low
selectivity towards NOx storage necessitate the improvement of the photocatalytic efficiency
of TiO2 [18]. For this purpose, different strategies have been employed such as metal [46], non-
metal doping [47], surface modification with polymers [48] and use of QDs for TiO2
functionalization [29]. In the current study, colloidal quantum well nanoplatelets were
introduced to TiO2 in an attempt to enhance photocatalytic efficiency. Semiconductor NPL
provide novel opportunities in photocatalytic applications as their thicknesses, diameters,
shapes, electronic and optical properties can be fine-tuned with high precision via colloidal
synthesis and hetero-structure growth strategies. In addition, 2D semiconductor NPL can also
be utilized to enhance light absorption/harvesting and photon-induced charge (electron and/or
hole) transfer properties of the overall photocatalytic system. They can be more advantageous
as compared to conventional quantum dot (QD) systems due to the stronger light absorbance
cross-15
section per particle, associated with their very tight quantum confinement and the relatively
larger volume compared to QD systems[49].
1.3 Quantum Confinement Effect
The quantum confinement effect is observed when the size of the particle is sufficiently
small to be comparable to electron wavelength. It is the spatial confinement of electron-hole
pairs in one or more dimensions within a material. Due to confinement of electronic wave
function to the physical dimensions of particles, electronic energy levels become discrete and
loss continuous like feature(i.e. as in bulk form) [50], [51].A quantum confined structure can
be classified in three groups depending on the confinement orientation/configuration, i)
2D-quantum-wells (are confined in one dimension), ii) 1D-quantum-wires (are confined in two
dimensions), and iii) 0D- quantum-dots (are confined in 3 dimensions). Figure 1.6 displays
quantum confinement and subsequent density of electronic states (DOS) for 3D, 2D, 1D and
0D structures in which Y axis stands for energy and X axis represents density of states. For a
bulk semiconductor with continuous energy levels, electrons and hole are free to move in all
directions without any confinement. However, in quantum wells charge carriers are confined
to move in a plane and are free to move in two dimensions, , in quantum wires they can move
16
Figure 1.6: Electronic density od states for semiconductors as a function of dimensions. Adapted from Ref [50].
1.4 Quantum well nanoplatelets
Colloidal quantum wells (CQW), also known as nanoplatelets (NPL) constitute a class of
colloidal semiconductor materials with atomically precise thicknesses governing their
electronic structure [52]. In a quantum well, excitons are restricted to move only in two
dimensions, where they are free to move in lateral directions but feel a strong confinement in
the orthogonal thickness direction.
Quantum well NPL heterostructures with various chemical compositions and vertical
thicknesses reveal different optical properties. Also, some studies show that optoelectronic
properties of NPL can be enhanced by covering a nanocrystal with a shell or crown of another
semiconductor. Therefore, in addition to core-only structures [53], different architectures such
as core/crown (laterally grown shell) [54], core/shell (vertically grown shell) [55], and
core/crown/shell [56] structures can also be synthesized. Schematic representation of these
17
Figure 1.7: Schematic representation of different configurations in NPL. Adapted from Ref [57].
1.4.1 Core/Shell NPLs
Core/shell NPL are formed by coating the core NPL with a different type of semiconductor
from top and bottom surfaces. The growth of the shell was first reported by Talapin [58] and
Mahler [55] via growth of CdS shells on seed CdSe NPL at room temperature using the
colloidal atomic layer deposition technique. With this method, using a Xe lamp (λ = 400 nm),
80% of quantum yield (QY) was achieved. However, precise control of optical properties was
not accomplished by this technique. With the growth of a CdS shell on CdSe NPL, FWHM of
PL peak increased from 37 to 65 meV due to electron-phonon coupling with the addition of the
shell [57]. High-temperature shell-growth was also reported by Norris et al. [57] which was based on the addition of low reactivity precursors at ~ 300 ⁰C. Several heating cycles through
18
the growth of CdS shell yielded high QY along with narrow emission and improved thermal
stability of core/shell NPL making them excellent candidates for LED applications [59]. The
absorption spectrum of core/shell NPL in Figure 1.8.a shows a red shift of approximately 120
nm with the growth of shell, which is due to electronic delocalization of charge carriers through
the entire thickness of the platelets.
1.4.2 Core/Crown NPLs
The first core/crown heterostructures were obtained by Artemyev in 2013 via lateral growth
of CdS crown on seed CdSe NPL [60]. The crown can be grown in lateral direction while
maintaining thickness, so that both core and crown with the same thickness can contribute to
the absorption of illuminated photons which in turn, leads to an increase in absorption cross
section per particle. Unlike the core/shell NPL, in these heterostructures, no shift to higher
wavelength in absorption can be observed (Figure 1.8.b) due to the insignificant change in the
confinement of the carriers in the lateral d imension compared to thickness with the addition of
the crown [56], [61].
Figure 1.8: Absorption spectra of a) core/shell NPLs, b) core/crown NPL. Ad apted from Ref [56].
19
Depending on the band alignment (i.e. position of the valance and conduction bands) of
core and crown and subsequent bandgap energy, different heterostructures can be obtained with
type-I, type II or quasi type-II nature [62]. Energy diagrams for these structures are given in
Figure 1.9.
In type-I electronic structures, a crown with wider bandgap is used to cover the narrow
bandgap core. On the other hand, a narrow-bandgap crown semiconductor and a wide-bandgap
core leads the formation of inverse type-I material. In both configurations, both charge
carriers’ wave functions are confined in the same part of the structure [63]. In type-II band
structure, the bandgap energies of core and crown semiconductor are comparable and the band
edges are shifted with respect to each other so that, the valance or conduction band of core is
placed within the bandgap of the crown. Unlike type-I NPL, in type-II heterostructures,
electron and hole wave functions are localized in different parts of the structure (due to having
specific band alignment) resulting in additional separation of charge carriers yielding a long
lifetime of photoexcited electron-hole pairs. Type-II band alignment can be achieved by the
combination of materials such as CdSe/CdSeTe [64], [65]. Partial separation of electron and
hole occurs in quasi type-II band alignment and it allows delocalization of electron wave
function over the entire structure. It is worth noting that, these systems are extremely sensitive
to quantum confinement effects and changing the relative size of the core and/or the crown
causes transitions from quasi type II to type I or II regimes [65]. The choice of core and crown
semiconductor materials should be in a way to prevent the formation of defects at the interfaces
20
Figure 1.9: Schematic representation of energy structures for core/shell- core/crown heterojunctions. Adapted from Ref [62].
1.5 Scope of The Study
The main focus of this study is to design a visible responsive photocatalyst in order to
improve photocatalytic activity of TiO2 in Photocatalytic NOx Oxidation and Storage
applications (PHONOS). Commercially available benchmark Degussa P25 is used as the
titanium dioxide source. Degussa P25 is composed of 75% anatase, 15% rutile and 10% of
amorphous titania and it was reported that P25 revealed better photocatalytic activity in
numerous reactions compared to many other forms/polymorphs of pure titania [66]. However,
its wide bandgap only allows its utilization under UV light.
In this study, core/crown nanoplatelets were used in attempt to modify TiO2 to achieve
better photocatalytic activity with an increase in selectivity towards NOx storage. Oleic acid
capped CdSe/CdSeTe core/crown NPL with type II band alignment were selected since in these
NPL, photo-excited electrons are expected to be localized in the CdSe core, while holes may
21
lifetimes [64], [67], [68]. Also, NPL with large absorption cross-section are capable of
harvesting a greater portion of sunlight. Furthermore, presence of NPL create additional sites
for NO2 adsorption which consequently improves selectivity towards NOx storage. The main
aim of incorporation of NPL can be summarized in Figure 1.10. As demonstrated in Figure
1.10, conduction band of TiO2 lies below the conduction band of CdSe core, therefore overall
photo-generated electrons will be trapped in TiO2 's conduction band, while generated holes
will be confined in CdSeTe crown since CdSeTe has a higher valance band. This efficient
separation of electrons and holes would decrease the recombination rate leading to improved
PHONOS performance.
Figure 1.10: A possible illustration of electron-hole transport in CdSe/CdSeTe/P25 catalyst.
Figure 1.11 illustrates overall PHONOS process on the NPL/P25 catalyst. Atmospheric
NOx oxidation occurs in the presence oxygen, water and an excitation source and the gaseous
22
Figure 1.11: Overall PHONOS process on NPL/P25.
The toxicity and cost of the photocatalyst material are important factors and the
incorporation of CdSe/CdSeTe NPL are neither cost efficient nor environmentally friendly.
Nonetheless, is shown for the first time that photocatalytic NO oxidation performance of titania
surfaces can be significantly boosted via 2D quantum-wells (i.e. CdSe/CdSeTe
nanoplatelets/NPL). Thus, the current study pave the way for future studies where the
photocatalytic performance of titania (as well as other semiconductors) not only in NO
oxidation but presumably in many other photo-oxidation reactions can be fine-tuned and
enhanced by designing a non-toxic new quantum-well architectures with controlled electronic structures.
23
2 Experimental
2.1 Sample preparation
Preparation of CdSe/CdSeTe/P25 composites were achieved by using the synthesized
CdSe/CdSeTe quantum well nanoplatelets (see Appendix) and incorporating them onto P25.
List of the used chemicals for the synthesis is given Table 2.1. Utilized chemicals were
purchased from Sigma Aldrich and used as received without further purification.
Table 2.1 List of used chemicals in synthesis part Chemical name
Cadmium nitrate tetrahydrate Cd(NO3)2.4H2O; 99% trace metal basis
Cadmium acetate dihydrate Cd(OAc)2.2H2O; 98%
Sodium myristate CH3(CH2)12COONa, ≥99%
Titanium (IV) oxide P25, ≥99.5% trace metal basis
1-Octadecene ODE, technical grade
Selenium (Se), 99.99% trace metals basis
Tellurium (Te), 99.99% trace metals basis
Oleic acid OA, 90% technical grade
24
2.1.1 Preparation of CdSe/CdSe0.75Te0.25/P25 composite Materials
Commercially available Degussa P25 is used as titanium dioxide source as a
photocatalyst. To synthesize CdSe/CdSe0.75Te0.25/P25 composite systems, different volumes of
CdSe/CdSe0.75Te0.25 NPL colloidal suspensions in toluene were drop-cast on 250 mg of P25
(i.e. TiO2) in a petri dish. After physical mixing of the NPLs with P25 for 2 min, samples were
dried in an oven at 70 ᵒC for 18 h. The samples were labeled as XNPL/P25 (X=0.1, 0.5, 1.0,
2.0, and 6.0). Furthermore, additional samples were also prepared , in order to elucidate the
effect of toluene (i.e. NPL dispersing medium) on the photocatalytic performance of P25. For
this purpose, various amounts of toluene were drop-cast on P25 at RT followed by evaporation
and drying at 70 ᵒC for 18 h. These samples are designated as XT/P25, where X represents the
volume of toluene dosed on P25 in mL (i.e. X = 0.1, 0.5, or 2.0 mL). Names of these samples
25
Table 2.2: List of prepared samples
Sample name TiO2 (Degussa P25)
amount (mg) CdSe/CdSeTe NPL amount (ml) Toluene amount (ml) 0.05 NPL/P25 250 0.05 - 0.1 NPL/P25 250 0.1 - 0.5 NPL/P25 250 0. 5 - 1.0 NPL/P25 250 1 - 2.0 NPL/P25 250 2 - 6.0 NPL/P25 250 6 - 0.1 T/P25 250 - 0.1 0.5 T/P25 250 - 0.5 2.0 T/P25 250 - 2
26
2.2 Photocatalytic Activity Measurements
2.2.1 Flow Reactor Setup for Photocatalytic NOx Oxidation and Storage (PHONOS)
Humidifier Pressure Transducer UVA/VIS light By-pass line Sample Holder NOx analyzer Exhaust N2(g) O2(g) NO/N2(g) M FC M FC M FC
Figure 2.1: Schematic representation of custom-made photocatalytic NOx Oxidation flow
rector system Ref [18].
The photocatalytic NOx oxidation and storage measurements were conducted at room
temperature using a custom-designed flow reactor demonstrated in Figure 2.1. The flow reactor
consists of three gas lines that are made of 1⁄4-inch Swagelok stainless steel tubing and Swagelok nupro VCR valves which are connected to gas tanks including N2 -99.99%, O2
-99.00%, NO - 100 ppm balanced with N2. The volumetric flow rates were set to be 0.750 SLM
(standard liters per minute) for N2(g), 0.250 SLM for O2(g), and 0.010 SLM for NO(g). Mass
flow controllers (MFCs) were utilized to control the gas flow rates with high accuracy and each
MFC (MKS1479 A for N2(g) and O2(g), and Teledyne HFC-202 for NO(g) diluted in N2(g))
27
photocatalyst was kept at 1.01 SLM ± 0.05 SLM, where the NO(g) content of the inlet gas
mixture was fixed at 1.00 ppm.The pressure inside the reactor was maintained at ca. 1 bar and measured with an MKS Baratron 622B capacitance manometer. Humidity level of the gas mixture was also controlled by dosing varying amounts of water vapor into the inlet gas mixture ( i.e. before the reactor entrance) with the help of a PermSelect (PDMSXA-2500) semipermeable membrane module attached to an external variable-temperature water chiller/recycler. The mixture of artificially polluted air was fed to the photocatalytic reaction chamber and passed over the
photocatalyst. The changes in NOx, NO and NO2 outlet concentrations were monitored using a
chemiluminescent NOx analyzer, Horiba APNA-370 with a 0.1 ppb sensitivity and 1 Hz
detection speed according to HORIBA APNA manual. APNA-370 is an ambient nitrogen oxide
monitor using the chemiluminescence method as its operating principle. This monitor provides
to continuously measure the concentrations of nitrogen oxides (NO, NO2, and NOx (NO +
NO2)) in the atmosphere. The working principle of chemiluminescence analyzer is based on
the reaction of NO with ozone [69]. When O3 is introduced to the sample gas mixture
containing NO using an ozonizer unit, a portion of NO in the sample gas is oxidized to NO2
and forms the excited state NO2* according to reaction 33. Generated NO2* emits light with a
range of wavelength between 600-3000 nm centered about 1200 nm and relaxes into its ground
state. This phenomenon of light emission is called chemiluminescence as shown in reaction 34.
NO + O3 → NO2* + O2 (33)
NO2* → NO2 + hv (24)
Reaction 33 is extremely fast (a few nanoseconds). It involves only NO and is mostly
unaffected by the coexistence of other gases. When the NO concentration is low (i.e. 0-10
28
analyte gas is divided into two separate detection chambers. The first detection chamber is used
for the direct measurement of the NO concentration in the NOx analyte mixture (i.e. [NO]) as
shown in reactions 33 and 34. The second detection chamber is for the measurement of the
NO2 concentration (i.e. [NO2]). In the second detection chamber, NO2 in the NOx analyte
mixture is reduced to NO via a tungsten-based heterogeneous catalyst and then this particular
analyte sample containing additional NO obtained from NO2 reduction is sent back to the first
chamber for the analysis of the total [NO] coming from the 2nd chamber. Then by subtracting
the [NO] concentrations obtained from the second chamber from the first chamber yields
[NO2]. Furthermore, total NOx concentration in the exhaust line can also calculated using [NO]
and [NO2], where [NOx(total)] ≡ [NO]+[NO2)]. Note that in the presence of O2 (g) and H2O(g)
(i.e. under oxidizing reaction conditions) no additional NOx products other than NO and NO2
are expected to be present in the analyte gas sample. In other words, NO reduction products
such as N2 or N2O are not expected to exist in the analyte mixture.
In the NOx analyzer, sample gases are switched to the NOx, NO, and reference gas lines
every 0.5 s with solenoid valves and are introduced to the reaction chambers in a subsequent
manner. On the other hand, the ambient air is separately sucked through the air filter, dried by
a self- reproducing-type silica gel dryer, and used to form ozone in the ozonizer unit.
In the photocatalytic PHONOS measurements carried out in the current work, two different light sources were used. For the experiments performed with UV-A irradiation, an 8 W UV-A lamp (F8W/T5/BL350, Sylvania, Germany) was used, while for the experiments carried out
with VIS light illumination, a 35 W metal halide lamp (HCI-TC 35 W/942 NDL PB 400−700
nm range, Osram) along with a commercial VIS transparent UV-A-blocker/filtering film
(LLumar window film UV-A CL SR PS (clear)) was utilized in order to remove any
29
was measured before and after each UV-A and VIS-light measurements with a photoradiometer
(HD2302.0, Delta Ohm/Italy) using a UV-A probe (315−400 nm) and a PAR VIS probe
(400−700 nm), respectively. Typical VIS-light photon flux values used in the current
experiments were within 450−500 μmol/(m2 s), while typical UV-A-light power density values
were within 7.7−8.3 W/m2. It is important to note that the photon flux of the VIS light source
was about 15 times greater than that of the UV-A light source. Relative percentile of VIS
photon flux in typical solar radiation is 42% which is significantly greater than that of UV-A
photon flux that contributes only 6% of incoming solar irradiation photon flux (The rest of
solar irradiation is UV-B, UV-C and IR). Relative humidity and temperature of the reactor were measured using a Hanna HI 9565 humidity analyzer at the sample position in the photocatalytic flow reactor and these two parameters were kept within 50±3% at 23±2 ᵒC during the photocatalytic tests, respectively. However, during VIS light experiments, reactor temperature reached up to 46 °C after a typical 60 min photocatalytic activity test due to the infrared photon emission
form the VIS light source. Therefore, the effect of the increasing temperature was also studied
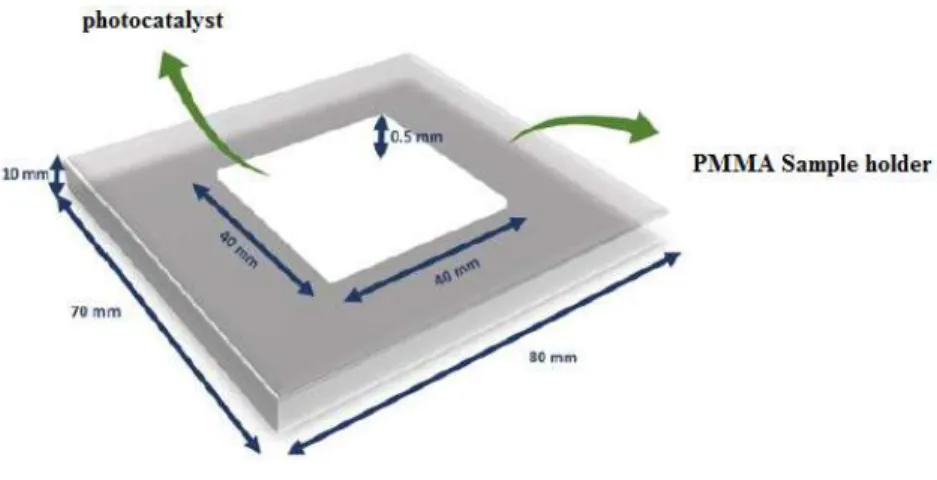
additionally. For each photocatalytic activity measurement, 250 mg of photocatalyst was
packed in a 2 mm × 40 mm × 40 mm polymethyl methacrylate (PMMA) sample holder shown
in Figure 2.2 and placed into the flow reactor. Aged samples were exposed to UV-A or VIS irradiation source for 18 h at room temperature before the PHONOS performance test.
30
Figure 2.2: Illustration of the sample holders designed for photocatalytic performance tests.
A typical NOx concentration profile during the PHONOS tests as a function of UV/VIS
irradiation time is illustrated in Figure 2.3. The experiment started by feeding a synthetic
polluted air gas mixture containing ca. 1 ppm NO(g) to the photocatalyst surface under dark
conditions. During this initial step, also known as dark adsorption period, a slight decrease in
the total NO and consequently NOx concentration was observed due to adsorption of NOx
species on the reactor lines, expansion of the gas in the reactor as well as non-photocatalytic
adsorption of NOx on the photocatalyst surface. In addition, a tiny amount of NO2(g) was
produced due to thermal catalytic processes occurring on the catalyst surface. Following the
saturation of the reactor system and photocatalyst surface after this induction period, NOx(g)
and NO(g) levels quickly returned to their original inlet values under dark conditions. In the
next step, UV-A or VIS irradiation source was turned on which resulted in a drastic and
long-term fall in NO(g) and total NOx concentrations along with a small increase in the NO2(g) level.
Finally, after 1 h, when the experiment was completed, the light source was turned off and the
31 0 20 40 60 80 100 0.0 0.2 0.4 0.6 0.8 1.0 Light OFF Con ce nt ratio n (p pm) Time(min) NOx NO NO2 Light ON
Figure 2.3: Schematic demonstration of a typical Concentration vs time profile recorded during Photocatalytic NOx Oxidation and storage test.
2.2.2 Photocatalytic Performance Indicators
Different photocatalytic performance indicators (i.e. figures of merit) were defined to
evaluate and quantify the relative photocatalytic activity of the samples by integrating the
concentration versus time profiles, an example of which is given in Figure 2.4. %NO
conversion, %selectivity, DeNOx index and % photonic efficiencies are the variables that are
used in this study to report photocatalytic NOx Oxidation and Storage performance.
2.2.2.1 %NO Conversion and Selectivity
NO conversion represents total amount of NO gas that is photo oxidized into two main
products: 1) NO can be photo oxidized to NO2 which releases into atmosphere in the form of
gaseous, or 2) it can be deposited in solid state in the form of nitrate / nitrite on the catalyst
surface. It is an indication of the total oxidation activity of the photocatalyst. Consequently,
32
conversion values. NO conversion can be calculated using Equation 35 and are shown in purple
bars in the histograms presented in the forthcoming figures.
% 𝐍𝐎 𝐂𝐨𝐧𝐯𝐞𝐫𝐬𝐢𝐨𝐧 = ∫([𝑁𝑂 ]𝑖𝑛−[𝑁𝑂]𝑜𝑢𝑡)𝑑𝑡
∫[𝑁𝑂]𝑖𝑛𝑑𝑡 𝑥 100 (35)
The second parameter is called % Selectivity and is shown in Equation 36. % Selectivity is
represented with green bars in the histograms given in the forthcoming figures. This term
corresponds to the percentage of NO oxidation products that are stored on the catalyst surface
in the solid state. Therefore, a high %Selectivity is a desirable catalytic property.
% 𝐒𝐞𝐥𝐞𝐜𝐭𝐢𝐯𝐢𝐭𝐲 (𝑡𝑜𝑤𝑎𝑟𝑑𝑠 𝑁𝑂𝑥 𝑆𝑡𝑜𝑟𝑎𝑔𝑒) =
∫([𝑁𝑂𝑥]𝑖𝑛− [𝑁𝑂𝑥]𝑜𝑢𝑡)𝑑𝑡
∫([𝑁𝑂]𝑖𝑛− [𝑁𝑂]𝑜𝑢𝑡)𝑑𝑡
𝑥 100 (36)
In these calculations, it is assumed that NO (g) conversion is only due to the generation of
gaseous NO2 and/or formation of solid-state NOx species. This is a reasonable assumption since
NO2 (g), HONO (ads), HONO2 (ads) and NO3- (ads)/NO2- (ads) are the major products of the
photocatalytic NO + O2 reaction under the currently utilized reaction conditions [38].
2.2.2.2 DeNOx Index
DeNOx index is another performance parameter used in the current work to compare
ultimate photocatalytic performance of the samples. According to Occupational Safety and
Health Administration (OSHA), American Conference of Governmental Industrial Hygienists
(ACGIH) and National Institute for Occupational Safety and Health (NIOSH); short term
exposure limit value of NO is 25 ppm, whereas the corresponding limit value of NO2 varies
from 1 to 3 ppm. Therefore, based on above mentioned facts and the assumption that NO2
33
index parameter to assess the overall ultimate photocatalytic efficiency of the photocatalytic
materials. In other words, DeNOx index is a figure of merit that accounts for the net NOx
abatement effect of the photocatalyst by taking both NO conversion and NO2 formation into
consideration. If DeNOx index has a positive value, it means that photocatalyst is reducing
toxicity of the air by lowering the overall NOx and is worth using that material for
photocatalytic NOx oxidation-storage; otherwise it should not be used. The parameter defined
in Equation (37) is a modified version of one proposed by Bloh and co-workers.
𝐃𝐞𝑵𝑶𝒙 𝐢𝐧𝐝𝐞𝐱 =
∫([𝑁𝑂]𝑖𝑛− [𝑁𝑂]𝑜𝑢𝑡)𝑑𝑡 − 3 ∫([𝑁𝑂2]𝑜𝑢𝑡− [𝑁𝑂2]𝑖𝑛)𝑑𝑡
∫[𝑁𝑂]𝑖𝑛𝑑𝑡
(37)
2.2.2.3 Photonic Efficiency
It is important to note that, for a specific photocatalyst, % NO Conversion and % Selectivity
values mentioned above vary with the incoming photon flux. Therefore, photocatalytic activity
data can also be reported after normalization with the incident photon flux and calculation of
the % Photonic Efficiency (i.e. % quantum yield) values as given in Equations 38 and 39 [70].
𝐍𝐎𝐱 𝐒𝐭𝐨𝐫𝐚𝐠𝐞 % 𝐏𝐡𝐨𝐭𝐨𝐧𝐢𝐜 𝐄𝐟𝐟𝐢𝐜𝐢𝐞𝐧𝐜𝐲 (𝛏) = 𝑛(𝑁𝑂𝑥 𝑠𝑡𝑜𝑟𝑒𝑑 𝑜𝑛 𝑡ℎ𝑒 𝑐𝑎𝑡𝑎𝑙𝑦𝑠𝑡 𝑠𝑢𝑟𝑓𝑎𝑐𝑒 ) 𝑛(𝑝ℎ𝑜𝑡𝑜𝑛 ) 𝑥 100 (38) 𝐍𝐎𝟐 𝐑𝐞𝐥𝐞𝐚𝐬𝐞 % 𝐏𝐡𝐨𝐭𝐨𝐧𝐢𝐜 𝐄𝐟𝐟𝐢𝐜𝐢𝐞𝐧𝐜𝐲 (𝛏) = 𝑛(𝑁𝑂2 𝑟𝑒𝑙𝑒𝑎𝑠𝑒𝑑 𝑡𝑜 𝑡ℎ𝑒 𝑎𝑡𝑚𝑜𝑠𝑝ℎ𝑒𝑟𝑒 ) 𝑛(𝑝ℎ𝑜𝑡𝑜𝑛 ) 𝑥 100 (39)
where n(photon) is defined as:
𝑛(𝑝ℎ𝑜𝑡𝑜𝑛) = (𝐼 𝑥 𝜆 𝑥 𝐴 𝑥 𝑡) (𝑁𝐴 𝑥 ℎ 𝑥 𝑐)
34
In Equation 40, “I” represents the photon power density of the lamp; represents the mean emission wavelength of the lamp; “A” is the surface area of the photocatalyst exposed to light
irradiation; “t” represents the duration of the performance test; “NA” is the Avogadro’s
number; “h” is the Plank constant and “c” is the speed of light.
NOx storage photonic efficiency and NO2 release photonic efficiency % values described
in Equations 38 and 39 denote the percentile of NOx species stored in solid state and NO2(g)
molecules released to gas phase, respectively, per number of photons impinging on the catalyst
surface during a 60 min-long photocatalytic activity test. Since the ultimate goal of the current
work is to determine/compare/quantify the actual amounts of NOx abatement under irradiation
conditions similar to that of solar rad iation, we will mostly focus on the % NO conversion and
% Selectivity towards NOx storage values in our discussion, however photonic efficiency
values will also be discussed additionally where needed .
Figure 2.4 represents a hypothetical ideal photocatalyst which is both active and selective
revealing high NOx storage photonic efficiency, low NO2 release photonic efficiency and a
positive DeNOx index value rendering itself a very favorable photocatalyst for the PHONOS
35 0.00 0.20 0.40 0.60 0.80 1.00 0.87 0.240 NOx Storage Photonic Efficiency % NO2 (g) Production Photonic Efficiency % 0 20 40 60 80 100 44 90 NO Conversion % NOx Storage Selectivity %
-0.30 -0.15 0.00 0.15 0.30 0.29 DeNOx Index
Figure 2.4: Photocatalytic performance parameters for a hypothetical ideal PHONOS photocatalyst.
2.2.3 Characterization Methods
Crystallographic structures of the synthesized materials were determined by using a
PANalytical Empyrean XRD diffractometer equipped with Cu Kα irradiation source. (40 kv, 45 mA, λ=1.5405 Å). The powder samples were pressed into a silicon single crystal and placed
in diffractometer to be scanned within 10-80⁰ 2θ range with a scan rate of 0.04⁰ S-1.
Transmission electron microscopy (TEM), scanning transmission electron microscopy
(STEM), high angle annular dark field (HAADF) imaging and energy dispersive X-Ray (EDX)
analysis experiments were carried out at 120 kV using a Hitachi HighTech HT7700 TEM
equipped with BF-/DF-STEM-EDX modules at DAYTAM User Facility (Ataturk University,
Erzurum, Turkey). X-ray photoelectron spectroscopy (XPS) experiments were performed with
a SPECS PHOIBOS hemispherical energy analyzer. A monochromatic Al-Kα X-ray excitation
source (15 kV, 400 W) was employed during the XPS data acquisition. BET specific surface
36
adsorption–desorption isotherms obtained with a Micromeritics 3Flex surface area and pore
size analyzer. Prior to SSA analysis, all samples were outgassed in vacuum for 2 h at 150 ℃.
Optical absorption properties of the samples were investigated via Diffuse Reflectance
UV-A-VIS (DR-UV-A-UV-A-VIS) Spectroscopy using a Cary 5000 UV-A-UV-A-VIS-NIR Spectrometer equipped
with a Varian Cary 2500 Internal Diffuse Reflectance (DR) Accessory. The photoluminescence
(PL) spectra were obtained at room temperature using a Jobin-Yvon Horiba Fluorolog-3
spectrometer equipped with a 450 W ozone-free Osram XBO xenon arc lamp and a Hamamatsu
R928 P detector. The excitation wavelength was 400 nm (i.e. 3.1 eV), which is well above the
band gap of NPL. The fluorescence was monitored at a right angle relative to the excitation.
Electron paramagnetic resonance (EPR) measurements were performed with a Bruker EMX
Nano spectrometer with an integrated referencing for g-factor calculation using integrated spin
counting units. The microwave frequency of the cavity was 9.41 GHz (X-band) and all spectra
were measured at room temperature (RT) with 0.1 mT modulation amplitude, 2 mW
microwave power and 120 scans (sweep time 60 s/scan, time constant 81.92 ms). Before the
measurements, EPR samples were inserted into a spin-free 25 cm long quartz tubes (Qsil®,
Germany). In-situ EPR experiments were also carried out in the presence of UV-light
irradiation using an ER 203 UV radiation system containing a short-arc mercury lamp (LSB
37
3 Results and Discussion
3.1 Characterization
3.1.1 Structural analysis by XRD
To analyze Crystal structures of core/crown CdSe/CdSeTe NPL, P25 (TiO2), as well as
CdSe/CdSeTe/P25 composites having different loadings of NPL, XRD measurements were
carried out. X-ray diffraction patterns of CdSe/CdSeTe quantum well nanoplatelets are shown
in Figure 3.1.a. XRD peaks at 2θ values of 12.83ᵒ, 19.71ᵒ, 38.03ᵒ and 49.81ᵒ are assigned to
(111), (200), (220) and (311) facets of the CdSe core of NPL with a zinc blend structure . It is
observed that, addition of a CdSeTe crown to the CdSe core does not lead to major changes in
the XRD pattern of the CdSe core and initial crystal structure of CdSe core is preserved [65].
XRD profile of P25 in Figure 3.1.b demonstrates characteristic diffraction signals of TiO2,
indicating the existence of anatase (ICDD card no. 021-1272) and rutile (ICDD card no.
00-021-1276) domains. On the other hand, it can be interpreted from XRD patterns of P25 that,
anatase is the dominant phase in P25. In terms of CdSe/CdSeTe/P25 samples, it is observed
that incorporation of different loadings of quantum well nanoplatelets to P25 does not lead to
any change in XRD pattern of CdSe/CdSeTe/P25 composites due to the very small loadings of
NPL used in the functionalization of P25 and the small NPL particle sizes. Currently used
minute loadings of CdSe/CdSeTe NPL were chosen to minimize the cost and toxicity of the
38 20 30 40 50 60 70 R R R AA A AA A A A A 6 NPLs/P25 o.5 NPLs/ P25 2 NPLs/P25 1 NPLs/P25 0.1 NPLs/ P25 XR D I n te n s ity (a .u .) P25 0.05 NPLs/ P25 A R (b) 2q(degree) CdSe/CdSeTe NPLs (111) (200) (220) (311) (a) A:Anatase R:Rutile
Figure 3.1: XRD diffraction patterns of a) CdSe/CdSeTe NPL (without TiO2) and b) pure
P25 and CdSe/CdSeTe/P25 composite materials with various NPL loadings.
3.1.2 Electron microscopy analysis via TEM
Figure 3.2 demonstrates several TEM images of CdSe/CdSeTe core/crown NPL in the
absence of P25. Highly monodisperse and uniform 4 ML-thick NPL with a rectangular shape
are visible in the TEM images. These rectangular NPL have sharp and well-defined rims
exhibiting lateral dimensions of 90 nm × 30 nm. The stacks of NPL in these images affirm the
excellent uniformity of these quasi-2D nanostructures both in terms of lateral dimensions as
39
a)
500 nmb)
200 nm100 nm 50 nm
c)
d)
Figure 3.2: (a-d) TEM images of CdSe/CdSeTe NPL.
3.1.3 Surface structural analysis via XPS
3.1.3.1 XPS Analysis of CdSe/CdSeTe core/crown NPL
In order to inspect the surface chemistry and elemental composition of the core/crown NPL,
XPS analysis was performed. Figure 3.3 displays XPS analysis results for CdSe/CdSeTe NPL
in the absence of P25 where binding energy (B.E) positions of the spectrums were calibrated
using the surface carbon signal at 284.8 eV. As mentioned in previous sections, CdSe/CdSeTe
NPL are capped with oleic acid, therefore additional oxygen and carbon signals are also
detected in XPS spectra. In the O1s spectrum (Figure 3.3.a), a broad and a convoluted signal
is observed which can be associated with the C-O, C=O and O-H functionalities of the oleic
acid capping of the NPL [71]. Figure 3.3.b presents the corresponding C1s spectrum of the
![Table 1.2: Some properties of anatase, rutile and brookite. Adapted from Ref [43].](https://thumb-eu.123doks.com/thumbv2/9libnet/5652561.112668/25.893.117.797.415.796/table-properties-anatase-rutile-brookite-adapted-ref.webp)


![Figure 1.7: Schematic representation of different configurations in NPL. Adapted from Ref [57]](https://thumb-eu.123doks.com/thumbv2/9libnet/5652561.112668/30.893.270.628.110.569/figure-schematic-representation-different-configurations-npl-adapted-ref.webp)
![Figure 1.8: Absorption spectra of a) core/shell NPLs, b) core/crown NPL. Ad apted from Ref [56]](https://thumb-eu.123doks.com/thumbv2/9libnet/5652561.112668/31.893.124.809.737.997/figure-absorption-spectra-core-shell-npls-crown-apted.webp)

![Figure 2.1: Schematic representation of custom-made photocatalytic NO x Oxidation flow rector system Ref [18]](https://thumb-eu.123doks.com/thumbv2/9libnet/5652561.112668/39.893.137.721.294.568/figure-schematic-representation-custom-photocatalytic-oxidation-flow-rector.webp)
![Figure 3.6: Absorption spectrum of 4ML-thick core/crown CdSe/CdSeTe quantum well nanoplatelets Ref [77]](https://thumb-eu.123doks.com/thumbv2/9libnet/5652561.112668/59.893.258.643.111.453/figure-absorption-spectrum-thick-crown-cdsete-quantum-nanoplatelets.webp)
