Full Terms & Conditions of access and use can be found at
https://www.tandfonline.com/action/journalInformation?journalCode=rrpt20
Research and Policy on Turkey
ISSN: 2376-0818 (Print) 2376-0826 (Online) Journal homepage: https://www.tandfonline.com/loi/rrpt20
An Assessment of the Turkish Economy in the AKP
Era
A. Erinç Yeldan & Burcu Ünüvar
To cite this article: A. Erinç Yeldan & Burcu Ünüvar (2016) An Assessment of the Turkish Economy in the AKP Era, Research and Policy on Turkey, 1:1, 11-28, DOI: 10.1080/23760818.2015.1099779
To link to this article: https://doi.org/10.1080/23760818.2015.1099779
Published online: 03 Feb 2016.
Submit your article to this journal
Article views: 1256
View Crossmark data
An Assessment of the Turkish Economy in the AKP Era
A. Erinç Yeldan*and Burcu ÜnüvarDepartment of Economics, Bilkent University, Ankara
This paper studies the performance of the Turkish economy under the reign of the Justice and Development Party (Adalet ve Kalkınma Partisi, AKP). Most of this period coincides with abundant global capital especially in the aftermath of the Great Recession. We argue that AKP’s economy policies were shaped with the goal of attracting foreign capital to the country, creating a debt ridden speculative growth model and turning a blind eye to the mandate of solving the country’s fundamental problems. Within this model, monetary policy has been the leading actor. Although the Central Bank has been operating with a price stability mandate during this per-iod, inflation targeting performance has been poor, creating doubts about the leading motive behind the reaction function. Fiscal policy became a dependent variable, shadowed by the capital chasing monetary policy. As global liquidity started to become more risk averse in the post-tapering era and as accumulated domestic problems of the country became thicker, Turkey’s growth model proved to be unsustainable, intensifying external fragility for the period ahead.
Keywords: Turkey under the AKP; great recession; speculative growth; external fragility
Introduction
The 2000s meant an era of profound shifts in the social and economic spheres of the Republic of Turkey. Following the crises of November 2000 and February 2001, the political arena had witnessed the rise to power of the Justice and Development Party (Adalet ve Kalkınma Partisi, AKP) – an implicit coalition of diverse Islamic movements. Shortly after the AKP took office it was observed to abandon its populist discourse as an anti-IMF and anti-liberal reactionary movement and turned to fully adopting the neo-liberal policies that aimed at entrusting the national resources and eco-nomic future of the country directly to speculative foreign capital and non-fettered dynamics of the market forces (Cizre and Yeldan 2005; Independent Social Scientists Alliance (ISSA)2005).
The distinguishing feature of the series of AKP governments over the post 2003 per-iod was that they had deliberately adopted the mission of executing the neo-liberal pro-ject under the discourse of ‘strong government’ without confronting any strong popular opposition. Over this period, Turkey continued to specialise in standard technologies and low labour cost production in line with an export-based growth strategy, within the international division of labour. On the macro-economic policy side, a significant shift towards ‘speculative-led growth’ have been realized, where ‘macroeconomics’ has become almost synonymous with ‘monetary policy’ (at the expense of fiscal policy). Furthermore, monetary policy has often taken the exclusive form of inflation targeting, *Corresponding author. Email:[email protected]
© 2015 Taylor & Francis
whereby the ‘independent’ Central Bank of the Republic of Turkey (CBRT) has the objective of attaining price stability at a low rate of inflation by using the policy interest rate as the major instrument. All these changes can be placed within the concept of fi-nancialization, i.e. an overall ascendance of finance over the real economy, industry in particular.
In this paper we aim at portraying the characteristics of the macroeconomic perfor-mance of the Turkish economy under the AKP era. The paper is organized infive sec-tions. We start with an overview of the macroeconomic history of Turkey under the relevant period. Then we dwell on the implications of this macroeconomic structure on the labour markets and follow this by the patterns of debt-ridden growth shown in sec-tion three. Secsec-tion four gives an assessment of the monetary policy as an actor of the debt-ridden growth model and shows its dominance over the fiscal policy. Section five concludes.
The post-2001 crisis adjustments and the IMF programme
Turkey experienced a severe economic and political crisis in November 2000 and again in February 2001. The crisis erupted when Turkey was following an exchange-rate based disinflation programme led and engineered by the IMF.1
Over 2001 the GDP con-tracted by 7.4 per cent in real terms, the wholesale price inflation soared to 61.6 per cent, and the currency lost 51 per cent of its value against the major foreign monies. The burden of adjustment fell disproportionately on the labouring classes as the rate of unemployment rose steadily by 2 percentage points in 2001 and then another 3 percent-age points in 2002. Real wpercent-ages fell abruptly by 20 per cent upon impact in 2001 and has not recovered at of the time of writing these lines.
The IMF has been involved with the macro management of the Turkish economy both prior to and after the crisis, and provided financial assistance of $20.4 billion, net, between 1999 and 2003. Following the crisis, Turkey has implemented an orthodox strategy of raising interest rates and maintaining an overvalued exchange rate. The gov-ernment was forced to follow a contractionary fiscal policy, and promised to satisfy the customary IMF demands: reduce subsidies to agriculture, privatize, and reduce the role of public sector in economic activity.
The IMF programme in Turkey relied mainly on two pillars: (1) fiscal austerity that targeted a 6.5 per cent surplus for the public sector in its primary budget2as a ratio to the gross domestic product; and (2) a contractionary monetary policy (through an inde-pendent central bank) that exclusively aimed at price stability (via inflation targeting). Thus, in a nutshell, the Turkish government was charged to maintain dual targets: a pri-mary surplus target in fiscal balances (at 6.5 per cent to the GDP); and an inflation-tar-geting central bank3 whose sole mandate is to maintain price stability and is divorced from all other concerns of macroeconomic aggregates.
According to the logic of the programme, successful achievement of the fiscal and monetary targets would enhance‘credibility’ of the Turkish government ensuring reduc-tion in the country risk percepreduc-tion. This would enable reducreduc-tions in the rate of interest that would then stimulate private consumption andfixed investments, paving the way to sustained growth. Thus, it is alleged that what is being implemented is actually an ex-pansionary programme offiscal contraction.
The post-2001 growth had indeed been high. The annual rate of growth of real GDP averaged 7.8 per cent over 2002–2006. Growth, while rapid, had very unique character-istics. Firstly, it was mainly driven by a massive inflow of foreign finance capital, which
in turn was lured by significantly high rates of return offered domestically; hence, it was speculative-led in nature (a la Grabel 1995). The main mechanism has been that the high rates of interest prevailing in the Turkish asset markets attracted short-term finance capital, and in return, the relative abundance of foreign exchange led to overval-uation of the Lira. Cheapened foreign exchange costs led to an import boom both in consumption and investment goods. Clearly, achievement of thefiscal contraction under severe entrenchment of public non-interest expenditures was a welcome event boosting the hungry expectations of thefinancial arbitrageurs (see Table1). The second character-istic of the post-2001 era was its jobless-growth patterns. Rapid rates of growth were accompanied by high rates of unemployment and low participation rates. The rate of unemployment rose to above 10 per cent after the 2001 crisis, and despite rapid growth, has not come down to its pre-crisis levels (of 6.5 per cent in 2000). Furthermore, together with persistent open unemployment, disguised unemployment has also risen. According to TurkStat data,‘persons not looking for a job, but ready for employment if offered a job’ has increased from 1,060 thousand workers in 2001, to 1,936 thousands by 2006, bringing the total (open + disguised) unemployment ratio to 15.5 per cent.
In Table 1 we distinguish the different phases of the post 2001 macroeconomic developments of the Turkish economy. The post crisis adjustments bring the average rate of growth to 5.88 per cent over 2003–2008. The crisis hits Turkey with a decline of the real GDP by 4.82 per cent. After the surges in 2010 and 2011, GDP growth recedes to 2.12 per cent and 4 per cent in 2012 and 2013, respectively, as Turkey becomes part of the culminating great recession. With the exception of 2009, investment expenditures claim about 20 per cent of the gross domestic product. The distinct feature of the episode is the decline in savings. Private savings decline secularly over the period and falls below 10 per cent mark by 2013. The consequent development is the expan-sion of the current account deficit and the accompanied rise of the foreign debt.
Together with rapid growth, dis-inflation has been hailed as another area of ‘success’ for the AKP government. The Central Bank has started to follow an open inflation tar-geting framework since January 2006. The Bank’s current mandate is to set a ‘point’ target of 5 per cent inflation of the consumer prices. The inflation rate, both in consumer and producer prices had, in fact, been brought under control by 2004. Producer price inflation receded to less than 3 per cent in late 2005. After the brief turbulence in the asset markets in May-July 2006, inflation again accelerated to above 10 per cent and could only be brought under control gradually to 9.6 per cent towards the end of 2006.
Despite the positive achievements on the dis-inflation front, rates of interest remained slow to adjust. The real rate of interest on the government debt instruments (GDIs) for instance remained above 10 per cent over most of the post-crisis period and generated heavy pressures against the fiscal authority in meeting its debt obligations (see Figure 1). The persistence of the real interest rates, on the other hand, had also been conducive in attracting heavy flows of short-term speculative finance capital over 2003 and 2008. This pattern continued into the 2010s at an even stronger rate.
It is known that the availability of cheap foreign exchange and the consequent appreciation of the Lira were the factors behind the rapid rise of the per capita GDP val-ued in US$ terms. From $3,548 in 2001/02 per capita GDP rise to the more than $10,000 mark in 2010. Yet, due to the fall in the real price of the dollar, much of this expansion is exaggerated and comes to a halt with the real depreciation of the Lira under conditions of the global recession.
Inertia of the real rate of interest is enigmatic from the successful macroeconomic performance achieved thus far on the fiscal front. Even though one traces a decline in
T able 1. Macro aggregates. Econ omic Crisis Post Crisis Adjustment and Gr owth Global Crisis Patterns of Recovery Under the Gr eat Recession 2001 –2002 2003 –2008 2009 2010 201 1 2012 2013 Macr o Aggr egates GDP per capita (US$) 3,548 10,444 8,561 10,003 10,428 10,459 10,807 GDP real rate of growth (%) 2.41 5.88 − 4.82 9.15 8.77 2.12 4.00 As % o f GDP Consumption Exp. 70.12 69.84 71.46 71.69 71.18 70.19 70.87 Investment Exp. 14.63 21.78 14.93 19.52 23.55 20.13 20.62 Private Savings 25.1 16.90 18.00 12.30 10.7 1 1.6 9.7 Budget Balance − 10.5 − 3.25 − 5.5 − 3.6 − 1.4 − 2.1 − 1.2 Non-Interest (Primary ) Budget Balance 4.23 4.60 0.05 0.75 1.88 1.34 2.02 Public Domestic Debt Stock 38.49 35.50 34.64 32.1 1 28.42 27.28 25.81 Internalization Exports of Goods (b n $ ) 31.60 84.79 109.64 120.91 143.39 163.22 163.37 Imports of Goods (b n $ ) 49.15 132.54 134.49 177.31 232.53 228.55 243.39 Current Account Balance (b n $ ) − 2.26 − 26.16 − 13.40 − 45.42 − 75.08 − 48.49 − 65.07 Current Account Balance (% of GDP) − 1.43 − 4.75 − 2.27 − 6.30 − 9.70 − 6.17 − 7.40 T otal External Debt (b n $ ) 120.57 202.67 268.93 291.91 303.91 339.04 389.5 T otal External Debt (% of GDP) 52.88 39.91 43.76 39.85 39.34 43.07 47.29 Macr o Prices Consumer Prices (yearly % change) 33.13 1 1.81 6.50 6.40 10.40 6.16 7.32 Rael Interest Rate a 5.35 a 1 1.80 a 0.01 0.01 − 0.02 − 0.44 − 0.74 Index of Real Exchange Rate (TL/$) (2003=100) .. 88.70 87.70 79.37 89.29 86.21 87.72 Sou rces: T urkSta t (The T urki sh Statistical Institute), Minis try of D evelopm ent data bases; Centra l Bank of Repub lic of T urkey (C BR T) ele ctronic da ta disse mination syste m. aG D I interest rate for 2001 –2002 and 2003 –2008 ; CBR T Poli cy Rate (One-week Repo Rate) for post-2009. A ll d efl ated by the CPI.
the general plateau of the real interest rates, the Turkish interest charges are observed to remain significantly higher than those prevailing in most emerging market economies. The credit interest rate, in particular, has been stagnant at the rate 16 per cent despite the deceleration of price inflation until the 2006 May-July turbulence. Since then the credit interest rates accelerated to 23.5 per cent in 2006. The recent financial chaos that erupted in the housing and sub-prime credit markets of the US, had necessitated the CBRT to maintain high rates of interest against threats of contagion. So Turkey is by now severely constrained in maintaining significantly high rates of interest into the next decade of the 2000s.
The‘IMF programme’
The rapid increase of private sector debt – both by the financial and non-financial sec-tors alike, reveals the true essence of the IMF-engineered adjustment mechanisms fol-lowing the currency and banking crises of February 2001. The underlying characteristics of the Turkish post-crisis adjustments ultimately relied on maintaining high real rates of interest in anticipation of increased foreign capital inflow into the domestic economy. Coupled with an overall contractionaryfiscal policy, the programme
0 10 20 30 40 50 60
Inflaton rate CPI (2003=100)
CB Overnight Interest rates
Credit interest rates
Figure 1. Consumer inflation and interest rates.
Table 2. Macroeconomic targets of the post-2001 IMF programme.
Targets 2002 2003 2004 2005 2006
GDP Real Growth Rate 3.0 5.0 5.0 5.0 5.0
Public Sector Non-Interest Budget Balance / GDP (%) 6.5 6.5 6.5 6.5 6.3
Inflation Rate 35.0 20.0 12.0 8.0 5.0
Nominal Rate of Interest on Domestic Debt 69.6 46.0 32.4 27.4 23.9 Real Rate of Interest on Domestic Debt 25.6 21.7 18.2 18.0 18.0
found the main source of expansion in speculative inflows of foreign finance. The aforementioned elements of this adjustment path were clearly stated, in fact, in the Tur-key Country Report prepared by IMF staff in late 2001. Table 2 above makes a refer-ence to that 2001 report which had laid out the macroeconomic targets of the post-crisis adjustment path as envisaged by the IMF. It is very illuminating to note that the targets of the 2001 IMF Report encompassing 2002 through 2006 have eventually become the official targets of both governments over that period. The targeted rate of real GDP growth, for instance, was persistently set at 5 per cent for each coming year, despite the observed rapid expansion of the economy in rates often exceeding 7 per cent in the pre-ceding year. This choice was clearly no coincidence. Likewise, the inflation targets of the ‘independent’ central bank each year followed the path envisaged in the 2001 IMF Report, beginning with 20 per cent of 2003 to 5 per cent in 2006 (Note that CBRT has declared the onset of its official inflation targeting monetary regime in January 1, 2006). Finally, the very sanctimonious primary surplus target of the public sector at 6.5 per cent as a ratio to the GDP clearly finds its origins in the aforementioned report. That being said, what remains noteworthy is the IMF’s choice of a very high and persistent real interest rate targeted at 18 per cent throughout the programming horizon. The real interest rate target is persistently kept at its very high level despite the falling trajectory of the inflation rate. In comparison to Figure 1 above where the realized rates of infla-tion and interest were disclosed, the persistence of the high level of real interest rate against falling inflation rates seem to find a resonance in the adjustment path assumed by the IMF staff in the immediate post-2001 crisis. It is clear that the main adjustment mechanism of the post-crisis IMF programme was embedded in maintaining a signi fi-cantly high rate of real interest. The high interest rates attracted short-termfinance capi-tal; and the relative abundance of foreign exchange led to overvaluation of the Lira. Cheapened foreign exchange costs led to an import boom both in consumption and investment goods. Achievement of the fiscal contraction under severe entrenchment of public non-interest expenditures, in turn, was a welcome event further boosting the hun-gry expectations of thefinancial arbiters.
In sum, contrary to the traditional stabilization packages that aimed at increasing interest rates to constrain the domestic demand, the new orthodoxy aimed at maintain-ing high interest rates for the purpose of attractmaintain-ing speculative foreign capital from the international financial markets. The end results in the Turkish context were the shrink-age of the public sector in a speculative-led growth environment; and the consequent deterioration of education and health infrastructure, which necessitate increased public funds urgently. Furthermore, as the domestic industry intensified its import dependence, it was forced towards adaptation of increasingly capital-intensive, foreign technologies with adverse consequences on domestic employment.
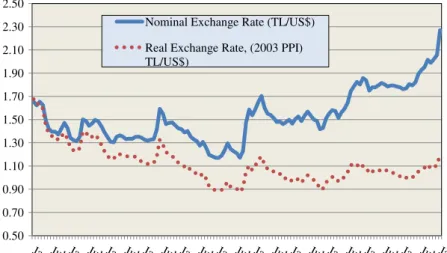
High rates of interest were conducive in generating a high inflow of hot money finance to the Turkish financial markets. The most direct effect of the surge in foreign finance capital over this period was felt in the foreign exchange market. The over-abun-dance of foreign exchange supplied by the foreignfinancial arbitrageurs seeking positive yields led significant pressures for the Turkish Lira to appreciate. As the Turkish Central Bank has restricted its monetary policies only to the control of price inflation, and left the value of the domestic currency to the speculative decisions of the market forces, the Lira appreciated by as much as 40 per cent in real terms against the US$ and by 25 per cent against the euro (in producer price parity conditions).
Figure 2 portrays the paths of the real and nominal (vis-à-vis the US$) exchange rate (in PPP terms, with producer prices as the deflator) over 2003–2014. The real
exchange rate has fallen in PPP, by about 40 per cent over 2003 to 2008. Then after due to the depreciation of the Lira, the real cost of US$ is observed to be maintained.
All these signify a rise in import demand with consequent expansion of the current account deficit. The current account deficit has reached to 10 per cent to the GDP in 2012, after when the CBRT decided to act to keep this ratio below the 6 per cent threshold with a resort to unconventional measures to combatfinancial instabilities asso-ciated with external debtfinancing. In fact, a significant detrimental nature of hot money ledfinancing of the current account deficit was its foreign debt intensity. As reported in Table1, the stock of external debt has increased by a total of $270 billion over the end of 2002 to the end of 2013. Despite this rapid increase, the burden of external debt was maintained at roughly 45 per cent to the GDP. This is due to both the rapid expansion of the GDP and the unprecedented appreciation of the Lira over the period. The appreci-ation of TL disguises much of the fragility associated with both the level and the exter-nal debt induced financing of the current account deficits. Under conditions of the floating foreign exchange regime, this observation reveals a persistent fragility for the Turkish external markets, as a possible depreciation of the Lira in the days to come may severely worsen the current accountfinancing possibilities. This persistent external fragility is actually one of the main reasons why Turkey had been hit the hardest among the emerging market economies in the post 2014 turbulence.
Persistent unemployment
Another key characteristic of the post-2001 Turkish growth path was its meagre perfor-mance in creating jobs. The rate of open unemployment was 6.5 per cent in 2000; increased to 10.3 per cent in 2002, and remained at that plateau despite the rapid surges in GDP and exports. Open unemployment is a severe problem, in particular, among the young urban labour force reaching 20 per cent. Table3 tabulates pertinent data on the Turkish labour market.
The civilian labour force (ages 15+) is observed to reach 55.6 million people as of 2013. On the other hand, the participation rate fluctuates around 48 per cent to 50 per
0.50 0.70 0.90 1.10 1.30 1.50 1.70 1.90 2.10 2.30 2.50
Nominal Exchange Rate (TL/US$)
Real Exchange Rate, (2003 PPI) TL/US$)
T able 3. Developments in the T urkish labour market (1,000 persons). Developments in the T urkish Labour Market (1,000 persons) New Series 2000 2001 2002 2003 2004 2005 2005 2006 2007 2008 2009 2010 201 1 2012 2013 15+ Age Population 46,209 47,158 48,041 48,912 49,906 50,826 48,359 49,174 49,994 50,772 51686 52541 53593 54724 55608 Civilian Labour Force 23,078 23,491 23,818 23,640 24,289 24,565 22,455 22,751 23,1 14 23,805 24748 25641 26725 27339 28271 Civilian Employment 21,581 21,524 21,354 21,147 21,791 22,046 20,067 20,423 20,738 21,194 21277 22594 241 10 24821 25524 Unemployed (Open) 1,497 1,967 2,464 2,493 2,498 2,520 2,388 2,328 2,376 2,61 1 3471 3046 2615 2518 2747 Open Unemployment Ratio (%) 6.5 8.4 10.3 10.5 10.3 9.9 10.6 10.2 10.3 1 1.0 14 1 1.9 9.8 9.2 9.7 Non-Agr . Unemployment Ratio (%) 9.3 12.4 14.5 13.8 14.3 13.6 13.5 12.7 12.6 13.6 17.4 14.8 12.4 1 1.5 12 Disguised Unemploymenta 1,139 1,060 1,020 945 1,223 1,714 2,087 1,959 1,805 1,850 2,061 2,013 1,945 1,900 2,014 T otal Unemployment Ratio b (%) 10.9 12.3 14.0 14.0 14.6 16.1 18.2 17.3 16.8 17.4 20.6 18.3 17.5 15.4 16.4 Civilian Employment by Sectors Agriculture 7,769 8,089 7,458 7,165 7,400 6,493 5,154 4,907 4,867 5,016 5,240 5,683 6,143 6,097 6,015 Industry 3,810 3,774 3,954 3,846 3,987 4,284 4,183 4,283 4,314 4,440 4,079 4,496 4,704 4,751 4,967 Construction 1,364 1,1 10 958 965 1,030 1,173 1,107 1,196 1,231 1,242 1,306 1,431 1,676 1,709 1,690 Services 8,637 8,551 8,984 9,171 9,374 10,096 9,623 10,037 10,326 10,495 10,650 10,986 1 1,586 12,266 13,154 Source: T urkish Sta tistical Institute (T urkS tat), House hold Labour For ce Surve ys. a. Pe rsons not looki ng for a job yet ready to work if of fered a job: (i) Seekin g emp loyment and ready to work within 15 day s, and yet did not use any of the job searc h channe ls in the last thre e mont hs; plus (ii) disc ourage d work ers. b. T otal (open + disguised ) unemplo yme nt accounting for the persons ‘not in labour force ’.
cent, due mostly to the seasonal effects. It is known, in general that, the participation rate is less than the EU average. This low rate is principally due to women choosing to remain outside the labour force, a common feature of Islamic societies, but its recent debacle depends as much on the size of the discouraged workers who had lost their hopes for finding jobs. If we add the TurkStat data on the underemployed people, the excess labour supply (unemployed + underemployed) is observed to reach 16.4 per cent of the labour force in 2013. Another strikingfigure comes from the OECD showing the percentage of youth not in education and employment (NEET), standing at 35.9 per cent as of 2013, posting the highestfigure within the OECD peer set.
In fact, the most striking observation on the Turkish labour markets over the post-2001 crisis era is the sluggishly slow performance of employment generation capacity of the economy. Despite the very rapid growth performance across industry and services, employment growth has been meagre. This observation, which actually is attributed to many developing economies as well,4 is characterized by the phrase job-less-growth in the literature. In Turkey this problem manifests itself in insufficient employment generation despite the very rapid growth conjuncture especially after 2002.
To be certain, the effectiveness of the labour promoting policy measures cannot be separated from the overall macroeconomic environment the domestic economy had been situated in, and none of these outcomes were of course independent from the overall macro performance of the Turkish economy. Unfortunately, the character of macroeco-nomic policies that were effective in Turkey following the 2001 crisis had generally been quite unfriendly for employment generation.
A major distinct feature of the Turkish economic scene in the post-2001 crisis era was its relatively high interest rates and high costs of credit. Operating under an envi-ronment of global financial expansion, this fact has led to a rapid expansion of foreign capital inflows, especially in the form of short-term speculative ‘hot’ finance. The under-lying speculative nature of suchflows was a witness to the fact that they were not nec-essarily part of ‘green field investments’ that could expand labour demand by creating new jobs and bringing new advanced technologies. The ‘hot’ character of speculative finance resulted in mainly currency appreciation and loss of competitiveness for the tra-ditional Turkish exportables.‘Modern’ manufacturing sectors, on the other hand, gained from this appreciation. These were mostly sectors such automobiles, auto parts, and con-sumer durables. They typically display high import content, and the fact that imports got cheaper meant significant cost savings for such sectors. Thus, Turkish exports of automotives and consumer durables expanded during this period. However, being import dependent, such sectors displayed relatively low domestic value added content and had relatively low elasticities of labour employment. In what follows, the appreciation of the exchange rate led to a loss of competitiveness and stagnation of the labour intensive tra-ditional Turkish exportables, such as textiles, clothing, small scale glass and ceramics. As labour employment demand dwindled in these sectors, the rising ‘modern’ manufac-tures had low elasticities of labour and could not maintain high employment gains. The end result was a rise of unemployment.
Figure 3 summarizes all these assessments succinctly. Thefigure depicts total (open plus disguised) unemployment ratio as a line graph with respect to the right axis. This ratio is borrowed from data in Table 3 above. It is contrasted against the non-energy component of current account deficit that is displayed with respect to the left axis. The portrayal of the rising non-agricultural unemployment along with an expanding current account deficit is no surprise to students of development economics. As Turkey con-sumed more and more of value added produced abroad, and found it profitable with an
appreciated currency financed by speculative financial inflows, external deficit widened and foreign debt accumulated. The costs of this speculative-led growth, however, were realized as loss in jobs, and decline of real wage income.
Thus, in conclusion, two important characteristics of the post-crisis adjustment path stand out: first is that the output growth contrasts with persistent unemployment, war-ranting the term ‘jobless growth’. Second, the post-2001 expansion is observed to be concomitant with a deteriorating external disequilibrium, which in turn is the end result of excessive inflows of speculative finance capital, and was named ‘speculative-led’ in the preceding section. Now, we turn to a further elaboration of this issue in more detail.
Debt-ridden speculative growth
After 2006, the Turkish economy started to operate with a considerably high-rate (above 6 per cent) of current account deficit in order to achieve positive growth. It was in 2012 when this observation became clearer. In contrast to the ‘mild descent’ scenarios as expected by the official bureaucracy and the international financial speculators, this per-iod represented a new threshold in the process of transforming the Turkish economy into a foreign debt-ridden economy presenting a heaven of cheap imports and labour surplus. Furthermore, we observe that a key distinguishing feature of the Turkish econ-omy over this period was that the (positive) correlation between the growth rate and foreign savings (current account deficit) jumped to successfully higher thresholds in almost a permanent manner.
One should note that traditionally Turkey was not an economy generating high cur-rent account deficits. Observe for instance, that during the 1990s, the growth rate of national income was 3.6 per cent, while the ratio of current account deficit to gross domestic product remained below 1 per cent. Starting from 2003, annualized current deficit increased to the 3–4 per cent band, and then jumped to 6 per cent after 2006. In
14.0 15.0 16.0 17.0 18.0 19.0 20.0 21.0 22.0 0 10 20 30 40 50 60 2002 2003 2004 2005 2006 2007 2008 T otal Une m p lo y ment Ratio Non-A g riculture (%) T ra d e Deficit Ex cluding Oil I mports (B illions$)
Non-Energy Trade Deficit (Billions US$) (Left Axis)
Total Unemployment Ratio - Non-Agriculture (Right Axis)
2009, the growth rate, in parallel with the global recession, was minus 4.8 as the current deficit went down. However, then, in 2010, the ratio of current accounts deficit to national income again began to increase. The data included in the Table 4 below exhi-bits these observations.
What is also alarming is the poor quality of the mode offinancing of the aforemen-tioned deficits. Table5 encapsulates this issue. It can be read from the data that 85 per cent of the current account deficit for the year 2012, namely $48.5 billion, was financed by net inflows of portfolio investments and unrecorded capital inflows (so-called net errors and omissions). However, in retrospect, the percentage of the said-items in the current account deficit was around 40 per cent in 2010 and 2011.
Being predicated on portfolio investments and unrecorded capital inflows, the hot money flows present the most volatile form of capital, which is also the most sensitive one to abrupt swings of foreign exchange speculation. These kinds of capital inflows, as created by hot money flows based on speculative incentives, account for the primary reasons responsible for excessive volatility and uncertainty in real sectors of the national economy.
Debt-driven accumulation
In 2008, Turkey’s national income, the gross domestic product (GDP), was $742.1 bil-lion with a total external debt stock of $281 bilbil-lion, $52.5 bilbil-lion of which was com-posed of short term debt. Data presented in Table 6 indicate the Turkish economy’s external borrowing and growth adventure during the process of global great recession (2008–2012).
From 2008 to 2012, over the so-called great recession cycle, the Turkish economy has accumulated net extra external debt amounting to $55.8 billion in total (See Table7). Over the course of the same period, Turkish gross domestic product advanced to $786.4 Table 4. GDP growth rates and current account deficit to GDP ratios.
Growth Rate of National Income (per cent)
Current Account Deficit / National Income (per cent)
1990–2002 3.6 0.8 2003–2005 7.7 3.6 2006–2007 5.8 6.0 2008 0.7 5.5 2009 −4.8 2.0 2010–2011 8.96 7.9 2012–2013 3,1 7.0
Source: TurkStat and CBRT data dissemination system.
Table 5. Current account balance and selectedfinancing items ($ Million).
Current Accounts Balance Portfolio Investments Net Errors and Omissions
2010 −45,312 16,083 232
2011 −75,008 22,204 9008
2012 −48,535 41,012 346
billion with a cumulative increase of $44.3 billion. That’s to say, after 2008 the total net increase in external indebtedness was higher than that of the national income.
Another astonishing aspect of this growth miracle, which was running the Turkish economy into a debt trap at a dizzying speed, is that the external borrowing is mostly characterized by short-term structure. The net increase in short-term external debt stock, $48.4 billion, accounts for 87 per cent of the overall increase.
A related question is which agents (institutions) were the dominant sources of this episode. The official data reveal that out of the net increase of $55.8 billion in external indebtedness, $18.5 billion was generated by the public sector (including the Central Bank), while $37.3 billion was contracted by the private sector. Almost all of the pri-vate sector external debt was in turn concluded by the financial institutions. Only 1.6 per cent (corresponding to $0.6 billion) of the net increase of $37.3 billion in private sector external indebtedness was generated by non-financial institutions.
However, the case was the exact opposite before 2008. Approximately two-thirds of the $100 billion net external debts accumulated by the Turkish private sector during the period 2003–2008 were accumulated by non-financial real economy sectors. Since the 2008/09 crisis, the real sector companies have seemingly declined using credit by way of external borrowing. Turkey has been, once again but much more severely, possessed by speculativefluctuations led by the risk appetite of the financial arbitrageurs.
Assessment of the monetary policy
When Turkey’s stability programme that was based on a crawling exchange rate peg hit the wall in February 2001, the Turkish economy experienced a severe crisis, paving the way for a free floating Lira soon after. The stormy days of the crisis triggered a chain Table 6. Debt-led growth in Turkey.
Total External Debt Stock ($ million)
Short-term external
debt stock ($ million) GDP ($ million)
2008 281.045 52.522 742.094,4 2009 269.223 49.020 616.703,3 2010 291.924 77.369 734.928,6 2011 304.207 81.996 773.980,0 2012 336.863 100.951 786.393,0 2012–2008 Difference 55.818 48.429 44.298,6
Sources: TurkStat, National Accounts and CBRT data dissemination system.
Table 7. Sources of increase in the external indebtedness.
Distribution of Net Increase in External Indebtedness (2008–2012, $ million)
Public 18.487
Private 37.332
Financial 36.731
Non-financial 601
TOTAL 55.819
of mandatory reforms, which included an amendment in the CBRT Law as of April 2001, giving independence to the Bank.
In its early days in office, the economy management of the AKP used this ‘indepen-dent Central Bank’ rhetoric as a part of the promotion strategy in an attempt to rebuild the confidence of the foreign investors to the country. Yet ironically, the independence of the CBRT was under heavy attack by the same AKP government after a decade, only to show us that despite the 12 years that were left behind, monetary policy management did not become institutional in Turkey.
While bad experience associated with the pegged currency pushed the Bank to seek an alternative regime, newly obtained independence helped the Bank to converge to the Inflation Targeting (IT) which was fashionable among the emerging market (EM) coun-tries at that time. But seeing the difficulty of fulfilling the pre-requisites of IT overnight, CBRT designed a transitional policy period called implicit inflation targeting that lasted from 2002 to 2005.
Accordingly, from 2002 to 2005, CBRT ran implicit inflation targeting and managed to bring annual headline consumer inflation down to 7.7 per cent as of 2005 from 29.7 per cent in 2002. During the implicit inflation targeting era, annual inflation stayed below the targeted year-end levels, helping the CBRT to gain confidence and some credibility for the newly introduced inflation targeting regime. Hence, as of 2006 explicit inflation targeting period kicked off officially.
Yet as inflation came down to single digit, the challenge in explicit inflation target-ing period was bigger with sticky prices and therefore the CBRT was not as successful this time. Indeed, from 2006 to 2008, the CBRT exceeded the official inflation targets in each of the three years, bringing Turkey back to double digit year-end inflation as of 2008. The Bank chose to blame the supply side shocks for high inflation prints and upward revised the official inflation targets for the coming years.
Accordingly, inflation targets were revised up to 7.5 per cent and 6.5 per cent for 2009 and 2010, respectively, up from 4 per cent targeted in 2007 and 2008. The Bank owes hitting the inflation targets in this period to this upward revision.
Since then, the inflation path continues to be highly volatile seeing double digit in 2011 to be followed by a historic low rate in 2012 and then rising again in 2013 and 2014, exceeding the target.
Table8 helps us to exhibit the poor performance of the CBRT in inflation targeting. For convenience, let us summarize the key findings from the table above that will shed light to our upcoming assessment about the monetary policy management in Turkey:
• Throughout the nine years of explicit inflation targeting, CBRT missed the point inflation target for eight years (except for 2010).
• Median figure of the difference between annual inflation realization and point inflation target is 3.2 percentage points, comfortably exceeding the CBRT’s uncer-tainty band of 2 percentage points.
• CBRT’s inflation projections that are communicated to the public via the main communication tool of Inflation Report, vary considerably within the same year, falling short of giving credible guidance to shape the expectations.
• Hence quiet understandably, CBRT operates with a credibility gap casting its sha-dow over the monetary transmission mechanism.
Not surprisingly, this unsuccessful IT performance of the CBRT delivers the fact that, Turkey has been running with an average consumer inflation that exceeds the EM
average. Even in the aftermath of the Great Recession– a period marked with low infla-tion – Turkey diverged from the peers with its high average inflation figures (See Fig-ure4).
But noting the failure of the CBRT in its price stability mandate standalone, would lead to missing the big picture. Instead one shall question the leading motive behind the CBRT’s reaction function during this decade, which requires a thorough understanding of Turkey’s growth strategy.
Coming to office right after the twin crisis of 2000–2001, the AKP’s clear priority was supporting growth, which was a quiet understandable choice at that time. But instead of working on a full-fledged medium term plan based on fundamental improve-ment in productivity and value creation ability of the country, the governimprove-ment chose to follow the easy way of building Turkey’s growth model on speculative money (See Fig-ure5).
Turkey had an average domestic savings to GDP ratio of 22 per cent in the 1990s. This ratio fell towards 13 per cent during the reign of the AKP, raising the dependence Table 8. CBRT’s inflation targeting record.
Difference Between the Upper and Lower Band of the Inflation Projections Inflation Projections in I II IR-I* IR-IV*
Target Realization II-I III IV IV-III IV-II IR-I IR-II
2006 5.0 9.7 4.7 5.5 9.9 4.4 0.2 1.6 1.4 2007 4.0 8.4 4.4 5.1 7.3 2.2 −1.1 3.0 1.2 2008 4.0 10.1 6.1 5.5 11.1 5.6 1.0 2.8 n.a. 2009 7.5 6.5 −1.0 6.8 5.5 −1.3 −1.0 2.8 1.0 2010 6.5 6.4 −0.1 6.9 7.5 0.6 1.1 2.8 1.0 2011 5.5 10.4 4.9 5.9 8.3 2.4 −2.1 2.8 1.0 2012 5.0 6.5 1.5 6.5 7.4 0.9 0.9 2.8 1.0 2013 5.0 7.4 2.4 5.3 6.8 1.5 −0.6 2.8 1.0 2014 5.0 8.2 3.2 6.6 8.9 2.3 0.7 2.8 1.0
Source: Authors’ own calculations based on CBRT data. *IR: Inflation Report.
5 6 7 8 9 10 11 2004 2005 2006 2007 2008 2009 2010 2011 2012 2013 2014 Emerging and Developing Countries
Turkey
of the country on external savings. This dependence let the economy management of the AKP built the pillars of the growth on the foreign saving attraction ability of the country, which wasfine tuned by the monetary policy.
The share of consumption in Turkey’s GDP is over 65 per cent. Meanwhile, some 60 per cent of the tax revenues come from the indirect tax revenues versus an average of 35 per cent in EU-28+. Hence, monetary policy was designed in a way to polish the growth and budget balance through leverage based consumption, fuelled by external savings.
As Figure6 exhibits This Ponzi scheme like model created a trade-off betweenfiscal performance and external balance. Monetary policy was fine tuned to attract external savings, which then boosted the leverage based domestic consumption, leading to deteri-oration in the current account balance via import channel, but supporting thefiscal bal-ance through indirect tax revenues.
Within this model, fiscal policy was just a dependent variable on the monetary pol-icy, not taking an active role in the overall balance of the economy. It was used as a part of the promotion campaign, showing the falling rate of public debt to GDP ratio, but only to put the burden of indebtedness over the shoulder of households and the pri-vate sector.
The share of liabilities within households’ disposable income rose to 55 per cent in 2013 up from 36 per cent in 2009. Meanwhile, the private sector runs with a short FX position of $176 million; 21 per cent of the GDP in 2013 up from 10 per cent of the GDP in 2007. -8 -6 -4 -20 2 4 6 8 10 12 1999 2000 2001 2002 2003 2004 2005 2006 2007 2008 2009 2010 2011 2012 2013
Net Capital Inflows/GDP (%) Real GDP Growth,%,YoY
Figure 5. Net Capitalflows vs GDP growth. Source: Authors’ own calculations based on CBRT data. -10.0 -9.0 -8.0 -7.0 -6.0 -5.0 -4.0 -3.0 -2.0 -1.0 0.0 -12.0 -10.0 -8.0 -6.0 -4.0 -2.0 0.0 2003 2004 2005 2006 2007 2008 2009 2010 2011 2012 2013 2014E CAD / GDP (%)(l.a.)
Central Government Budget Balance / GDP (%)
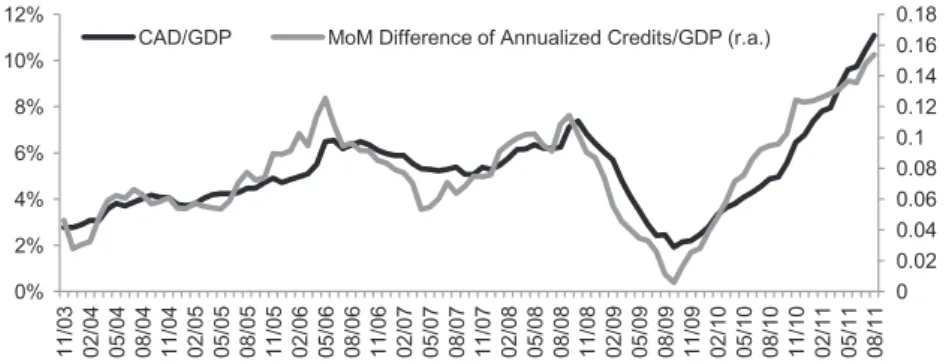
Raiding international capital flow in the aftermath of the Great Recession polished the credit channels at the expense of inflation targets. According to World Bank figures, domestic credit given to private sector as a per cent of GDP rose by 17.5 per cent in Turkey between 2008–2011, posting the third fastest growth performance after China and Thailand.
This booming credit growth served as a wake up call (See Figure 7), opening a new chapter in the monetary policy era. CBRT incorporated ‘financial stability’ to the IT framework as of late 2010 (See Table9).
Within this new approach, the CBRT preserved its price stability mandate but started to keep an eye on thefinancial stability. This multi-objective policy stance came with a bigger toolbox. In addition to the good old policy rate, the CBRT added new policy tools to its basket, such as reserve option mechanism, interest rate corridor, credit policy and etc. This was also the beginning of the period where monetary policy became noisy and opaque.
Designed to attract external savings, the CBRT has been trying to offer some kind of predictability in its rate decisions, pointing at‘interest rate smoothing’ motive for the Bank. Yet multi-objective, multi-tool policy stance of the recent years contrasted with this motive, not being able to fulfil the prerequisites of interest rate smoothing due to the CBRT’s weak credibility, poor communication attempts and lack of a well-explained simple monetary rule.
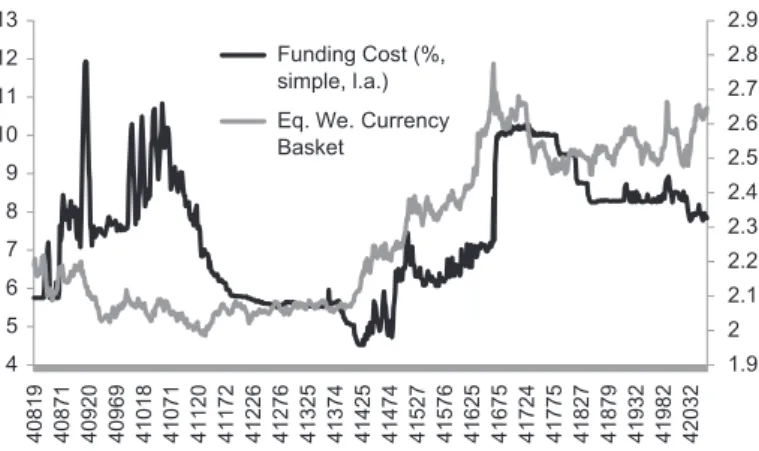
Indeed, reaction function of the CBRT became a ‘behind-the-curve’ operation, deliv-ering late correction moves following the depreciation of the local currency, in an attempt to continue to attract external savings, which lies in the heart of Turkey’s unsus-tainable growth model (See Figure8).
Riskiness of this model became more obvious in the early months of 2015 when politicians pressured the CBRT for premature rate-cuts, disregarding the independence
0 0.02 0.04 0.06 0.08 0.1 0.12 0.14 0.16 0.18 0% 2% 4% 6% 8% 10% 12% 11/ 0 3 02/ 0 4 05/ 0 4 08/ 0 4 11/ 0 4 02/ 0 5 05/ 0 5 08/ 0 5 11/ 0 5 02/ 0 6 05/ 0 6 08/ 0 6 11/ 0 6 02/ 0 7 05/ 0 7 08/ 0 7 11/ 0 7 02/ 0 8 05/ 0 8 08/ 0 8 11/ 0 8 02/ 0 9 05/ 0 9 08/ 0 9 11/ 0 9 02/ 1 0 05/ 1 0 08/ 1 0 11/ 1 0 02/ 1 1 05/ 1 1 08/ 1 1
CAD/GDP MoM Difference of Annualized Credits/GDP (r.a.)
Figure 7. Current account balance vs credits (% of GDP) Source: BRSA, CBRT.
Table 9. Monetary policy periods in Turkey.
2001–2006 Implicit Inflation Targeting (IT)
2006–2008 Full-fledged Conventional Inflation Targeting 2009–2010 Adjusting to the post crisis conditions
Late 2010- to date Incorporating Financial Stability Objective into the IT Framework
of the CBRT. Such a political pressure over the Bank also discredited the decade long efforts to build a credible monetary policy management, turning monetary policy’s itself into a risk factor.
In the period ahead, rate hike by the Federal Reserve System (FED) will be on the agenda that will serve as a Litmus Test for emerging market (EM) countries, which have insufficient savings. Data in hand show that Turkey is running full throttle to the dawn with its unresolved fundamental weaknesses and poor institutional design, pointing at a painful correction.
Conclusion
Turkey’s post-crisis adjustment under the AKP administration traces the steps of many developing country governments, which are dependent upon foreign capital and are con-ditioned to adopt or maintain contractionary policies in order to secure ‘investor confi-dence’ and ‘international creditworthiness’. Such efforts were restricted to a balanced budget, entrenched fiscal expenditures, and a relatively contractionary monetary policy with an ex ante commitment to high real interest rates.
Turkey is now entering the second half of 2010s with severe disequilibrium and increased external debt burdens. The generally favourable global conditions that were conducive to the rapid growth performance of the economy under the AKP’s first rule of administration are, generally speaking, not present in the new conjuncture. Turkey has to face the current turbulence and the consequent decline of credit in the global financial markets with a strained labour market and intensified external fragility. There is no doubt that the necessary adjustments that lie ahead for securing economical stabil-ity in Turkey under a darkening external environment will be more costly and difficult.
Disclosure statement
No potential conflict of interest was reported by the authors.
Notes
1. The underlying elements of the disinflation programme and the succeeding crisis are dis-cussed in detail in Akyüz and Boratav (2003); Ertuğrul and Yeldan (2003); Yeldan (2002);
1.9 2 2.1 2.2 2.3 2.4 2.5 2.6 2.7 2.8 2.9 4 5 6 7 8 9 10 11 12 13 40819 40871 40920 40969 41018 41071 41120 41172 41226 41276 41325 41374 41425 41474 41527 41576 41625 41675 41724 41775 41827 41879 41932 41982 42032 Funding Cost (%, simple, l.a.) Eq. We. Currency Basket
Boratav and Yeldan (2006); and Alper (2001). See also the GPN Report on Turkey, 2005 and the web site of the Independent Social Scientists Alliance (www.bagimsizsosyalbilimciler.org) for further documentation of the crisis conditions.
2. i.,e., balance on non-interest expenditures and aggergate public revenues. The primary surplus target of the central government budget was set 5 per cent to the GDP.
3. The target was set at 5 per cent on consumer price inflation for 2006, and 4 per cent for 2007 and 2008.
4. See, e.g., UNCTAD (2002,2003).
Notes on contributors
A. Erinç Yeldan is Acting Dean of the Faculty of Economics, Administrative and Social Sciences, received his Ph.D. from University of Minnesota, USA, and joined the Department of Economics at Bilkent in 1988. During 1994/95 he was a visiting scholar at the University of Minnesota where he taught Applied General Equilibrium Analysis. During 2007/2008 he was a Fulbright scholar at University of Massachusetts, Amherst and at Amherst College. Dr. Yeldan’s recent work focuses on development macroeconomics, economics of climate change, and on empirical, dynamic general equilibrium models with emphasis on the Turkish economy. He is one of the executive directors of the International Development Economics Associates (IDEAs), New Delhi. Burcu Ünüvar obtained her MSc degree on Applied Economics and Finance from Copenhagen Business School in Denmark. She was also a visitor at Washington State University during her postgraduate study. Her dissertation topic was on‘estimating Turkey’s reaction function and test-ing Harvey’s growth model’. She has 10 years of managerial experience in investment banktest-ing economic research prior to restarting her academic career back in 2013. Her main fields of research are monetary policy, international economics andfinancial economics.
References
Akyüz, Yılmaz, and Korkut Boratav. 2003. “The Making of the Turkish Crisis.” World Develop-ment 31 (9): 1549–1566.
Alper, Emre. 2001.“The Turkish Liquidity Crisis of 2000: What Went Wrong?” Russian and East European Finance and Trade 10 (37): 51–71.
Boratav, Korkut, and Erinç Yeldan. 2006. “Turkey, 1980-2000: Financial Liberalization, Macroe-conomic (in)-stability, and Patterns of Distribution.” Chap.14 In External Liberalization in Asia, Post-socialist Europe and Brazil, edited by Lance Taylor, 417–455. Oxford and New York: Oxford University Press.
Cizre, Ümit, and Erinç Yeldan. 2005. “The Turkish Encounter with Neo-liberalism: Economics and Politics in the 2000/2001 Crises.” Review of International Political Economy 12 (3): 387–408.
Ertuğrul, Ahmet, and Erinç Yeldan. 2003. “On the Structural Weaknesses of the Post-1999 Turkish Dis-inflation Program.” Turkish Studies Quarterly 4 (2): 53–66.
Grabel, Ilene. 1995.“Speculation-led Economic Development: A Post-keynesian Interpretation of Financial Liberalization Programmes in the Third World.” International Review of Applied Economics 9 (2): 127–149.
IMF. 2001.“Turkey Country Report.”www.imf.org
Independent Social Scientists Alliance (ISSA). 2005. 2005 Başında Türkiye’nin Ekonomik Ve Siyasal Yaşamı Üzerine Değerlendirmeler [An Assessment of the Turkish Economic and Polit-ical Life at the beginning of 2005]. http://www.bagimsizsosyalbilimciler.org/Yazilar_BSB/ BSB2005Mart.pdf
UNCTAD. 2002. Trade and Development Report. http://unctad.org/en/PublicationsLibrary/ tdr2002_en.pdf
UNCTAD. 2003. Trade and Development Report.http://unctad.org/en/Docs/tdr2003_en.pdf Yeldan, Erinç. 2002. “On the IMF-Directed Disinflation Program in Turkey: A Program for
Stabilization and Austerity or a Recipe for Impoverishment and Financial Chaos?” In The Ravages of Neo-liberalism: Economy, Society and Gender in Turkey, edited by Neşecan Balkan and Sungur Savran. pp 132–156. New York: Nova Science Pub.