Deep Sentiment Analysis: A Case Study
on Stemmed Turkish Twitter Data
HARISU ABDULLAHI SHEHU 1, (Graduate Student Member, IEEE),
MD. HAIDAR SHARIF 2, (Member, IEEE),
MD. HARIS UDDIN SHARIF 3, (Graduate Student Member, IEEE),
RIPON DATTA 3, (Graduate Student Member, IEEE), SEZAI TOKAT 4, SAHIN UYAVER 5,
HUSEYIN KUSETOGULLARI 6, (Member, IEEE), AND RABIE A. RAMADAN 7, (Member, IEEE)
1School of Engineering and Computer Science, Victoria University of Wellington, Wellington 6012, New Zealand 2College of Computer Science and Engineering, University of Hail, Hail 2440, Saudi Arabia
3Department of International Graduate Services, University of the Cumberlands, Williamsburg, KY 40769, USA 4Department of Computer Engineering, Pamukkale University, 20160 Denizli, Turkey
5Department of Energy Science and Technologies, Turkish-German University, 34820 Istanbul, Turkey 6Department of Computer Science, Blekinge Institute of Technology, 37141 Karlskrona, Sweden 7Computer Engineering Department, College of Engineering, Cairo University, Cairo 12613, Egypt
Corresponding author: Md. Haidar Sharif ([email protected])
ABSTRACT Sentiment analysis using stemmed Twitter data from various languages is an emerging research topic. In this paper, we address three data augmentation techniques namely Shift, Shuffle, and Hybrid to increase the size of the training data; and then we use three key types of deep learning (DL) models namely recurrent neural network (RNN), convolution neural network (CNN), and hierarchical attention network (HAN) to classify the stemmed Turkish Twitter data for sentiment analysis. The performance of these DL models has been compared with the existing traditional machine learning (TML) models. The performance of TML models has been affected negatively by the stemmed data, but the performance of DL models has been improved greatly with the utilization of the augmentation techniques. Based on the simulation, experimental, and statistical results analysis deeming identical datasets, it has been concluded that the TML models outperform the DL models with respect to both training-time (TTM) and runtime (RTM) complexities of the algorithms; but the DL models outperform the TML models with respect to the most important performance factors as well as the average performance rankings.
INDEX TERMS Data augmentation, deep learning, machine learning, neural networks, sentiment analysis, Turkish, Twitter.
PROPOSED ACRONYMS
ACC =Accuracy
AUC =Area Under the ROC Curve
CNN =Convolution Neural Network
DECT =Decision Tree
DL =Deep Learning
F1S =F1 Score
HAN =Hierarchical Attention Network
MAXE =Maximum Entropy
RANF =Random Forests
ROC =Receiver Operating Characteristic
RNN =Recurrent Neural Network
The associate editor coordinating the review of this manuscript and approving it for publication was Chun-Wei Tsai .
RTM =Runtime
RSVM =Random Forest + Support Vector Machine SVMs =Support Vector Machines
TML =Traditional Machine Learning
TTM =Training-time.
I. INTRODUCTION
As social media encompasses a wide range of interactive applications for allowing users to create and share content with the public, it plays an important role in modern life [1]. There are numerous social media applications, which can be used for various purposes. For instance, there are dating apps (e.g., Tinder, Bumble, and Zoosk), multi-purpose messaging apps (e.g., WhatsApp, WeChat, and Facebook Messenger), online news apps (e.g., Yahoo News, Google News, and
Flipboard), video chatting apps (e.g., Skype, IMO, and Zoom Meetings), and micro-blogging apps (e.g., Twitter, Tumblr, and FriendFeed) [2]. These apps include both immense advantages and extreme risks associate to the exposure of privacy aspects [3]–[5].
Currently, Twitter is one of the best-known channels in the micro-blogging world allowing tweeple (TWitter pEEPLE) publicly to post their views and opinions on various topics using the hashtag topic ‘‘#topic’’. For instances, #football, #security, and #networking hint to talk about football, secu-rity, and networking, respectively. Twitter allows tweeple to read and send messages that consist of up to 280 characters. These messages are called tweets. Tweets are widely used for expressing views on certain topics [6]. Twitter includes short posts, graphics interchange formats, article links, and videos. The huge amount of data found on Twitter make it a very compulsive medium for performing data analysis related researches. One of the most common approaches to analyze Twitter data is via sentiment analysis [7]–[19]. Sentiment analysis is the computational study of people’s emotions, attitudes, and opinions towards an entity. It could be an event, organization, individual, or a topic [20]. Sentiments have been expressed via social media through text-based messages and images [21]. In sentiment analysis, stemming is a commonly used method applied to textual data to find their roots as part of a pre-processing operation [22]–[27]. The stemming rather reduces the information gained from the data in many languages. In fact, the stemming improves accuracy (ACC [28]) achieved by various methods in dif-ferent languages including not only English [29], [30] but also Arabic [26], [27], [31], [32], Indonesian [23], [33], [34], Japanese [25], [35] French [36]–[38], Portuguese [37], [39], German [37], [40], [41], Hungarian [37], [42], [43], Span-ish [44]–[47], and TurkSpan-ish [48]–[50].
The Turkic language [51] as one of the world’s fundamen-tal languages are a language family of at least 35 documented languages [52]–[54], spoken by the Turkic peoples of Eurasia from Southern Europe, Eastern Europe, the Caucasus, Central Asia, Western Asia, North Asia, and East Asia [51]. The total number of the Turkic language speakers is over 200 mil-lion [55]. Turkish as one of the Turkic language has the greatest number of speakers, spoken mainly in Anatolia and the Balkans; its native speakers account for about 40% of all Turkic speakers [56]. Based on the estimation of Worldome-ters [57], in 2019 the world population was approximately 7.7 billion and the native Turkish speakers were estimated as 79.4 million, i.e., 1.08% of the total world population. Roughly, at present Turkic-speaking population is 2.6% of the total world population.
There are many text-based studies found in the literature on sentiment or opinion analysis in English language [29]. However, only a handful number of studies were found to be in Turkish [54], [58]–[62]. This is due to its inherent complexity. The hidden suffix of the Turkish makes a word negative within words or a negative word might have a dis-similar message in a sentence. Negations of the Turkish must
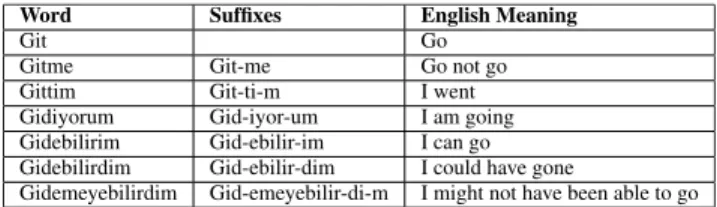
TABLE 1.Example of the Turkish root words extended to produce new meaning.
TABLE 2.Example change in polarity of a word due to an added suffix.
TABLE 3.Example of words negated due to a hidden suffix.
be carefully taken into consideration. The key differences between the Turkish and the English [63] have been sum-marized in TABLEs1,2,3, and 4; where root words can be extended by many suffixes to produce new meanings, an added suffix may change the polarity of a word, words can be negated by suffix hidden within the words, a word that appears to be negative may change its polarity to have a different meaning when used in a sentence, respectively.
Moreover, the existing sentiment analysis methods devel-oped for English rarely possess productive outcomes when it comes to Turkish [64]. For instance, the application of stem-ming on textual data increases the achieved good accuracy on textual data in English [30] or other languages; but this might not always be the case in Turkish. Besides, sentiment analysis is extremely difficult on Turkish over English texts [63].
We know from our previous work [54], [61], [62], that while the produced words after stemming helps improve the accuracy of the method using polarity lexicon, the achieved accuracy is relatively lower [54] using the traditional machine learning (TML) algorithms such as Naive Bayes (NB), Max-imum Entropy (MAXE), Decision Tree (DECT), Random Forests (RANF), and Support Vector Machines (SVMs). Anecdotally, this is because by chopping the end of the tweets, the stemming reduces the amount of information gained from these tweets.
Both DL and TML algorithms can be used to analyze sentiment from Turkish textual data. However, it is unknown if DL or TML algorithms will achieve a better performance on sentiment analysis of stemmed Turkish textual data.
This research aims to use a deep learning algorithms to analyze the sentiment of Turkish Twitter texts. Contrary to the traditional machine learning techniques that trained directly on the reduced data, the research proposed three data aug-mentation techniques (Shift, Shuffle, and Hybrid) to improve
TABLE 4. Example of a word changing its meaning when used in a sentence.
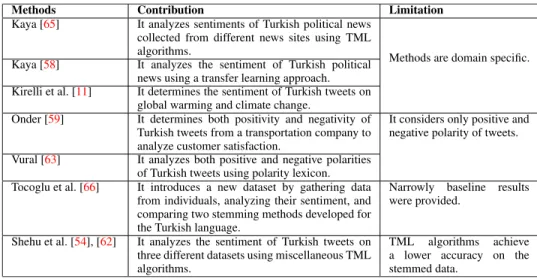
TABLE 5. Summary of research efforts on sentiment analysis of Turkish Twitter texts carried out in recent years.
the diversity of the data during training in order to improve the accuracy on stemmed data. These techniques improve the number of the training set in a dataset. Subsequently, we used three supreme types of DL models namely recurrent neural network (RNN), convolution neural network (CNN), and hierarchical attention network (HAN) to analyze the sentiment from the stemmed Turkish Twitter data. Moreover, as using accuracy as performance measure might be bias, we used four different types of performance metrics namely runtime (RTM), ACC, area under curve (AUC), and F1 Score (F1S) to evaluate the algorithms.
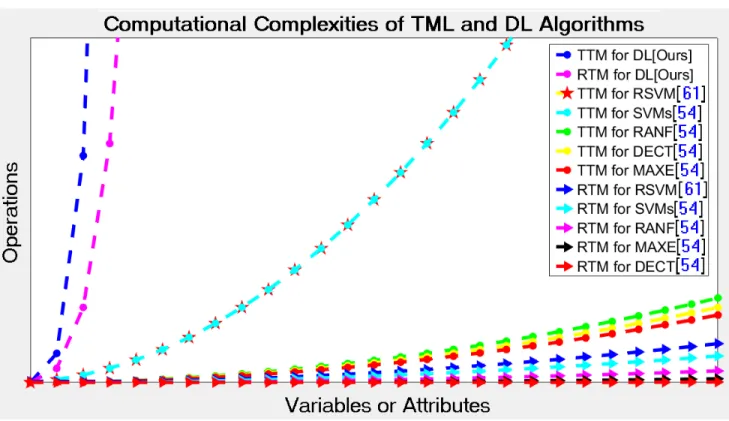
Although the training-time (TTM) and RTM complexities of TML algorithms are significantly lower than those of the DL algorithms (see Fig.4), our applied DL algorithms have achieved state-of-the-art performance (see Figs. 5 and 6). This is due to the fact that our proposed augmentation tech-niques have improved the accuracy on the stemmed data that potential improvement reflects on the performance of the DL algorithms. Consequently, the performance of the DL algorithms yields better than that of the TML algorithms. The obtained results of the DL algorithms have been compared with the existing results of TML algorithms on the identical datasets. On the same ground, the DL algorithms outper-formed the TML algorithms with a significant difference. As a matter of fact, stemming minimizes the information picked up from the Turkish data [48] and the TML algorithms are trained directly on the reduced data. Henceforth, the per-formance of TML algorithms is negatively affected by the stemmed data.
The rest of the paper is organized as follows: SectionII highlights the influential work carried out on sentiment analy-sis of the Turkish Twitter text; SectionIIIexplains how tweets are harvested from Twitter, the pre-processing operations is
applied to convert the data into a usable format, and the stemming operations applied to find the stems (root word) of the tweets. SectionIVintroduce the proposed data aug-mentation techniques along with the DL models (RNN, CNN, and HAN) used in this research. The section also presents the performance evaluation metrics used as well as the time-space complexities of numerous algorithms accompa-nying their corresponding simulated results; SectionVshows experimental results, comparison, and discussion; SectionVI presents results from statistical tests and discussion; and finally, Section VII concludes the paper and hints future studies.
II. LITERATURE REVIEW
Much research had been carried out to analyze the sentiment of tweets from English data. However, only a limited number of studies have been carried out to analyze the sentiment of tweets in other languages (e.g., the Turkish). Table5presents a summary of recent works carried out on sentiment analysis of Turkish texts in recent years.
A detailed explanation of few of the influential works carried out to analyze the sentiment of Turkish texts are highlighted in this section. The existing works can roughly be categorized into two groups: (i) Sentiment analysis of Turkish texts, and (ii) Sentiment analysis of the stemmed Turkish data.
A. RATING THE TURKISH TEXTS
Kaya et al. [65] studied sentiment in the Turkish political news. They used articles from different news sites to con-struct a dataset consisting of political news. They used a dataset that was constructed with a machine learning-based approach. Besides, that dataset was domain-dependent as it
only consist of data from the political domain. It was found in their studies that the MAXE and N-Grams language model outperformed SVMs and NB. All the approaches used in their study achieved accuracy between the range of 65% to 77%. Nevertheless, their study was rather a domain-specific. As such, it is unclear if the same or similar accuracy will be achieved if the study would be performed on a different domain.
A year following that, the same group [58] performed another research on the same domain, where they determined the sentiment classification of the Turkish sentiment columns. They applied transfer learning from an unlabelled Twitter to labeled political columns to enhance the performance of their methods. Their key aim was to determine whether the whole document was positive or negative regardless of its subject. Different techniques (e.g., SVMs, NB, and N-Grams) were used as machine learning classifiers in their study, which added up to 26% further accuracy. As an extra factor, questions remain as to whether the achieved accuracy will remain the same if each sentence in a document is considered separately. In a different direction, Kirelli et al. [11] per-formed sentiment analysis of shared Turkish tweets on global warming and climate change with data mining methods.
Önder et al. [59] performed sentiment analysis to ana-lyze the customer satisfaction of a particular transportation company. The analysis was performed with the tweets of the company’s customers found on the Twitter. Their study was performed in binary method to determine whether the tweet was positive or negative. Initially, 20000 data were harvested from the Twitter to perform the analysis. But only 14777 tweets remained after a pre-processing operation was performed to remove the un-useful tweets. Different methods (e.g., SVMs, NB, Multinomial NB, and k-Nearest Neighbor) were used to determine the performance of the analysis, out of which the Multinomial NB algorithm produced the best accuracy result with an ACC of 66.06%. In normal circum-stances, high precision and high ACC are expected from the algorithms [28]. Nonetheless, considering that the analysis was performed to classify the data to be either positive or negative, the achieved accuracy was not very encouraging since even the random guessing has a chance of achieving a 50% ACC.
TML methods have been used to analyze sentiment [58], [59], [65] of Turkish Twitter data. However, using the TML algorithms to analyze sentiment from tweets require explicit feature engineering as these algorithms cannot extract fea-tures on their own. This is anticipated to increase the work-load required to implement these algorithms. In this paper, we aimed to address this problem by using the three different DL models to analyze the sentiment of stemmed Turkish Twitter data.
B. RATING THE STEMMED TURKISH DATA
Several research to analyze sentiment from Turkish texts have been carried out specifically on stemmed data [63], [66], [54], [62].
Vural et al. [63] presented a framework for unsuper-vised sentiment analysis in the Turkish text documents. The study customized sentiment analysis library called the Sen-tiStrength for the English to the Turkish by translating its polarity lexicon. The SentiStrength [67] is a sentiment anal-ysis library that assigns a positive and a negative score to English text. The polarity was then assigned to each sen-tence after segmenting the text to sensen-tences by translating the polarity lexicon from English to Turkish. Zemberek [68] library was used for pre-processing to perform an operation including spell checking, negation extraction, and ASCII (American Standard Code for Information Interchange) to the Turkish conversion. The library was also used to convert the data to stemmed data before applying the polarity lexicon method for analyzing the positive and negative polarity of the data with an ACC of 76%. They also assigned the polarity of an English dictionary directly to the translated Turkish words. Nonetheless, the polarity of a translated word from one language might not align with the polarity of the word in the original language. As such, questions remain as to whether the result obtained using this dictionary would yield a similar result, assuming the polarity was assigned based on the Turkish language, independent of the original language.
Tocoglu et al. [66] gathered data from individuals to form a new dataset. The gathered dataset was divided into two, form-ing two datasets namely raw dataset and validated dataset. Furthermore, two different stemming methods, the fixed pre-fix stemming (FPS) [69], which was proven to give bet-ter accuracy afbet-ter the fifth characbet-ter, and Zemberek or the dictionary-based Turkish stemmer [68] were applied to each dataset to make a total of four different datasets. Several TML algorithms including NB, DECT, RANF, and updated SVMs were used to analyze the sentiment of the gathered datasets. It was concluded that the SVMs classifier yielded a higher accuracy result. It was also found that the model trained with a validated dataset gave a higher result than the model trained with a nonvalidated dataset. This study set a sub-standard for other researchers by comparing the two stemming methods developed for the Turkish language.
In our previous study [54], [62], we analyzed the sentiment of Turkish Twitter data on different datasets. We harvested data from Twitter and applied pre-processing operations (e.g., removal of punctuations and special characters to clean the data). The data were converted to a stemmed data by chopping off the end of the data to produce their root words. Subsequently, four different TML algorithms namely DECT, RANF, MAXE, and SVMs were employed. A dictionary of 6800 was also manually translated from the English to the Turkish to be used as a method of polarity lexicon. While the ACC of the method obtained using polarity lexicon increased from 48.2% if the used data were in raw form to 57% after stemming had been applied, the accuracy of the TML algorithms (e.g., RANF, MAXE, and DECT) had all been decreased.
Research to analyze sentiment from Turkish texts has been carried out on stemmed data [54], [62], [63], [66]. While
FIGURE 1. The word cloud of (a), (b), and (c) represents the first dataset, whereas the word cloud of (d), (e), and (f) indicates the second dataset [54].
converting the data to stemmed data yielded a positive result in case of the polarity lexicon method to analyze sentiment. The achieved accuracy on the stemmed data was relatively less as compared to when the data were in their raw or a tokenized form. Anecdotally, this had occurred due to the fewer data available in the tweets after the data had been stemmed. Besides, many classifiers (typically deep models) give a better classification accuracy as more data become available. In this study, we aim to address the issue of having fewer data in tweets by proposing three data augmentation techniques (e.g., Shuffle, Shift, and Hybrid) to increase the number of training data available in tweets. As the augmen-tation technique increase the diversity of stemmed data, it is anticipated that this will lead to an increase in the accuracy achieved by the DL model.
III. DATA COLLECTION TECHNIQUES A. HARDWARE SPECIFICATION
An 8GB Graphical Processing Unit (GPU) device GeForce RTX 2080ti with Compute Unified Device Architec-ture (CUDA) version 10.2 has been employed in this research.
B. DATASET
The Turkish tweets are harvested from the Twitter using the Twitter searched API (Application Program Interface) implemented in R version 3.4.3. Below is an example of raw tweets harvested from Twitter.
1) ‘‘username: @Twitteruser: SADECE BÜYÜK
ACILAR ÇEKENLER #merhamet IN ANLAMINI BILIRLER. . . VATANA BAYRAGA MILLETE HAIN-LIK YAPANLARA’’
2) ‘‘USERNAME: @Twitteruser: Bizim insanimiz mer-hamet sahibidir, Hayirli Haftalar #anladimki #BuYaz #kafes #Merhamet #ramazan #Canli https://t.co/ CGZ. . . ’’
Two different datasets1 were harvested and manually labelled. A dataset that consists of 3000 data with equal distribution from each class (1000 of positive, negative, and neutral tweets), which we refer to as the first dataset and a dataset with 10500 data with equal distribution from each class (3500 of positive, negative, and neutral tweets), that we refer to as the second dataset. To test the generalizability of the proposed method, we performed all analyses on both
1The datasets are available on request for academic use (Email: [email protected]). Researchers wanting to use the dataset will have to agree with the terms that they will cite our work.
datasets. The word cloud present in Fig.1 provides a sum-mary of the harvested tweets [54].
C. DATASET MODIFICATION
Since certain tweets directly harvested from the Twitter are not in a usable format, various pre-processing methods such as removal of punctuation marks, user identification (Id), and tweet Id, and so on have been applied to clean the tweets. Retweeted tweets and stopwords or the commonly used words have also been removed from the tweets as part of the pre-processing methods. Furthermore, words have been converted to lower case and tokenization has been applied to convert tweets into tokens. The two sentences in the below subsectionIII-Bshow an example of how tweets are transformed after the aforementioned operations have been applied.
1) ‘‘sadece, büyük, acilar, çekenler, #merhamet, in, anlamini, bilirler, vatana, bayraga, millete, hainlik, yapanlara’’
2) ‘‘insanimiz, merhamet, sahibidir,, hayirli, haftalar, #anladimki, #buyaz, #kafes, #merhamet, #ramazan, #canli’’
A notable change here is that the words have all been converted to lower cases and tokenized. Another important change is the absence of stopwords like ‘‘bizim’’ in the sec-ond part of sectionIII-B which is removed here. The pro-duced information obtained after these operations are called the stopword data. Finally, we find the stem i.e., the root form of the data by chopping the end of words in the tweets. Below is an example of the stemmed data.
1) sadece sade sade ek ek merhamet in in bil vat an millet mil mil hain hain yap
2) insani merhamet sahip sahip hafta hafta hafta haf kafes merhamet ramazan
As was pointed out in the introduction, this study will focus on improving the accuracy of stemmed data. Therefore, having discussed how the data is transformed, the next sub-section (III-D) provides more information on the stemming process.
D. STEMMING PROCESS
The stemming is a heuristic process that chops off the end of words. Stemming algorithms have been studied in computer science since the 1960s. The stemming algorithms are typi-cally rule-based. They often include the removal of deriva-tional affixes. For example, a stemming algorithm would reduce the words fishing, fished, and fisher to the stem fish.
FIGURE 2. Examples of shift, shuffle, and hybrid augmentation techniques applied to the data.
TABLE 6. Example of stemming on Turkish text.
TABLE 7. Example of words with more than one stem.
In this paper, the stemming process is performed with the help of Zemberek [68], which is an open-source natural language processing (NLP) library developed for the Turkic languages. TABLE6shows an example of the Turkish words and how they are changed after stemming has been applied. However, since certain words might have more than one stem, the stemming operation is performed to include all possible stems of a word. An example of words with more than one stem is presented in TABLE7. Moreover, the stem of a word might be written more than once based on the plurality of the word and depending on how it is used in a context. For instance, the stem of certain words ending with the suffix ‘‘ler’’, which indicates plural in the Turkish are written three times; whereas the stem of words ending with the suffix ‘‘luk’’ or ‘‘lik’’ are written two times. This is due to the emphasis of the plural in ‘‘ler’’ is more as compared to ‘‘luk’’ and ‘‘lik’’. Few examples of words, which are written more than once have been provided on TABLE8.
TABLE 8. Example of words that are rewritten more than once.
IV. OUR METHODS
The DL models are computationally intensive and training samples need heavy computations due to their large number of layers. Moreover, training these models requires a lot of training data. Conversely, we also know that stemming
minimizes the size of data needed to train/evaluate models, however, augmentation techniques might help overcome the problem by artificially expanding the size of the training data through creating modified versions of texts in the datasets.
A. PROPOSED DATA AUGMENTATION TECHNIQUES
The data augmentation technique is closely related to over-sampling in data analysis. It is performed with the aim of increasing the size of the data used for training so as to increase the diversity of the data available for training. It acts as a regularizer. It helps reduce overfitting when training a machine learning model [70]. While the data augmentation technique is a commonly used method when training image data, there are only a limited number of studies carried out on data augmentation on textual data. Therefore, in this paper, we aim to develop a similar method used for augmenting training data in images on textual data to analyze its effect on the accuracy of deep models.
As collecting more data is a tedious and expensive process, we try to make data more diverse by using data augmentation techniques. Each time a sample is processed by the model, it is presented in a slightly different way. This is beneficial as it will make it harder for the model to learn all the parameters of the training samples, which in turn prevents the model from overfitting. Here, we have proposed three different data augmentation techniques to improve the diversity of the data. Fig. 2 illustrates examples of shift, shuffling, and hybrid augmentation techniques.
1) Shift Technique ⇒ The width_shift and height_shift augmentation method in images is using a threshold value to extend the width and height of a particular image as an augmentation technique. Similar to the width_shift and height_shift augmentation method in images, this method used a copy of the first and last word of a sentence and add it to the beginning and the end of the same sentence to produce a new sentence in the same class. Fig.2(a) shows an example of a sen-tence generated by the shift augmentation technique. 2) Shuffle Technique ⇒ Similar to crossover [71],
the shuffle technique swaps and concatenates words of the same sentence to produce a new sentence of the same class. Fig.2(b) exhibits an example of a sentence generated by the shuffle augmentation technique. 3) Hybrid Technique ⇒ The hybrid data
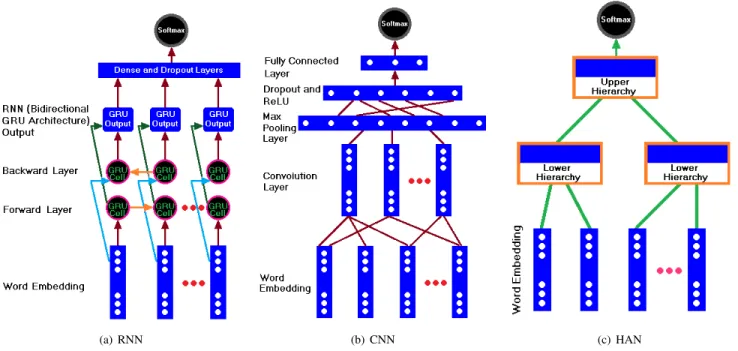
FIGURE 3. Architecture of our used DL models.
approaches to produce a new word that is added to the original training data. The aim is to analyze the impact the two proposed methods combine together, will have on the accuracy of the deep models. Fig.2(c) demonstrates an example of a sentence generated by the hybrid augmentation technique.
B. OUR PUT IN DL MODELS
Akin to how an infant learns to recognise objects, the DL models needs to be trained with a huge amount of data to be able to generalize on data it has never-seen before. These models are based on neural networks. They take input, which are then processed in hidden layers manipulating weights. The weights are updated during training process. Subse-quently, the model expectorates a prediction. The weights are adapted to detect patterns for making better predictions.
In this research, three different types of neural networks that forms the basis for most pre-trained models namely; the RNN, the CNN, and the HAN are used. Fig.3depicts the DL models used.
In all the experiments conducted with these three DL mod-els, the dataset was split in to two such that 90% of the data was used for training and 10% was used for testing. The training set was further divided into two using 90-10 split and the 10% was used as the validation set to evaluate the performance of the models. Due to the stochastic nature of processes, all experiments were run 30 times and the results provided are an average of the 30 runs.
1) RNN ARCHITECTURE
The RNN architecture is a type of DL algorithm that processes variable sequence of inputs using their internal
states [72]. It allows a dynamic behavior derived from a feed-forward neural network, which allows them to be applicable in miscellaneous tasks including speech [73], handwriting recognition [74], tumour detection with classification [75], network traffic analysis [76]–[78], text classification [79]–[82], and sentiment analysis [83]–[89].
In this paper, we aim to use the RNN model because its outputs are not only influenced by the weights but also by a hidden state vector representing the context on prior inputs. This is beneficial as it helps the network remember things learned from prior input, which might increase the accuracy of the model. Besides, its learning of high prevalent content [90], [91] and its proven performance [92], [93] made us more inclined to its use for our current sentiment analysis problem.
Fig. 3(a) demonstrates the RNN architecture from the cell package used in this paper. The model is set up to run with bidirectional gated recurrent units (Bidirectional GRU) as the type of the RNN architecture, number of hidden GRU cells (an RNN unit) of 200, an attention context or the size of hidden layer in the attention mechanism is set to 300, and a dropout rate of 0.5. The model uses Adam [94] optimizer with an initial learning rate of 0.0002 and the exponential decay rate for the first and second momentum estimates were set to 0.900 and 0.999 respectively. Finally, the softmax function is used at the last layer to perform the classification task.
2) CNN ARCHITECTURE
The CNN architecture is a type of DL network that takes an input and assigns an importance learnable weights to various aspects of the input. Conventionally, these inputs are the stemmed tweets. The CNN model has frequently been used
to perform text classification [95]–[100], as well as sentiment analysis task [89], [101]–[104].
In this research, we aim to use the CNN model because it requires less pre-processing operation as compared to other classification algorithms. Besides, it has the capacity to per-form end-to-end learning.
The CNN architecture used in this paper is shown in Fig. 3(b). The CNN architecture is designed to have three layers of 100 channels (with window sizes of 3, 4, and 5 words) and a stride of one word. All words in a tweets are first embedded before they are fed to the CNN, where impor-tant features are extracted. Extracted features are passed to the activation layer followed by a dropout rate of 0.10. The resulting output is passed as an input to the fully connected layer which outputs logits that are finally classified by the softmax function.
3) HAN ARCHITECTURE
The HAN architecture is a type of DL model that considers the hierarchical structure of sentences or words. It scruti-nizes the hierarchical structure of documents (e.g., document, sentences, and words) for text classification [105]–[107] or sentiment analysis [108]–[114]. It includes an attention mechanism that is able to find the key words and sentences in a document.
The HAN architecture used in this paper is shown in Fig. 3(c). It comprises of two hierarchies - a lower hierar-chy and an upper hierarhierar-chy. The lower hierarhierar-chy takes a single sentence and then it breaks down into words embedding. Finally, it outputs weighted sentence embedding relevant to the classification task. Conversely, the upper hierarchy takes one document (tweet) and then breaks it down into sentence embedding. Ultimately, it outputs document embedding rele-vant to the classification task. A dropout rate of 0.10 is applied to the final output from the upper hierarchy before passing the output to the softmax function to perform the classification task.
The HAN model has been chosen to be used in this research because it includes an attention mechanism that finds the most important words in a sentence while taking a particular context into consideration. It returns the predominant weights resulting from previous words.
C. PERFORMANCE EVALUATION METRICS
Performance evaluation of any machine learning algorithm is an essential part. An algorithm may give a satisfying results when evaluated using a metric (e.g., ACC), but it may give poor results when evaluated against other metrics (e.g., F1S). Usually, the classification accuracy is used to measure the performance of machine learning algorithms. However, using only the classification accuracy is not enough to evaluate the performance of the model.
To truly judge any machine learning algorithm, different types of evaluation metrics such as ACC, AUC, F1S, and RTM can be used.
The ACC can be calculated using Eq.1as: ACC = tn+ tp
tp+ tn+ fp+ fn
(1) where (tn) represents true negative, (tp) represents true positive,(fp) represents false positive, and (fn) represents false negative.
Sometimes, the word accuracy (ACC) is used interchange-ably with percent correct classification (PCC).
The AUC is one of the most widely used metrics for eval-uation [28]. The AUC of a classifier equals to the probability that the classifier ranks a randomly chosen positive sample higher than a randomly chosen negative sample. The AUC has a ranges of 0 to 1. If the predictions of a model are 100% wrong, then its AUC = 0.00; conversely, if the predictions are 100% correct then its AUC = 1.00.
The F1S is the harmonic mean between precision and recall. It is also called the F-score or F-measure. It is used in machine learning [115]. It conveys the balance between precision and recall. It also tells us how many instances are classified correctly. The highest possible value i.e. 1 indicates perfect precision and recall. However, the lowest possible value i.e. 0 implies that the precision or the recall is zero.
The F1S can be calculated using the following formula:
F1S = 2 1 precision+ 1 recall = tp tp+fp+fn 2 (2) where precision is the number of correct positive results divided by the number of positive results predicted with the classifier, and recall is the number of correct positive results divided by the number of all relevant samples.
Estimating the RTM complexity of algorithms is manda-tory for many applications (e.g., embedded real-time sys-tems [116]). The optimization of the RTM complexity of an algorithm in an application is highly expected [117]–[119]. The total RTM can prove to be one of the most important determinative performance factors in many software-intensive systems.
D. TIME-SPACE COMPLEXITIES OF ALGORITHMS
The time complexity describes the amount of computer time it takes to run an algorithm. It is not equal to the actual time required to execute an algorithm. The space complexity, like the time complexity, is often expressed as a function of the input size. It specifies the amount of memory needed dur-ing the execution of an algorithm. TABLE9compares time and space complexities required by the numerous models to predict their outputs. The complexity of the RANF [54] algorithm increases with the number of DECTs. If there exist a huge number of data with many features, multi-core processing can be used for parallelizing the RANF [54] to train different DECTs. During training, each stand learner can be trained on the dissimilar core of the computer. The theoretical complexities suggest that when we have large data with low dimensionality, the DECT [54] can be used. The MAXE [54] model suits the best for applications (e.g., [120]),
TABLE 9. Theoretical time and space complexity of various algorithms considering d dimensional training data having n points; The symbols h, m, r , and v indicate the maximum depth of tree, the number of decision trees, the number of nodes in tree, and the number of support vectors, respectively.
where the dimension of the data is small. It is like a logistic regression, which is very suitable for low latency applica-tions. The runtime and space complexities of SVMs [54] are linear with respect to v.
Each layer of the neural networks, a matrix multiplication and an activation (element-wise) function are computed. If a matrix multiplication has an asymptotic runtime of O(n3), an element-wise function has a runtime of O(n), the num-ber of performed multiplications is counted as n, and the element-wise function are applied n times; then the total runtime becomes O(n(n3 + n)), i.e., we can estimate the approximate runtime complexity of O(n4) for either RNN or CNN or HAN. If there are n layers each with n neurons and n number of iterations (epochs), we would estimate the approximate TTM complexity of O(n5) for either RNN or CNN or HAN. But these theoretical complexities do not have significant effect on real world applications, if paral-lel processing (e.g., a GPU) is used for running the matrix multiplication. Merrill et al. [121] described a useful range between narrow upper and lower bounds of the space com-plexities for various models of neural networks. The space complexity of RNN, CNN, and HAN is O(1) [121]. The DL algorithms (e.g., RNN) can use hidden layer as memory store to learn sequences. This also helps the DL algorithms to capture semantics of text better than TML algorithms. Normally, if any TML algorithm loads too much data into the working memory of a computer, the TML code cannot run successfully.
E. SIMULATED COMPUTATIONAL COMPLEXITIES
In statistics, dimensionality refers to the number of attributes in a dataset. One column may indicate each dimension in a real world data representation (e.g., spreadsheet). A mini-mum of two support vectors are required for each decision hyperplane in the model. Henceforth, the lowest v = 2, irrespective of the number of dimensions or size of a dataset. To make a good balance between AUC and processing time, any RANF should have a number of trees between 26 = 64 and 27 = 128 trees [122]. The DECT [54] considers all features (or variables) of an entire dataset, whereas the RANF [54] randomly considers observations (or rows) along with defined features (or variables) to make multiple deci-sion trees and ends up with the averages results. In brief,
the RANF [54] combines the output of multiple randomly created DECTs to make the final output. As a result, computa-tional complexity of the RANF [54] is higher than that of the DECT [54]. The computational complexity of the SVMs [54] is much higher than that of the RANF [54]. This is due to the fact that to train any SVM takes longer than to train any RANF if the size of the training data goes higher. Fig. 4 depicts the simulated computational complexities of several TML and DL algorithms. These simulated results support our initial assumption related to the computational costs of DL models.
V. EXPERIMENTAL RESULTS AND DISCUSSION A. IMPROVEMENT BY AUGMENTATION TECHNIQUES
TABLE10demonstrates the result obtained by the RNN on the first and second datasets before and after the different aug-mentation techniques were applied to the data. In TABLE10, Original represents accuracy obtained from the originally stemmed data; Shift indicates accuracy obtained from the stemmed data after the width and height shift was applied as data augmentation methods; Shuffled shows accuracy got after shuffling was applied as data augmentation method; and finally, hybrid acts for accuracy obtained after the width and height shift, as well as, shuffling augmentation method was applied to the data. Due to the stochastic nature of processes and non-deterministic nature of the RNN, all experiments were run 30 times. The results in TABLE10are the average of the 30 runs with upper and lower bounds of a 95% confidence interval.
TABLE 10.Accuracy obtained by RNN on the first and second datasets. The * indicates the accuracy obtained from the best model after 30 runs.
Upon looking at the achieved accuracy on the first dataset, the data augmentation method improved the achieved accu-racy by the RNN model in all three cases, when shift, shuf-fle, and hybrid augmentation techniques had been applied. In statistics, a one-way ANalysis Of VAriance (abbreviated as one-way ANOVA) is a technique that can be used to compare means of two or more samples. The one-way ANOVA was conducted to compare the effect of the different methods used on the achieved accuracy. It was found that the used method-ologies have a significant effect on the classification accuracy for the four conditions [F(3, 116)] = 8.731, p < 0.001. Post-hoc comparison of two-sample unpaired t-test with Bon-ferroni [123] correction between three (t(58) = 14.0813, p< 0.001(Shift), t(58) = 5.7440, p< 0.001 (Shuffle), and t(58) = 5.2925, p< 0.001 (Hybrid)) different groups at the level of significance α = 0.017 comparing accuracy obtained by each augmentation method to the accuracy achieved on the original data (with no augmentation) on the first dataset all showed that there was a significant difference (Original M = 69.2, Shift M = 74.5, Shuffle M = 71.5, Hybrid M = 71.8).
FIGURE 4. Training-time (TTM) and runtime (RTM) complexities of various TML and DL algorithms.
TABLE 11. Runtime (RTM) in seconds and other performance factors obtained by various algorithms on the same datasets.
In contrast to the accuracy achieved on the first dataset in which the augmentation method increased the accu-racy achieved in the three cases, the augmentation method increased the achieved accuracy on two of the three cases on the second dataset. A two-sample unpaired t-test [124] with Bonferroni [123] correction was conducted to test the signifi-cance of the achieved accuracy on the two cases (Shuffle and Hybrid) that outperformed the accuracy achieved from the original data on the second dataset. However, only t(58) = 3.5165, p < 0.0009 (Hybrid) was found to be significant (Original M = 87.5, Hybrid M = 88.8) whereas (t(58) = 2.0188, p< 0.0481 (Shuffle) showed that there was no sig-nificant difference (Original M = 87.5, Shuffle M = 88.1).
B. MISCELLANEOUS METHODS
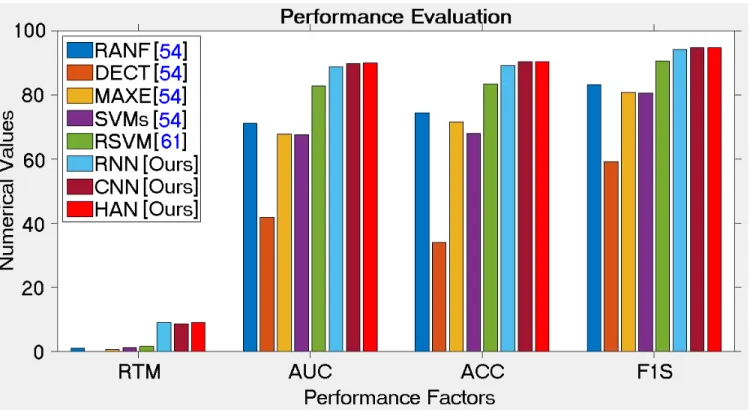
TABLE 11 and its associated Fig. 5 demonstrate the per-formance factors of RTM in seconds, AUC, 1-AUC, ACC, 1-ACC, F1S and 1-F1S for the algorithms of RANF [54], DECT [54], MAXE [54], SVMs [54], RSVM [61], RNN
[Ours], CNN [Ours], and HAN [Ours] using identical datasets.
The experimental results demonstrated in TABLE11will doubtless be much scrutinized, but there are some immedi-ately dependable conclusions for the achieved results. It can be seen from TABLE11, the values of RTM obtained by the TML algorithms of RANF [54], DECT [54], MAXE [54], SVMs [54], and RSVM [61] are extremely lesser than those of RNN [Ours], CNN [Ours], and HAN [Ours]. Conversely, the achieved values of the performance factors for AUC, ACC, and F1S obtained by the DL algorithms of RNN [Ours], CNN [Ours], and HAN [Ours] is much higher than those of the TML algorithms of RANF [54], DECT [54], MAXE [54], SVMs [54], and RSVM [61]. The TML algorithms required on the average 3.20 seconds, whereas the DL algorithms needed on the average 8016 seconds. This implies that the TML algorithms are 8016/3.20= 2504 times faster than the DL algorithms. Like the simulation results in Fig. 4, the practical results of RTM in Fig.5also support our initial
FIGURE 5. Plotting of RTM, AUC, ACC, and F1S data from TABLE11; where RTM exhibits in logarithmic scale but others are in 100 scale.
computational costs assumption of the DL models. The TML algorithms showed the average performance of AUC = 66.26%, ACC = 0.6624, and F1S = 0.7954, whereas the DL algorithms showed the average performance of AUC =89.50%, ACC = 0.8996, and F1S = 0.9446. This implies that on the average the DL algorithms can obtain (89.50/66.26)-1=35.07% for AUC, (0.8996/0.6624)-1=35.81% for ACC, and (0.9446/0.7954)-1=18.76% for F1S better performance as compared to the TML algorithms. In brief, the DL algorithms are highly recommended to use in applications where accuracy is more important than the RTM of the algorithm. Otherwise, the TML algorithms will provide quick results for analyzing sentiments in an online manner.
VI. RESULTS FROM STATISTICAL TESTS
Normally, multiple comparisons with a control algorithm are applied to statistically present that the performance of one algorithm is better than that of its alternatives in areas related to computer science [71], [125]. The main reason of applying the non-parametric tests [126] is that they do not make any assumption regarding the underlying distribution of the data.
A. MULTIPLE COMPARISON WITH STATISTICAL TESTS
We have considered data of RTM in second, 1-AUC, 1-ACC, and 1-F1S from TABLE11as input parameters for conducting tests for multiple comparisons along with a set of post-hoc procedures to compare a control algorithm with others (i.e., 1 × N comparisons) and to perform all possible
pairwise comparisons (i.e., N × N comparisons). For these purposes, we have used the open source statistical software applications from University of Granada [127].
1) MISCELLANEOUS NONPARAMETRIC TESTS
In the case of 1 × N comparisons, the post-hoc proce-dures consist of Bonferroni-Dunn’s [128], Holm’s [129], Hochberg’s [130], Hommel’s [131], [132], Holland’s [133], Rom’s [134], Finner’s [135], and Li’s [136], procedures; whereas in the case of N × N comparisons, they make up of Nemenyi’s [137], Shaffer’s [138], and Bergmann-Hommel’s [139] procedures. In the case of Bonferroni-Dunn’s procedure [128], the performance of two algorithms is considerably divergent if the corresponding mean of rankings is at least as large as its discriminating divergence. A better one is Holm’s procedure [129], which examines in a consec-utive manner all hypotheses ordered based on their p-values from inferior to superior. All hypotheses for which p-value is less thanα divided by the number of algorithms minus the number of a successive step are rejected. All hypotheses having larger p-values are upheld. Holm’s procedure [129] adjusts α in a step-down manner. In the same way, both Holland’s [133] and Finner’s [135] procedures adjust α in a step-down method. Nevertheless, the Hochberg’s proce-dure [130] works in the contrasting direction to the Hol-land’s procedure [133]. It compares the largest p-value with α, the next largest with α/2, and so on, until it encoun-ters a hypothesis it can reject. The Rom [134] proposed
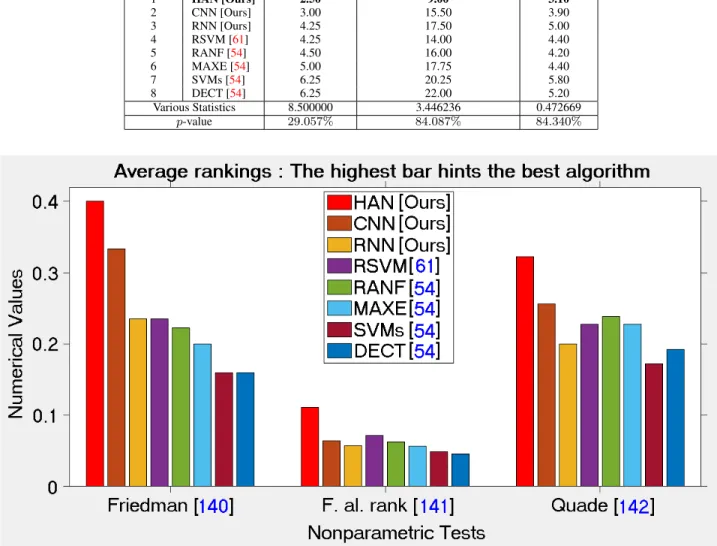
TABLE 12. Average rankings using the nonparametric statistical procedures, statistics, and p-values.
FIGURE 6.Plotting of average rankings data from TABLE12; where each value x is plotted as 1/x to visualize the highest ranking with the tallest bar.
a modification to Hochberg’s step-up procedure [130] to enhance its power. In turn, Li [136] suggested a two-step rejection procedure.
2) MULTIPLE COMPARISON NONPARAMETRIC TESTS
TABLE12exhibits the average ranking computed by using Friedman [140], Friedman’s aligned rank test [141], and Quade [142] nonparametric tests. To achieve the test results Friedman [140], Friedman’s aligned rank test [141], and Quade [142] non-parametric tests are applied to the data of RTMin seconds, 1-AUC, 1-ACC, and 1-F1S from TABLE11. The sight of applying Friedman [140], Friedman’s aligned rank test [141], and Quade [142] non-parametric tests is to realize whether there are significant differences among various algorithms considered over a given sets of data [142], [143]. These tests give ranking of the algo-rithms for each individual dataset, i.e., the best performing algorithm receives the highest rank of 1, the second best
algorithm gets the rank of 2, and so on. The mathemati-cal equations and further explanation of the non-parametric procedures of Friedman [140], Friedman’s aligned rank test [141], and Quade [142] can be found in Quade [142] and Westfall et al. [143].
Based on the obtained results in the TABLE 12, HAN [Ours] is the best performing algorithm of the comparison, with average ranking of 2.50, 9.00, and 3.10 for Friedman test [140], Friedman’s aligned rank test [141], and Quade test [142], respectively. This indicates that HAN [Ours] provides the greatest performance for sentiment analysis from the stemmed Turkish Twitter data. Friedman statistic considered reduction performance (distributed according to chi-square with 6 degrees of freedom) of 8.500000. Aligned Friedman statistic considered reduction performance (dis-tributed according to chi-square with 6 degrees of freedom) of 3.446236. Quade statistic considered reduction perfor-mance (distributed according to F-distribution with 6 and
TABLE 13. Results achieved on post-hoc comparisons for adjusted p-values,α = 0.05, and α = 0.10.
42 degrees of freedom) of 0.472669. The p-values computed through Friedman statistic, aligned Friedman statistic, and Quade statistic are 29.057%, 84.087%, and 84.340%, respec-tively. Iman and Davenport [144] statistic considering reduc-tion performance with distributed according to F-distribureduc-tion with 7 and 21 degrees of freedom is 1.200000. The p-value computed by Iman and Daveport [144] test is 34.541%. TABLE 13 demonstrates the results obtained on post-hoc comparisons of adjusted p-values,α = 0.05, and α = 0.10.
3) POST-HOC PROCEDURES FOR 1 × N COMPARISONS
In the case of 1 × N comparisons, the post-hoc proce-dures consist of Bonferroni-Dunn’s [128], Holm’s [129], Hochberg’s [130], Hommel’s [131], [132], Holland’s [133], Rom’s [134], Finner’s [135], and Li’s [136] procedures. In these statistical analysis tests, multiple comparison post-hoc procedures considered for comparing the con-trol algorithm HAN [Ours] with the other algorithms. The results are shown by computing p-values for each compar-ison. TABLE 14depicts obtained p-values using the ranks computed by the Friedman [140], Friedman’s aligned rank test [141], and Quade [142] non-parametric tests, respec-tively. Based on the computed results, all tests show signif-icant improvements of HAN [Ours] over CNN [Ours], RNN [Ours], RSVM [61], RANF [54], MAXE [54], SVMs [54], and DECT [54] for all the post-hoc procedures considered. Besides this, the Li’s [136] procedure does the greatest per-formance, reaching the lowest p-values in the comparisons.
4) POST-HOC PROCEDURES FOR N × N COMPARISONS
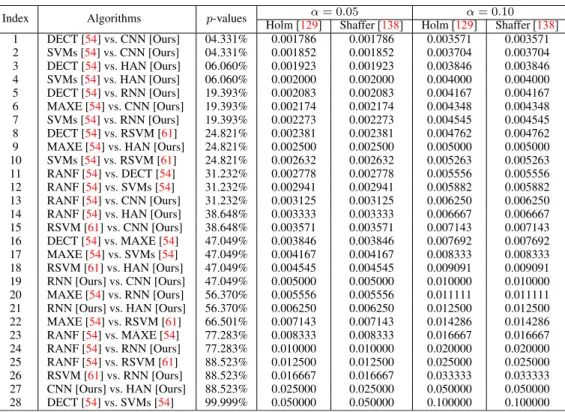
In the case of N × N comparisons, the post-hoc proce-dures consist of Nemenyi’s [137], Shaffer’s [138], as well as Bergmann-Hommel’s [139] procedures. TABLE15presents 28 hypotheses of equality among the 6 different algorithms and the p-values achieved. Using level of significanceα = 0.05, Nemenyi’s [137] procedure rejects those hypotheses that have an unadjusted p-value ≤ 0.179%. Holm’s [129] procedure rejects those hypotheses that have an unadjusted p-value ≤ 0.179% for α = 0.05. Bergmann’s [139] proce-dure does not reject any hypotheses forα = 0.05. Using level of significanceα = 0.10, Nemenyi’s [137] procedure rejects those hypotheses that have an unadjusted p-value ≤ 0.357%. Holm’s [129] procedure rejects those hypotheses that have an unadjusted p-value ≤ 0.357% for α = 0.10. Bergmann’s [139] procedure does not reject any hypotheses forα = 0.10. During the post-hoc methods over the results of Quade [142] procedure, Bonferroni-Dunn’s [128] procedure rejects those hypotheses that have an unadjusted p-value ≤ 0.714%; Holm’s [129] procedure rejects those hypothe-ses that have an unadjusted p-value ≤ 0.714%; Hommel’s [131], [132] procedure rejects those hypotheses that have an unadjusted p-value ≤ 0.714%; Holland’s [133] procedure rejects those hypotheses that have an unadjusted p-value ≤ 0.730%; Finner’s [135] procedure rejects those hypotheses that have an unadjusted p-value ≤ 0.730%; and Li’s [136] procedure rejects those hypotheses that have an unadjusted p-value ≤0.939%.
TABLE 14. Adjusted p-values for various tests considering HAN [Ours] as control method.
TABLE 15. Adjusted p-values for tests for multiple comparisons among all methods.
In sum and substance, based on the aforementioned exper-imental and statistical test results, it would be easy to make an explicit conclusion that the HAN [Ours] outperforms over CNN [Ours], RNN [Ours], RSVM [61], RANF [54], MAXE [54], SVMs [54], and DECT [54]. Intuitively speak-ing, it is observed that the performance of HAN [Ours] surpasses those of other alternative algorithms for solving deep sentiment analysis problems especially on the stemmed Turkish Twitter data.
5) OUR FINDINGS
Ahead of this study, the evidence that the DL algorithms will perform better than the TML algorithms those used in our previous study was purely anecdotal. However, after a comprehensive investigation that was made on this study, we found that the mean performance of our used DL algo-rithms (e.g., RNN, CNN, and HAN) outperformed than that of the TML algorithms. One reason behind this fact includes that the DL algorithms are powerful feature extractors and
learning tool as they extract and learn features that are increasingly complicated and detailed. Another reason could be due to their ability to find patterns input data and their nonlinear combination of the extracted features to predict the output. The TML algorithms solely perform feature learning during training, whereas the DL algorithms take a longer time to train usually because of their large number of lay-ers. Although the RTM of TML algorithms is almost zero as compared to the DL algorithms, the performance of the former algorithms is significantly lower than that of the later algorithms. In effect, the performance of TML models has been degraded by the stemmed data, whereas a higher perfor-mance of DL models has been dignified by the augmentation techniques. The optimized RTM is a desirable factor for any algorithm. Nevertheless, the effectiveness is a great factor than the RTM of an algorithm in many real world applications. The HAN [Ours] became the best performative algorithm among our underlaid both TML and DL algorithms. In senti-ment analysis, generally, not all words are equally important as some words characterize a sentence more than others. One possible reason why the HAN [Ours] performs better than other networks could be hinted the fact that its utilization of the sentence vector such that more attention is given to ‘‘important’’ words. In contrast to the other neural network models (e.g., CNN [Ours] and RNN [Ours]), the HAN [Ours] does not only performs end-to-end learning, but also it learns the meaning behind the sequence of words as well as it returns vector corresponding to each word. In other words, it calculates the weighted sum of each vector.
VII. CONCLUSION
We proposed three data augmentation techniques to increase the diversity of the training data, and then used three DL algo-rithms (e.g., RNN, CNN, and HAN) for sentiment analysis of the stemmed Turkish textual data obtained from the Twitter. The obtained results of these algorithms had been compared with the TML algorithms (e.g., RSVM [61], RANF [54], MAXE [54], SVMs [54], and DECT [54]). Deeming simu-lation (e.g., Fig.4), experimental (e.g., Fig.5), and statistical (e.g., Fig.6) results on the identical stemmed Turkish Twitter datasets, it had been supported that: (i) In case of both TTM and RTM complexities of the algorithms, the TML algorithms outperformed the DL algorithms (see Fig. 4); (ii) In case of cardinal performance factors (e.g., AUC, ACC, and F1S), the DL algorithms outperformed the TML algorithms (see Fig.5); and (iii) On the average performance rankings, the DL algorithms empowered by the augmentation techniques work as powerful feature extractors, and henceforth, they took the topmost rankings as compared to the TML algorithms (see Fig.6).
The DL algorithms possess high computational cost, but they capture semantics of text better than the TML algo-rithms. Prior to this study, the evidence of the accuracy of the TML algorithms is reduced due to inadequate information available in the data was purely anecdotal. But our simulation, experimental, and statistical detailed study in this paper has
given us the idea that the application of the augmentation method on the stemmed Turkish textual data might lead to a significant increase in the achieved performance by DL model. To the best of our knowledge, this is the first research to apply the data augmentation technique to the stemmed Turkish textual data. Although the DL algorithms used have resulted a significantly better performance as compared to our previously proposed TML algorithms on the stemmed data, the generalisability of the obtained results is subject to certain limitations. For instance, it is not known whether the proposed algorithms will achieve a higher or at least an equivalent result on the raw or the stopwords data. Therefore, further investigation is important to know the effectiveness of these algorithms on the raw and stopword data.
ACKNOWLEDGMENT
The authors would like to thank the anonymous reviewers for their appreciative and constructive comments on the draft of this article.
REFERENCES
[1] Y. Liu, X. Yu, B. Liu, and Z. Chen, ‘‘Sentence-level sentiment analysis in the presence of modalities,’’ in Proc. 15th Int. Conf. (CICLing), in Lecture Notes in Computer Science, vol. 8404, A. F. Gelbukh, Ed., Kathmandu, Nepal, 2014, pp. 1–16.
[2] H. A. Shehu, ‘‘Kutupsallık sözlüˇgü ve yapay zeka yardımı ile Türkçe Twit-ter verileri üzerinde duygu analizi,’’ M.S. thesis, Bilgisayar Mühendisliˇgi Bölümü, Fen Bilimleri Enstitusu, Pamukkale Universitesi, Denizli, Turkey, 2019.
[3] A. P. Lenton-Brym, V. A. Santiago, B. K. Fredborg, and M. M. Antony, ‘‘Associations between social anxiety, depression, and use of mobile dat-ing applications,’’ Cyberpsychol., Behav., Social Netw., vol. 24, no. 2, pp. 86–93, Feb. 2021.
[4] G. Aceto, D. Ciuonzo, A. Montieri, and A. Pescapé, ‘‘Multi-classification approaches for classifying mobile app traffic,’’ J. Netw. Comput. Appl., vol. 103, pp. 131–145, Feb. 2018.
[5] A. Razaghpanah, N. Vallina-Rodriguez, S. Sundaresan, C. Kreibich, P. Gill, M. Allman, and V. Paxson, ‘‘Haystack: In situ mobile traffic analy-sis in user space,’’ CoRR, vol. abs/1510.01419, 2015. [Online]. Available: http://arxiv.org/abs/1510.01419
[6] A. P. Jain and V. D. Katkar, ‘‘Sentiments analysis of Twitter data using data mining,’’ in Proc. Int. Conf. Inf. Process. (ICIP), Dec. 2015, pp. 807–810. [7] K. Sailunaz and R. Alhajj, ‘‘Emotion and sentiment analysis from Twitter
text,’’ J. Comput. Sci., vol. 36, Sep. 2019, Art. no. 101003.
[8] S. E. Saad and J. Yang, ‘‘Twitter sentiment analysis based on ordinal regression,’’ IEEE Access, vol. 7, pp. 163677–163685, 2019.
[9] A. Feizollah, S. Ainin, N. B. Anuar, N. A. B. Abdullah, and M. Hazim, ‘‘Halal products on Twitter: Data extraction and sentiment analysis using stack of deep learning algorithms,’’ IEEE Access, vol. 7, pp. 83354–83362, 2019.
[10] M. Bibi, W. Aziz, M. Almaraashi, I. H. Khan, M. S. A. Nadeem, and N. Habib, ‘‘A cooperative binary-clustering framework based on majority voting for Twitter sentiment analysis,’’ IEEE Access, vol. 8, pp. 68580–68592, 2020.
[11] Y. Kirelli and S. Arslankaya, ‘‘Sentiment analysis of shared tweets on global warming on Twitter with data mining methods: A case study on Turkish language,’’ Comput. Intell. Neurosci., vol. 2020, pp. 1904172:1–1904172:9, Sep. 2020.
[12] A. Kumar and A. Jaiswal, ‘‘Systematic literature review of sentiment anal-ysis on Twitter using soft computing techniques,’’ Concurrency Comput.,
Pract. Exp., vol. 32, no. 1, Jan. 2020, Art. no. e5107.
[13] F. Z. Kermani, F. Sadeghi, and E. Eslami, ‘‘Solving the Twitter sentiment analysis problem based on a machine learning-based approach,’’ Evol.
Intell., vol. 13, no. 3, pp. 381–398, 2020.
[14] U. Naseem, I. Razzak, K. Musial, and M. Imran, ‘‘Transformer based deep intelligent contextual embedding for Twitter sentiment analysis,’’ Future
[15] S. Qaiser, N. Yusoff, F. K. Ahmad, and R. Ali, ‘‘Sentiment analysis of impact of technology on employment from text on Twitter,’’ Int. J. Interact.
Mobile Technol., vol. 14, no. 7, pp. 88–103, Jul. 2020.
[16] J. R. Alharbi and W. S. Alhalabi, ‘‘Hybrid approach for sentiment analysis of Twitter posts using a dictionary-based approach and fuzzy logic meth-ods: Study case on cloud service providers,’’ Int. J. Semantic Web Inf. Syst., vol. 16, no. 1, pp. 116–145, Jan. 2020.
[17] M. Emadi and M. Rahgozar, ‘‘Twitter sentiment analysis using fuzzy inte-gral classifier fusion,’’ J. Inf. Sci., vol. 46, no. 2, pp. 226–242, Apr. 2020. [18] H. Rehioui and A. Idrissi, ‘‘New clustering algorithms for Twitter
senti-ment analysis,’’ IEEE Syst. J., vol. 14, no. 1, pp. 530–537, Mar. 2020. [19] D. Antonakaki, P. Fragopoulou, and S. Ioannidis, ‘‘A survey of Twitter
research: Data model, graph structure, sentiment analysis and attacks,’’
Expert Syst. Appl., vol. 164, Feb. 2021, Art. no. 114006.
[20] K. W. Kiprono and E. Abade, ‘‘Comparative Twitter sentiment analysis based on linear and probabilistic models,’’ Int. J. Data Sci. Technol., vol. 2, no. 4, pp. 41–45, 2016.
[21] M. Anjaria and R. M. R. Guddeti, ‘‘Influence factor based opinion mining of Twitter data using supervised learning,’’ in Proc. 6th Int. Conf. Commun.
Syst. Netw. (COMSNETS), Jan. 2014, pp. 1–8.
[22] S. Räbiger, M. Kazmi, Y. Saygın, P. Schüller, and M. Spiliopoulou, ‘‘SteM at SemEval-2016 task 4: Applying active learning to improve sentiment classification,’’ in Proc. 10th Int. Workshop Semantic Eval. (SemEval). San Diego, CA, USA: NAACL-HLT, Jun. 2016, pp. 64–70.
[23] R. B. S. Putra and E. Utami, ‘‘Non-formal affixed word stemming in Indonesian language,’’ in Proc. Int. Conf. Inf. Commun. Technol.
(ICOIACT), Mar. 2018, pp. 531–536.
[24] S. Al-Saqqa, A. Awajan, and S. Ghoul, ‘‘Stemming effects on sentiment analysis using large Arabic multi-domain resources,’’ in Proc. 6th Int.
Conf. Social Netw. Anal., Manage. Secur. (SNAMS), M. A. Alsmirat and Y. Jararweh, Eds., Granada, Spain, Oct. 2019, pp. 211–216.
[25] S. Bao and N. Togawa, ‘‘Document-level sentiment classification in japanese by stem-based segmentation with category and data-source information,’’ in Proc. IEEE 14th Int. Conf. Semantic Comput. (ICSC), San Diego, CA, USA, Feb. 2020, pp. 311–314.
[26] H. A. Almuzaini and A. M. Azmi, ‘‘Impact of stemming and word embed-ding on deep learning-based arabic text categorization,’’ IEEE Access, vol. 8, pp. 127913–127928, 2020.
[27] T. Ma, R. Al-Sabri, L. Zhang, B. Marah, and N. Al-Nabhan, ‘‘The impact of weighting schemes and stemming process on topic modeling of Arabic long and short texts,’’ ACM Trans. Asian Low-Resour. Lang. Inf. Process., vol. 19, no. 6, pp. 81:1–81:23, 2020.
[28] M. H. Sharif, ‘‘An eigenvalue approach to detect flows and events in crowd videos,’’ J. Circuits, Syst. Comput., vol. 26, no. 7, Jul. 2017, Art. no. 1750110.
[29] B. Pang and L. Lee, Opinion Mining and Sentiment Analysis. Norwell, MA, USA: Now Foundations and Trends, 2008.
[30] J. R. Ragini, P. M. R. Anand, and V. Bhaskar, ‘‘Big data analytics for disaster response and recovery through sentiment analysis,’’ Int. J. Inf.
Manage., vol. 42, pp. 13–24, Oct. 2018.
[31] A. M. Alayba, V. Palade, M. England, and R. Iqbal, ‘‘Arabic language sentiment analysis on health services,’’ in Proc. 1st Int. Workshop Arabic
Script Anal. Recognit. (ASAR), Nancy, France, Apr. 2017, pp. 114–118. [32] Y. A. Alhaj, J. Xiang, D. Zhao, M. A. A. Al-Qaness, M. A. Elaziz,
and A. Dahou, ‘‘A study of the effects of stemming strategies on arabic document classification,’’ IEEE Access, vol. 7, pp. 32664–32671, 2019. [33] L. S. Indradjaja and S. Bressan, ‘‘Automatic learning of stemming rules
for the Indonesian language,’’ in Proc. 17th Pacific Asia Conf. Lang., Inf.
Comput. (PACLIC), Singapore, D. Ji and K. Teng, Eds., 2003, pp. 62–68. [34] J. Asian, H. E. Williams, and S. M. M. Tahaghoghi, ‘‘Stemming Indonesian,’’ in Proc. 28th Australas. Comput. Sci. Conf. (ACSC), vol. 38, Newcastle, NSW, Australia, 2005, pp. 307–314.
[35] M. Tateno, H. Masuichi, and H. Umemoto, ‘‘The Japanese lexical trans-ducer based on stem-suffix style forms,’’ Natural Lang. Eng., vol. 2, no. 4, pp. 329–330, Dec. 1996.
[36] J. Savoy, ‘‘Stemming of French words based on grammatical categories,’’
J. Amer. Soc. Inf. Sci., vol. 44, no. 1, pp. 1–9, Jan. 1993.
[37] J. Savoy, ‘‘Light stemming approaches for the French, Portuguese, German and Hungarian languages,’’ in Proc. ACM Symp. Appl. Comput. (SAC), H. Haddad, Ed., Dijon, France, 2006, pp. 1031–1035.
[38] P. Majumder, M. Mitra, and K. Datta, ‘‘Statistical vs. rule-based stemming for monolingual French retrieval,’’ in Proc. 7th Workshop Cross-Lang.
Eval. Forum Eur. Lang. (CLEF), in Lecture Notes in Computer Science, vol. 4730, Alicante, Spain, 2006, pp. 107–110.
[39] W. G. Ferreira, W. A. dos Santos, B. M. P. de Souza, T. M. M. Zaidan, and W. C. Brandao, ‘‘Assessing the efficiency of suffix stripping approaches for Portuguese stemming,’’ in Proc. 22nd Int. Symp. (SPIRE), in Lecture Notes in Computer Science, vol. 9309, London, U.K., 2015, pp. 210–221. [40] M. Braschler and B. Ripplinger, ‘‘Stemming and decompounding for German text retrieval,’’ in Proc. 25th Eur. Conf. Inf. Retr. (ECIR), in Lecture Notes in Computer Science, vol. 2633, Pisa, Italy, 2003, pp. 177–192. [41] M. Braschler and B. Ripplinger, ‘‘How effective is stemming and
decompounding for German text retrieval?’’ Inf. Retr., vol. 7, nos. 3–4, pp. 291–316, Sep. 2004.
[42] A. Tordai and M. de Rijke, ‘‘Four stemmers and a funeral: Stemming in hungarian at CLEF 2005,’’ in Proc. 6th Workshop Cross-Lang. Eval. Forum
Eur. Lang. (CLEF), in Lecture Notes in Computer Science, vol. 4022, Vienna, Austria, 2005, pp. 179–186.
[43] P. Halacsy and V. Tron, ‘‘Benefits of resource-based stemming in Hungar-ian information retrieval,’’ in Proc. 7th Workshop Cross-Lang. Eval. Forum
Eur. Lang. (CLEF), in Lecture Notes in Computer Science, vol. 4730, Alicante, Spain, 2006, pp. 99–106.
[44] C. G. Figuerola, R. G. Diaz, and E. L. de San Roman, ‘‘Stemming and n-grams in Spanish: An evaluation of their impact on information retrieval,’’ J. Inf. Sci., vol. 26, no. 6, pp. 461–467, 2000.
[45] M. R. Luna, ‘‘Stemming process in Spanish words with the successor variety method. methodology and result,’’ in Proc. 4th Int. Conf. Enterprise
Inf. Syst., Ciudad Real, Spain, 2002, pp. 838–842.
[46] A. Medina-Urrea, ‘‘Towards the automatic lemmatization of 16th century Mexican Spanish: A stemming scheme for the CHEM,’’ in Proc. Int. Conf.
Comput. Linguistics Intell. Text Process. (CICLing), in Lecture Notes in Computer Science, vol. 3878, Mexico City, Mexico, 2006, pp. 101–104. [47] M. A. Paredes-Valverde, R. Colomo-Palacios, M. del Pilar Salas-Zárate,
and R. Valencia-García, ‘‘Sentiment analysis in Spanish for improvement of products and services: A deep learning approach,’’ Sci. Program., vol. 2017, pp. 1329281:1–1329281:6, Oct. 2017.
[48] H. Sever and Y. Bitirim, ‘‘Findstem: Analysis and evaluation of a Turkish stemming algorithm,’’ in Proc. 10th Int. Symp. String Process. Inf. Retr.
(SPIRE), in Lecture Notes in Computer Science, vol. 2857, Manaus, Brazil, 2003, pp. 238–251.
[49] M. Y. Nuzumlalı and A. Özgür, ‘‘Analyzing stemming approaches for Turkish multi-document summarization,’’ in Proc. Conf. Empirical
Meth-ods Natural Lang. Process., Meeting SIGDAT (EMNLP). Doha, Qatar: ACL, 2014, pp. 702–706.
[50] M. Çağatayli and E. Çelebi, ‘‘The effect of stemming and stop-word-removal on automatic text classification in Turkish language,’’ in
Proc. 22nd Int. Conf. ICONIP, in Lecture Notes in Computer Science, vol. 9489, İstanbul, Turkey, 2015, Nov. 2015, pp. 168–176.
[51] Wikipedia. (2021). Turkic Languages. [Online]. Available: https://en. wikipedia.org/wiki/Turkic_languages
[52] A. V. Dybo. (2007). Chronology of Turkic languages and Linguistic
Contacts of Early Turks. Moscow, Russia. [Online]. Available: https://web. archive.org/web/20050311224856/http://altaica.narod.ru/LIBRARY/ xronol_tu.pdf
[53] Wikipedia. (2021). List of Turkic Languages. [Online]. Available: https://en.wikipedia.org/wiki/List_of_Turkic_languages
[54] H. A. Shehu, M. H. Sharif, S. Uyaver, S. Tokat, and R. A. Ramadan, ‘‘Sentiment analysis of Turkish Twitter data using polarity lexicon and artificial intelligence,’’ in Proc. Int. Conf. Emerg. Technol. Comput., 2020, pp. 113–125.
[55] B. Moser and M. W. Weithmann, Landeskunde Türkei: Geschichte,
Gesellschaft und Kultur. Hamburg, Germany: Helmut Buske Verlag, 2008, p. 173.
[56] K. Katzner, Languages of the World, 3rd ed. Abingdon, U.K.: Routledge, 2002.
[57] Worldometers. (2019). World Population Clock: 7.7 Billion People
(2019)—Worldometers. [Online]. Available: https://www.worldometers. info
[58] M. Kaya, G. Fidan, and I. H. Toroslu, ‘‘Transfer learning using Twitter data for improving sentiment classification of Turkish political news,’’ in
Information Sciences and Systems. Cham, Switzerland: Springer, 2013, pp. 139–148.
[59] O. Coban, B. Ozyer, and G. T. Ozyer, ‘‘Sentiment analysis for Turkish Twitter feeds,’’ in Proc. 23rd Signal Process. Commun. Appl. Conf. (SIU), May 2015, pp. 2388–2391.
[60] B. B. Ogul and G. Ercan, ‘‘Sentiment classification on Turkish hotel reviews,’’ in Proc. 24th Signal Process. Commun. Appl. Conf. (SIU), May 2016, pp. 497–500.
![FIGURE 1. The word cloud of (a), (b), and (c) represents the first dataset, whereas the word cloud of (d), (e), and (f) indicates the second dataset [54].](https://thumb-eu.123doks.com/thumbv2/9libnet/5471256.105894/5.864.63.810.98.194/figure-cloud-represents-dataset-cloud-indicates-second-dataset.webp)

![TABLE 14. Adjusted p-values for various tests considering HAN [Ours] as control method.](https://thumb-eu.123doks.com/thumbv2/9libnet/5471256.105894/14.864.90.780.126.457/table-adjusted-values-various-tests-considering-control-method.webp)
