CASCADED CROSS ENTROPY-BASED
SEARCH RESULT DIVERSIFICATION
A THESIS
SUBMITTED TO THE DEPARTMENT OF COMPUTER ENGINEERING AND THE GRADUATE SCHOOL OF ENGINEERING AND SCIENCE
OF BİLKENT UNIVERSITY
IN PARTIAL FULLFILMENT OF THE REQUIREMENTS FOR THE DEGREE OF
MASTER OF SCIENCE
By
Bilge Köroğlu
September, 2012
i
I certify that I have read this thesis and that in my opinion it is fully adequate, in scope and in quality, as a thesis for the degree of Master of Science.
Prof. Dr. Fazlı Can (Advisor)
I certify that I have read this thesis and that in my opinion it is fully adequate, in scope and in quality, as a thesis for the degree of Master of Science.
Prof. Dr. Özgür Ulusoy
I certify that I have read this thesis and that in my opinion it is fully adequate, in scope and in quality, as a thesis for the degree of Master of Science.
Asst. Prof. Dr. Seyit Koçberber
Approved for the Graduate School of Engineering and Science:
Prof. Dr. Levent Onural
ii
ABSTRACT
CASCADED CROSS ENTROPY-BASED SEARCH
RESULT DIVERSIFICATION
Bilge Köroğlu
M.S. in Computer Engineering Supervisor: Prof. Dr. Fazlı Can
September, 2012
Search engines are used to find information on the web. Retrieving relevant documents for ambiguous queries based on query-document similarity does not satisfy the users because such queries have more than one different meaning. In this study, a new method, cascaded cross entropy-based search result diversification (CCED), is proposed to list the web pages corresponding to different meanings of the query in higher rank positions. It combines modified reciprocal rank and cross entropy measures to balance the trade-off between query-document relevancy and diversity among the retrieved documents. We use the Latent Dirichlet Allocation (LDA) algorithm to compute query-document relevancy scores. The number of different meanings of an ambiguous query is estimated by complete-link clustering. We construct the first Turkish test collection for result diversification, BILDIV-2012. The performance of CCED is compared with Maximum Marginal Relevance (MMR) and IA-Select algorithms. In this comparison, the Ambient, TREC Diversity Track, and BILDIV-2012 test collections are used. We also compare performance of these algorithms with those of Bing and Google. The results indicate that CCED is the most successful method in terms of satisfying the users interested in different meanings of the query in higher rank positions of the result list.
Keywords: Ambiguous Query, Cross Entropy, IA-Select, Latent Dirichlet Allocation (LDA), MMR, Reciprocal Rank, Search Engine, Search Result Diversification (SRD), Test Collection, TREC Diversity Track.
iii
ÖZET
ÇAPRAZ ENTROPİ TABANLI KADEMELİ ARAMA
SONUÇ ÇEŞİTLENDİRMESİ
Bilge Köroğlu
Bilgisayar Mühendisliği Bölümü Yüksek Lisans Tez Yöneticisi: Prof. Dr. Fazlı Can
Eylül, 2012
Arama motorları internet üzerinden bilgi aramak için yararlanılır. Çok anlamlı sorgular için ilgili dökümanların sorgu-doküman benzerliğine göre gelmesi kullanıcıyı memnun etmez; çünkü sorgunun birbirinden farklı birçok anlamı vardır. Bu çalışmada, yeni geliştirilen çapraz entropi tabanlı kademeli arama sonuç çeşitlendirmesi (CCED) yöntemi, sorgunun farklı anlamlarını içeren dokümanları arama sonuç listesinde üst sıralara yerleştirir. Değiştirilmiş ters sıralama ve çapraz entropi ölçümlerini birleştirerek sorgu-doküman benzerliği ile doküman-doküman çeşitliliği arasındaki ilişkiyi dengeler. Sorgu-doküman benzerliğini hesaplamak için Latent Diriclet Allocation (LDA) kullanılmıştır. Çok anlamlı sorgunun anlam sayısı, tam bağlı kümeleme tekniği ile tahmin edilmiştir. İlk Türkçe arama sonuç çeşitlendirme deney derlemi, BILDIV-2012, oluşturulmuştur. CCED’in başarısı iki yöntem ile karşılaştırılmıştır, Maximum Marginal Relevance (MMR) ve IA-Select. Bu karşılaştırmada Ambient, TREC Diversity Track ve BILDIV-2012 deney derlemleri kullanılmıştır. Bu algoritmaların başarısı Bing ve Google ile karşılaştırılmıştır. Sonuçlar, CCED’in sorgunun çeşitli anlamlarıyla ilgilenen kullanıcılara en ilgili dokümanları üst sıralarda getirmesi açısından diğer yöntemlere göre daha başarılı olduğunu göstermektedir.
Anahtar Kelimeler: Çok anlamlı sorgu, Çapraz Entropi, Latent Dirichlet Allocation (LDA), MMR, IA-Select, Ters Sıralama, Arama Motoru, Arama Sonuç Çeşitlendirmesi, Deney derlemi, TREC Diversity Track.
iv
Acknowledgements
First and foremost, I would like to express my sincerest gratitude to my supervisor, Prof. Fazlı Can. I thank him to introduce me how to make research in an exciting and enjoyable way. Without his invaluable guidance and support, this study would not been completed.
I also thank my jury members, Prof. Dr. Özgür Ulusoy and Assist. Prof. Dr. Seyit Koçberber for reading and reviewing my thesis.
I am grateful to David A. Pane of Carnegie Mellon University and Assist. Prof. Dr. B. Taner Dinçer of Muğla University for their help to conduct the experiments of my thesis.
I am indebted to the annotators who contribute the construction of Turkish search result diversity test collection, BILDIV-2012.
I would like to thank the members of Bilkent Information Retrieval Group, Çağrı Toraman and Hayrettin Erdem for their friendship and contribution in BILDIV-2012.
Besides, I acknowledge the financial support of TÜBİTAK under the grant number 109E006, and Bilkent University Computer Engineering Department.
Finally, an honorable mention goes to my beloved parents Ümran and Erdal for their understanding and patience when I am frustrated. Also, I am thankful to my brother, Kaan, for his contribution during construction of BILDIV-2012 and morale support throughout my thesis.
v
To all women who face
vi
Contents
1. INTRODUCTION ... 1
1.1MOTIVATIONS OF THE STUDY ... 3
1.2CONTRIBUTIONS OF THE STUDY ... 5
1.3OVERVIEW OF THE STUDY ... 6
2. RELATED WORK ... 7
2.1BACKGROUND ... 7
2.2INTENT-BASED DIVERSIFICATION METHODS ... 8
2.2.1 Diversification with Query Meanings ... 8
2.2.2 Personalization of Diversification ... 10
2.3OBJECTIVE FUNCTION-BASED DIVERSIFICATION METHODS ... 11
2.3.1 Combining Relevancy and Novelty: A trade-off problem ... 11
2.3.2 Objective functions designed for optimizing evaluation metrics ... 13
2.4DIVERSIFICATION WITH MACHINE LEARNING TECHNIQUES ... 13
3. PRE-CCED OPERATIONS ... 15
3.1CONTENT EXTRACTION WITH HTMLPARSERS ... 16
3.2CONTENT TOKENIZATION AND STEMMING ... 17
3.3NUMBER OF MEANING ESTIMATION ... 19
3.4ASSIGNING MEANING PROBABILITIES TO DOCUMENTS ... 21
3.4.1 The Notation of LDA ... 22
3.4.2 Components of LDA Models... 23
3.4.3 Learning Process in LDA ... 23
3.4.4 Employing LDA in CCED ... 27
4. CASCADED CROSS ENTROPY-BASED SEARCH RESULT DIVERSIFICATION: THE ALGORITHM ... 29
4.1COMPUTING RECIPROCAL RANKS WITH SOMVALUES ... 30
4.2ADIVERSITY METRIC:CROSS ENTROPY ... 34
4.3RANKING WITH MONO-OBJECTIVE MINIMIZATION FUNCTION USING CASCADED FRAME ... 37
vii
6. EXPERIMENTAL ENVIRONMENT ... 50
6.1BILDIV-2012TURKISH SRDTEST COLLECTION ... 50
6.1.1 The Structure of BILDIV-2012 ... 51
6.1.2 Annotation Process ... 52
6.2AMBIENT AND TRECTEST COLLECTIONS ... 55
6.3COMPARISON OF COLLECTIONS ... 56
7. PERFORMANCE EVALUATION MEASURES ... 60
8. EXPERIMENTAL RESULTS ... 65
8.1AN OVERVIEW OF MMR AND IA-SELECT ALGORITHMS ... 66
8.2THE DIVERSIFICATION RESULTS ON AMBIENT ... 66
8.3THE DIVERSIFICATION RESULTS ON TRECCOLLECTIONS ... 69
8.4THE DIVERSIFICATION RESULTS ON BILDIV-2012 ... 72
8.4.1 Diversification of Bing Results ... 73
8.4.2 Diversification of Google Results ... 75
8.4.3 Diversification of Whole BILDIV-2012 Results ... 78
viii
List of Figures
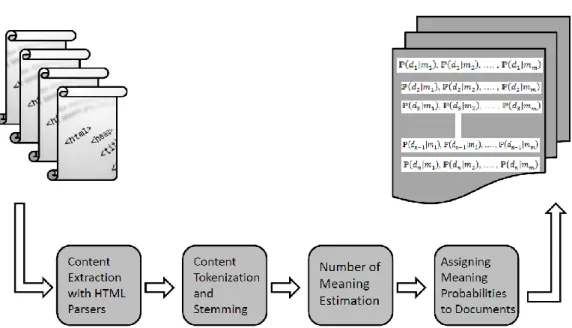
Figure 1.1 Search result list of Bing for the query, “bent” on September 9th
, 2011. ... 3 Figure 3.1. The flow of execution in the preparation phase of CCED. ... 16 Figure 3.2 Sample raw and extracted content of a web page. ... 18 Figure 3.3. Term by document binary occurrence matrix which is employed in
CCED preparation phase. ... 19 Figure 3.4. The correlation between boundary values and total intra-cluster
values in number of meaning estimation for the query “acil servis.” ... 21 Figure 3.5 A toy data collection for illustration of learning process in LDA. ... 23 Figure 3.6. Random assignment of topics to the words in the toy data collection.
... 24 Figure 3.7 Topic assignments of the words after 1st iteration in the toy data
collection. ... 26 Figure 4.1. The flow of execution in CCED. ... 30 Figure 4.2. The square matrix that includes the diversity values computed
between the documents in . ... 36 Figure 4.3 The illustration of cascaded frame (sliding frame) idea in CCED. ... 40 Figure 6.1 The flow of construction of test collection, BILDIV-2012. ... 52 Figure 6.2 A screenshot from the web annotation program, developed to label
BILDIV-2012. ... 53 Figure 6.3 The difference between real and random annotations. ... 55 Figure 6.4 Investigation of the correlation between the number of words and the number of meaning of the queries in test collections. ... 59 Figure 7.1 ERR-IA computation among top five documents on the toy
diversified list. ... 64 Figure 8.1 S-recall values on Ambient. ... 67
ix
Figure 8.2 Precision-IA values on Ambient. ... 68
Figure 8.3 ERR-IA values on Ambient. ... 69
Figure 8.4 S-recall values on TREC Collections... 70
Figure 8.5 Precision-IA values on TREC Collections... 71
Figure 8.6 ERR-IA values on TREC Collections. ... 72
Figure 8.7 S-Recall values on Bing. ... 73
Figure 8.8 Precision-IA values on Bing. ... 74
Figure 8.9 ERR-IA values on Bing. ... 75
Figure 8.10 S-Recall values on Google. ... 76
Figure 8.11 Precision-IA values on Google. ... 77
x
List of Tables
Table 3.1 The distance boundary values and associated cluster numbers for the query, “acil servis” ... 20 Table 3.2 The difference in total intra-cluster caused by one more merging
during clustering ... 21 Table 3.3 The notation of LDA ... 22 Table 3.4 The probabilities of topics over the documents in the toy data
collection ... 25 Table 3.5 Initial random topic assignment for learning an LDA model ... 25 Table 3.6 The initial probabilities of words to be semantically relevant to the
topics in the toy data collection ... 26 Table 3.7 The probabilities of topics over the documents after first iteration in
the toy data collection ... 27 Table 3.8 The probabilities of words to be semantically relevant to the topics
after first iteration in the toy data collection ... 27 Table 4.1 An example of SOM computation in CCED ... 33 Table 4.2 Illustration of correspondence between different retrieval systems ... 33 Table 4.3. An example of score computation in CCED ... 34 Table 4.4 LDA generated probabilities of the documents ... 37 Table 4.5 Diversity scores of the documents... 37 Table 6.1 Comparison of test collections according to the number of words in
queries ... 57 Table 6.2 Comparison of test collections according to the number of meanings
of the queries ... 58 Table 6.3 Spearman correlation coefficient between the number of words and
xi
Table 7.1 A toy diversified search result list, with covered meanings by the
documents ... 61
Table 7.2 Precision-IA is computed by taking ... 62
Table 8.1 S-Recall Values on BILDIV-2012 test groups ... 79
Table 8.2 Precision-IA values on BILDIV-2012 test groups ... 79
1
Chapter 1
Introduction
In the last two decades, web search engines have undertaken a crucial role in satisfying information needs. A typical user utilizes web search engines to do research about a specific topic from online sources, find the answer to a question, and seek the websites of individuals and organizations within a short amount of time.
The user usually clicks a set of web pages by deciding the relevancy of them using snippets. To list the relevant pages, the query must include words that represent the information need. Listing relevant web pages in earlier ranks of search result list is a crucial aim of search engines. As a result, the user satisfaction is increased.
The queries, which are sent to the search engines, are classified by Bhatia [1] as ambiguous, unambiguous but underspecified, information gathering, and miscellaneous.
Ambiguous queries are associated with different unrelated meanings. A well-known example for ambiguous queries is “jaguar.” It means “an animal,” “a car brand,” “a cocktail,” “an operating system,” etc. So, the user probably interested in only one of these meanings.
Underspecified queries have more than one meaning. They are somewhat related to each other. For instance, for the query, “Frank Sinatra,” it is
2
not known if the user seeks his songs, biography, or videos, etc. In other words, the user’s intend is unclear.
Information gathering queries are written to find online sources on a specific topic,like “military power of Turkey” or “how to cook duck.”
Miscellaneous queries are aimed to find the specific products, like movies on the internet.
The queries, which are ambiguous and underspecified, have more than one different meaning or interpretation. For such queries, the search engines may not be successful to retrieve the relevant results to the actual intend of the user. For instance, the user submits a Turkish query, “bent” to the search engine. This query has many different meanings, like “unit of a Divan poem,” “section of a book,” “a film,” “a music band,” “law,” “newspaper article”, “surname of a famous footballer,” “names of different corporations,” “levee,” and “name of a song,” etc. As these possible meanings are unrelated to each other, the user is probably only interested in one of these interpretations. Figure 1.1 illustrates a search result list of the search engine Bing for the Turkish query, “bent” on September 9th, 2011. It is nearly impossible to predict which one of these meanings of the query is intended by the user.
3
Figure 1.1 Search result list of Bing for the query, “bent” on September 9th, 2011.
1.1 Motivations of the Study
The ambiguous and underspecified queries, which have more than one different interpretation, are frequently formulated. Sanderson states that 7% and 23% of the queries are associated more than one different interpretation [2]. Also, another research indicates that 16% of all queries are ambiguous [3]. By considering these statistics, it is worth to work on specific techniques to increase the user satisfaction for such queries.
To overcome the non-specificity of ambiguous and underspecified queries, there exists two approaches; query disambiguation and search result
4
diversification (SRD). In the former approach, the intended meaning of the query is discerned by investigating previous queries and user clicks [4]. It requires saving the profile of each user in the search engine side. The issues of privacy and space complexity should also be considered. Auto completion of queries seems a method for query disambiguation. However, suggested queries do not reflect different interpretations of the query. Instead, they are longer phrases, which contain the words of original query formulated by the user instantly. So, query auto completion cannot be considered as a solution for ambiguous queries.
The methods of search result diversification aim to include the documents each of which covers a different interpretation of the query in the search result list. The methods employ some techniques to estimate which web page is relevant to which meaning of the query. In this way, it is more probable to present at least one relevant web page to the user. Search result diversification is a long-term solution as compared to query disambiguation, because it is not needed to save and process user profiles. This study focuses on search result diversification as it is more suitable method for ambiguous queries and it can be worked without the access of huge search engine logs.
While composing the search result list, the ranking of the meanings in which the document reflect, is another important factor. The document, which is related to widely used meaning, like “levee” for the query “bent,” should be ranked as the first result in the result list. On the other hand, the web document, which is related to the “newspaper article,” should be positioned lower than the one which mentions more common meanings, like “unit of Divan poem”. So, in our study, the meanings of the query are examined whether they are dominant or rarely used one.
The performance of these algorithms can be measured using language specific test collections. To the best of our knowledge, there is no Turkish test collection for the evaluation of search result diversification algorithms. In our
5
work, Turkish search result diversification test collection, Bilkent SRD Test Collection 2012 (BILDIV-2012), is constructed. Different diversification algorithms can be objectively compared by measuring their performance on BILDIV-2012. This test collection, which we aim to share with other researchers, would promote and support research in this area.
1.2 Contributions of the Study
In this thesis, we Design a new technique to estimate the number of meanings of an ambiguous query using complete-link clustering.
Use the Latent Dirichlet Allocation (LDA) [5] algorithm to compute query-document relevancy scores.
Introduce cross entropy [6] as a diversity score between the documents,
Propose a new method for search result diversification, cascaded search result diversification (CCED), by merging the modified reciprocal rank score and cross entropy to balance the trade-off between query-document relevancy and diversity among the retrieved documents.
Examine CCED in the axiomatic framework of result diversification [7],
Show the characteristics of an SRD test collection, BILDIV-2012 (Bilkent SRD Test Collection 2012), which was constructed using a web-based search result annotation tool. BILDIV-2012 contains 47 Turkish queries and their associated relevant documents. It is available for other researchers as the first test collection prepared for SRD studies in Turkish.
Assess CCED by comparing its performance with a state-of-the-art SRD algorithm, IA-Select; and the most commonly used baseline SRD algorithm, MMR. In our assessment, we use the Ambient [8], TREC Diversity Track [9, 10], and BILDIV-2012 SRD test collections,
It is shown that CCED is more succesful when the whole content of web pages can be processed rather than the snippets. Although the coverage
6
of different meanings cannot be completed in higher ranks, CCED satisfies the average user in earlier ranks than MMR and IA-Precision.
1.3 Overview of the Study
The rest of this study is organized as follows. In the next chapter, a literature review on search result diversification is provided. In Chapter 3, the preparation phase of CCED is introduced. In Chapter 4, we present our diversification approach in terms of computation of similarity and diversity metrics and the ranking scores. An investigation of CCED within the framework of eight diversification axioms is provided in Chapter 5. Then, the evaluation metrics of SRD methods are introduced. In Chapter 7, we present the characteristics of the first Turkish SRD test collection, BILDIV-2012 (Bilkent SRD Test Collection 2012), which was constructed using a web-based search result annotation tool. Also, in the same chapter, we describe the Ambient and TREC Diversity Track test collections. The experimental results based on the comparison of CCED with MMR and IA-Select are provided in Chapter 8. Finally, we conclude the study with a summary of findings and future research pointers.
7
Chapter 2
Related Work
In this chapter, the background information about SRD algorithms is given. The basic components of an SRD algorithm are presented. The approach, which SRD algorithms follow, can be categorized into intent-based, objective function-based, and the algorithms with machine leaning techniques. Next, an overview of SRD algorithms is presented for each category of the algorithms.
2.1Background
The search result lists rank the relevant documents with the snippets according to their similarities to the query. For the queries, which have multiple meanings, the search result lists are composed so that they reflect different meanings of the query. These lists are called diversified search result list. Such queries are named as multi-intent queries. Each intent is associated to different meanings of the query. In TREC, the queries are referred to as topics and the meanings are subtopics. In addition, they are classified as ambiguous or under-represented according to the relatedness of the meanings with each other as explained in Chapter 1. In this study, we use the name, meaning, instead of subtopic or intent. Also, the queries are mentioned as ambiguous and under-represented.
8
To include the documents, which reflect different meanings of the query, the SRD algorithms use diversification metrics. The relevancy of document to the actual query is still important while composing the diversified search result list. However, it is obtained that while the diversified list is being included more diverse documents, the relevancy of the documents are decreased. Most of the diversification algorithms consider this trade-off between relevancy of documents and diversity among the documents. They propose solutions to give more diverse results while preserving the query-document relevancy in reasonable values.
2.2 Intent-Based Diversification Methods
The methods in this category employ the techniques to present at least one document which are relevant to each meaning of the query. They estimate the relevancy of each subtopic to the documents.
2.2.1 Diversification with Query Meanings
The first study, in which the diversification problem is presented as the disambiguation of meanings associated to each query [11]. They mention about difficulty of learning with search engines for an unfamiliar research topic. To give a coherent understanding of searched topic, it is proposed that the contents of web pages, which are retrieved for an ambiguous query, are processed to discover all possible subtopics. It is called mining topic-specific concepts. Three effective methods are presented to retrieve the more relevant web pages for ambiguous queries. The first method is presented by defining the important phrase, which is a set of up to three words associated to a subtopic of the query. The second one is also an effective method for the web pages which are prepared in an organized way around all subtopics of the query. The last method requires us to expect that web pages include some useful hints about subtopics and concepts in braces “()”. From this point of view, the sentences, which include the terms of ambiguous query and also braces, are worth to investigate
9
using some heuristics. Liu et al. also point out the problem of ambiguity of extracted subtopics. To resolve the ambiguity, searching the web for the queries that are formulated by combining the query and the subtopic phrases is proposed as a solution.
Zhang et al. propose new ranking scheme, affinity ranking, which employs two metrics, diversity and information richness [12]. By computing the diversity metric, a set of documents is evaluated to find the number of different aspects of the query included in this document set. Information richness of a document is directly related to the quality of the context. Better information richness, wider coverage of different query topics. The method combines relevancy and re-ranking procedure with two tunable parameters, α and β. In this way, the importance of relevancy and novelty can be weighted and changeable according to the system needs. The traditional trade-off between relevancy and novelty is tried to be solved by this way through this diversification algorithm. In the affinity graph, the documents are represented as nodes and the weights of edges are the affinity values between the documents. A group of documents, which are linked with high affinity values, are considered as they are related to a specific subtopic of the query. To model the flow of information, Markov Chain is employed. The issue of redundant documents is solved with a greedy algorithm. The aim in this method is to decrease the rank of less informative and similar documents. In this way, redundant documents are put down in the search result list. Moreover, the pioneer documents from each topic can be detected and ranked in higher ranks. Still, there is a blurred part of the algorithm, which is relevancy.
IA-Select, satisfy the average user for ambiguous query searching by presenting at least one relevant document to intended aspect(s) of the query [13]. From this point of view, they justify that if a subtopic of the query is dominantly mentioned in the relevant documents of the query; it tends to retrieve more number of documents from this dominant subtopic. As a result, it takes the risk of ranking the documents from other minor subtopics in lower ranks or not
10
including some of documents from such minor subtopics in the search result list. This technique is differentiated from the common idea of diversification technique, which is covering as many subtopics of the query as possible in the search result list. IA-Select generates a diversified ranked list of documents by finding the document which has the maximum marginal utility with a greedy approach. This directly corresponds to the basic fact of the algorithm, MMR. Both of the algorithms include the document which is decided as the most different one from the set of documents that are waited to be included in the search result list. However, they employ different heuristics and strategies to find such documents. In practice, it usually composes the diversified list by including one document per subtopic. Such a short list probably may not satisfy the users.
2.2.2 Personalization of Diversification
Personalization of web search result becomes a host research topic for diversification, which is firstly introduced by Radlinski et al. [14]. As profiling of search engine user experiences is not a practical solution for daily usage of search results due to the diversity of information need of a typical user. It is proposed to find probable intents of the query that a user can search for. Query reformulations in 30-minute log sessions are assumed to be candidate subtopics of the query. Radlinski et al. state that the number of times of formulating a query, being followed by another query, and the probability of following a query by another query are used in three subtopic extraction method: Most Frequent method, Maximum Result Variety, and Most Satisfied method. The first one includes the queries that are mostly seen in the search sessions. The last one filters these metrics with some threshold values. The queries, which satisfy these requirements, are included in Most Satisfied method. The middle one, Maximum Result Variety method, combines the probability and similarity metric of the queries in equal proportions in equal proportions with the parameter, λ.
11
2.3 Objective Function-Based Diversification
Methods
The methods in this category introduce an objective function. Finding the optimum solution is designed to give the most diversified search result list. Such an objective function is constructed with the components of a typical SRD problem, query-document relevancy and diversity among the documents.
2.3.1 Combining Relevancy and Novelty: A trade-off problem
One of the initial prominent works on search result diversification is Maximum Marginal Relevance (MMR), which is a metric that is a combination of relevancy and novelty of documents [15]. It measures novelty of a document by computing dissimilarities with other documents that are already retrieved.
(2.1)
MMR employs a trade-off between relevancy and novelty by tuning λ in [0, 1] interval. While more diverse documents are retrieved for small λ values, pure relevancy can be obtained by setting λ to 1. Each time to compose the diversified search result list, the document, which maximizes MMR metric, is added to the list incrementally. As MMR includes a maximization technique according to a scoring criterion, it is accepted as the first diversification algorithm which employs an objective function. It is differentiated from other algorithms in terms of satisfying the objective function for each newly retrieved document in the search result list.
Zhai et al. work on a diversification technique which is based on language modeling of documents [16]. This technique combines relevancy and novelty like MMR. It also requires including the document, which maximizes the objective function, in the next position of a ranked retrieval list. Such an approach also exists in MMR. Combination of relevancy and novelty is based on the costs and probability values of finding novel and relevant documents. For a
12
newly added document to the ranked list, the probabilities of each word in the new document are found on both general English language model, the average of all language models that are ranked higher than this document.
The trade-off between relevancy and diversity is also studied in [17]. In this work, it is preferred not to use additional sources, like subtopic coverage of documents, a list of meanings of the query, or any click-through data, etc., because it is stated that in reality such information cannot be found to use for diversification of the search result list. Therefore, they focus on formulating an objective function to diversify the result set. Two new max-sum diversification algorithm are proposed by Vieira et al., Greedy Marginal Contribution(GMC) and Greedy Randomized with Neighborhood Expansion (GNE).
The method, GMC, selects the document, which has the maximum value of is selected to include in the diversified list. The metric, , includes the similarity, which is a cosine metric and complement of the cosine value is accepted as the function to find the diversity between two documents.
GNE is differentiated from GMC by including the document to the result set by randomly selecting from top ranked ones. It mainly has two steps: GNE-construction and GNE-LocalSearch. These two steps are iterated many times to compensate the randomization part of the algorithm. To account for the trade-off between similarity of documents to the query and diversity among the documents, the parameter, λ, is used. From this point of view, it is the first approach, which employs the randomization in the diversification. Because of randomization, ten iterations are decided to run the algorithm while comparing its success to the other ones.
Agrawal et al. propose a diversification algorithm, which is based on an objective function. In this work, a greedy solution is presented by retrieving the documents, which are from different branches of a predefined taxonomy [13]. Relevancy is directly computed by using the standard ranking of the original
13
query. Vee et al. introduces two objective functions that are also solved by a greedy method to be used for online shopping applications [18]. Also, a new and efficient query processing technique to guarantee composing diversified search results.
2.3.2 Objective Functions Designed for Optimizing Evaluation Metrics
Chen et al. approach to the problem of retrieving relevant documents to ambiguous query is maximizing the expected value of a newly proposed binary evaluation metric, by employing a greedy algorithm [19]. In a ranked retrieval list, is defined as it is one if number of documents from top documents is relevant to the query; otherwise it is zero. The basic idea behind the proposed method is to include the document into the search result list successively. This document is selected as the one which maximizes it with already retrieved documents. This procedure does not take into consideration of whether any previous document is relevant to the actual intent of the user. From the subtopic retrieval perspective, 1-call at n is desired to be 1 for each subtopic of the query in the rank.
2.4 Diversification with Machine Learning
Techniques
The approach, which is followed by Yue et al. is that more number of distinct word coverage, more subtopic coverage for retrieved documents [20]. From this point of view, word frequencies are found as valuable features for diversity. It is the first method that employs training with SVM for subtopic retrieval. The discriminant function to be used in SVM is defined to use two criteria: coverage of documents for a word and deciding whether the document significantly includes the word. For each document, the pairs are constructed with associated feature vector and the list of subtopics, which are mentioned in the document. These pairs are named as training instances. Also, the subtopics are assigned a
14
weight to indicate their importance for the context of the query. Loss function is specified as the weighted percentage of subtopics that are not covered in the result list.
User clicking behaviors are used to learn a diversified ranking model [21]. Online learning approach is followed to maximize the clickthrough. However, the extracted models cannot be used to diversify previously unknown queries. A learning problem is formulated, which is predicting diverse subsets from a set of documents. Structural SVM is also employed in this method.
15
Chapter 3
Pre-CCED Operations
In this chapter, the preparation phase for the diversification algorithm, CCED, is presented. The aim of this phase is to produce necessary data to proceed with CCED.
Figure 3.1 illustrates the preparation phase of CCED. The preparation involves the following steps:
Content extraction with HTML parsers from web pages,
Removal of any punctuation marks from the contents of web pages,
Elimination of the words of which their frequency is under a certain threshold in the data collection,
Content tokenization and word stemming,
Construction of term by document binary occurrence matrix,
Estimation of number of different meanings of the query using complete link clustering algorithm,
Generating the probabilities for relevancy of the documents to each of these meanings with Latent Dirichlet Allocation method [5].
16
Figure 3.1. The flow of execution in the preparation phase of CCED.
3.1 Content Extraction with HTML Parsers
The initial step in the preparation phase is to gather the web pages which are relevant to the submitted query in some degree. If the contents cannot be used directly from the web pages, external programming libraries are employed to overcome this problem. By deleting the punctuation marks, the contents of web pages are extracted.
The web pages in data collections, which are constructed to be used for SRD algorithms, are generally in the form of HTML as shown in Figure 3.2. So, it is needed to extract the content of web pages by eliminating the codes, tags, and tokens of scripting languages, like JavaScript and Ajax. In this study, two HTML parsers are used: Readability [22] and Jericho [23]. Although the first one extracts the contents perfectly, it may not accept some of the web pages due to their structures of including HTML codes. For such cases, the second parser, Jericho is executed [23]. Figure 3.2 also illustrates extracted content of the web page of which in HTML form. The web pages of which their contents cannot be found by both of these parsers are discarded by CCED.
17
After finishing the content extraction, the punctuation marks are also removed from the contents of web pages. This removal operation is done by writing a bash script in Linux environment. From now on, the contents are referred as the documents; because they are directly usable in CCED operations. The set of all documents, all of which are relevant to the submitted query, are referred as throughout the thesis.
3.2 Content Tokenization and Stemming
After the content extraction, the words of the documents are found. The words, which exist in stopword list, are taken out from the documents. Then, F5 stemming is applied to all the remaining words. Following to this, the stems, of which the collection frequency is under a certain threshold, are also discarded. Lastly, the occurrence matrix is constructed with the remaining stems.
The words are tokenized by tracking the whitespaces in the documents. The stopwords are also eliminated from the documents. The list for English stopwords is directly taken from the work of a research paper [24]. For the Turkish list, two different sources are used. One of them is another research paper which is about new event detection and tracking and the other one is from a research group in Fatih University [25, 26]. The Turkish stopword list is constructed by merging these two lists. It is advantageous for CCED because they do not have a role to affect the meaning of a document.
Following to stopword elimination, the stems of the words are found. The method, F5 stemming, is used due to the easy computation. In this method, the words, of which the length is equal or smaller than five, are remained as the stems without any change. Longer words are truncated so that the first five letters are kept as the stems.
18
a. Sample raw content of a web page
b. Extracted content of a web page
Figure 3.2 Sample raw and extracted content of a web page.
Starting from this point, the documents are represented as the set of stems with their occurrence frequencies of the whole document set, . Before constructing the term by document occurrence matrix, some of the words, of which their collection frequency is under the threshold value, are discarded. This threshold value depends on the contents of the document and the average number of relevant documents to the query in the test collection. However, it is
19
observed that the optimal threshold value is greater than one and less than 5% of the average number of relevant documents for each query in the test collection.
As the last part of this step, binary occurrence matrix (BOM) is constructed. In this matrix, the rows correspond to the each remaining stem of the words; whereas the columns are the documents. The elements in the matrix are 0 or 1, based on whether the stem occurs in the corresponding document or not. Figure 3.3 shows an example binary occurrence matrix. This matrix is used in the next step, in which the number of meanings of the query is estimated.
Figure 3.3. Term by documentbinary occurrence matrix which is employed in CCED preparation phase.
3.3 Number of Meaning Estimation
The matrix, , is constructed to be used for the estimation of number of query meanings. The rows of is accepted as the feature vectors of the associated stemmed words. By using their feature vectors, the words are clustered with complete-link clustering technique [27]. The distance values among words are found by the Dice similarity measure (see Formula 3.1). The number of the clusters gives the different meanings of the query.
(3.1)
The complete-link clustering algorithm terminates by gathering all the words into one cluster. For this purpose, a distance boundary is selected so that clustering is terminated when the minimum inter-cluster distance among all pair of clusters exceeds this boundary. It is difficult to find the boundary value, of which the corresponding cluster number is closest to the actual number of meanings of the query. To overcome this problem, we assess a set of boundary values.
20
To find the best cutting-level, cluster scatter is employed. The intra-cluster scatter is the sum of all of the pair-wise distances between elements in a cluster as shown in Formula 3.2. Table 3.1 includes the values which are computed for the estimation of number of different meanings for the query “acil servis.” Total intra-cluster scatter values are computed by taking the summation of intra-cluster scatters of each generated cluster. The correlation between the total scatter and the number of clusters is investigated to find the best cutting-level.
(3.2)
Table 3.1 The distance boundary values and associated cluster numbers for the query, “acil servis”
Distance boundary No. of Estimated
Meaning Total intra-cluster scatters
0.70 15 3,629 0.75 13 3,956 0.80 10 5,580 0.85 7 8,241 0.90 6 9,668 0.95 3 21,063 0.98 2 39,418
In Table 3.1, total scatter of 15 clusters for the boundary value 0.70 is 3,629. If the clustering is performed with 0.75, two more pairs of clusters are merged. The total scatter is increased to 3,956. It means that joining a cluster with another one causes to increase the total scatter by 163 ( (3,956 - 3,629) / 2). Table 3.2 lists these intra-cluster scatter differences for each merging of two clusters for the query, “acil servis.” The distance boundary is selected as the 4th
smallest value of intra-scatter difference. Therefore, it is selected as 0.90 and its corresponding cluster number, six, is found as the number of meanings of the query.
21
Table 3.2 The difference in total intra-cluster caused by one more merging during clustering Boundary Transition Intra-cluster scatter difference per cluster
0.70-0.75 163 0.75-0.80 541 0.80-0.85 887 0.85-0.90 1426 0.90-0.95 3798 0.95-0.98 18354
If these differences are examined on the plot, in Figure 3.4, the boundary value is the cutoff point of the curve, which is also 0.90. If the corresponding number of clusters of the boundary is greater than or equal to 20, it is taken as 20.
Figure 3.4. The correlation between boundary values and total intra-cluster values in number of meaning estimation for the query “acil servis.”
3.4 Assigning Meaning Probabilities to
Documents
As the last step of the preparation phase in CCED, each document is assigned a set of scores which reflect the relevancy of the document to the meanings of the query. For this purpose, Latent Dirichlet Allocation (LDA), [5] is employed.
Before exploring the concepts, it is useful to be familiar with the parameters and their abbreviations in LDA. Initially, the original notation of LDA [5] is presented. Following to this, the topic modeling approach of LDA is explained.
0 5000 10000 15000 20000 0.75 0.80 0.85 0.90 0.95 0.98 Int ra -C lust er S ca tt er D if fe rnce
22
Then, the process of learning an LDA model is demonstrated on a toy data collection. Lastly, the role of LDA in CCED is presented.
3.4.1 The Notation of LDA
The smallest unit, word, in LDA is also the smallest unit of a sentence which has a specific meaning individually. To execute the algorithm on a document set, tokenization of documents into the words is necessary. All different words in the document set constitute the vocabulary, V. Each word has an identification number from 1 to V. This number is written in a subscript format like, . A document, w, is represented as a sequence of words in the order that they occur in the document, like . A collection of M documents is called corpus. It is represented as a set of documents, .
In LDA, the number of words in a document is distributed according to Poisson distribution with the parameter, . The distribution of the topics in a document is also modeled as a Dirichlet distribution, with the parameter, . In other words, a sample event from this Dirichlet distribution is another distribution, which directly gives topic distribution of a document, . The topics in are abbreviated as . Each topic has a multinomial distribution over the words in the vocabulary, which are represented as .
Table 3.3 The notation of LDA
Abbreviation Explanation
w a smallest unit of a sentence, word
V the set of all different words in a document set
w a vector of the words in occurrence order of the document
D a document collection
The parameter of Poisson distribution
The parameter of Dirichlet distribution
The topic distribution of a document, which is sampled from the Dirichlet distribution
A topic in the distribution,
23 3.4.2 Components of LDA Models
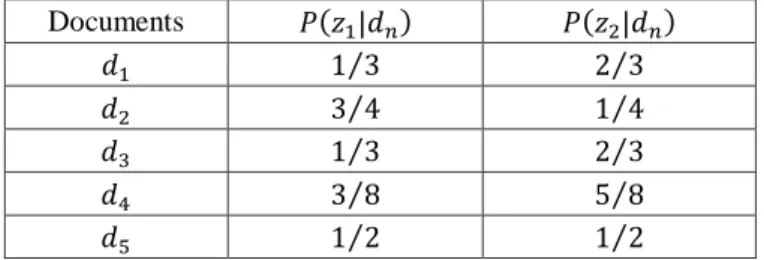
In LDA, each document, w, is associated a distribution among a set of topics, with the size n. It means that number of topics that are sought in the document is k. Also, it is assumed that topic distribution of each document, , in a data collection is modeled with another type of distribution, Dirichlet, with the parameter, . It says that the document with the topic distribution, , has n different topics, from , through . To give an example, suppose that indicates that document has three topics, , , and . It is relevant to these topics with the probabilities, 0.55, 0.30, and 0.15 respectively.
Each topic, , is represented with a multinomial probability distribution, . The probability of semantic relevance of a word to a given topic is defined in this model. For instance, if the topic, is aimed to include the document with a word, this word is selected from the associated multinomial distribution. The probability of inclusion of a word from a topic, , is found from these multinomial distributions of the topic.
3.4.3 Learning Process in LDA
To generate the distributions in LDA models, the process for learning should be conducted on a set of documents. LDA require to take the values of the parameters, , , and the number of topics as input parameters. This procedure is explained on a toy data collection with five documents, in a step-by-step fashion (see Figure 3.6).
24
The number of topics is assumed to be two. Learning process starts by assigning a topic randomly to each of the words in the documents. In this way, initial distribution of topics on the documents, , and the distributions of the words on the topics, ’s, are achieved. Table 3.4 and 3.6 list the probability values for these distributions. After random topic assignments to the words, the probability distribution of topics over the documents, , and the distribution of words over the topics, , can be obtained.
To find the probability values for the distribution, , each document is investigated to find what proportion of the words are assigned to the topics. For instance, has six words; two of them are assigned to and four of them are assigned to . So the probability distribution of and over are calculated as and respectively. For all documents, topic probability values are computed. Table 3.4 lists the initial probabilities for the distribution, .
dere (z2) küçük (z1) akan (z2) su (z2) çay (z2) denmek (z1) } nar(z1) su(z2) içmek(z1) başlamak(z1) }
çay (z2) çocuk(z1) yüzmek(z2) }
çay (z1) kenar (z2) oturmak (z2) akan (z1) su (z1) sürüklemek (z2) nar (z2) görmek
(z2) }
nar(z1) tanecik(z2) yemek(z1) bayılmak(z2) }
Figure 3.6. Random assignment of topics to the words in the toy data collection.
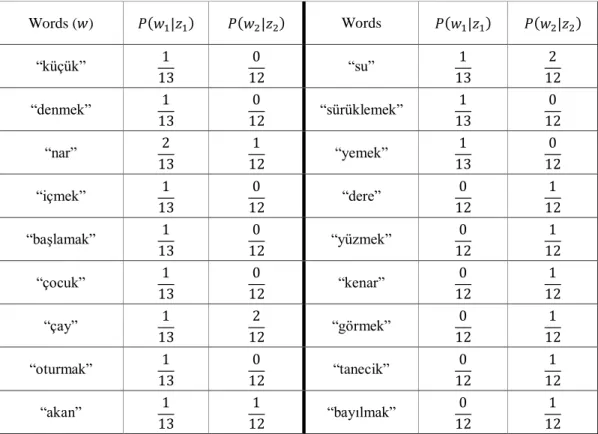
At the end of the random assignment, 13 words are associated to the topic, , and 12 words are to . The distributions of words over the topics are found from the whole vocabulary. Each word is seen as an event of two multinomial distributions each of which is associated to a different topic. The probabilities of these events are calculated by considering the occurrence frequencies of the words after the topic assignments. To give an example, the word “nar” is seen in the dataset three times; and two of them are assigned to and one of them is assigned to . So, the probability of semantic relevancy of the word “nar” to these topics are calculated as and respectively. Table 3.5 lists the words and their occurrence frequencies in the data collection after 1st topic assignment. Table 3.6 includes all the probabilities of being relevant to the topics for each word in the vocabulary.
25
Table 3.4 The probabilities of topics over the documents in the toy data collection
Documents
Table 3.5 Initial random topic assignment for learning an LDA model
Topic The set of words assigned to the topics
{“küçük”, “denmek”, “nar”(2), “içmek”, “başlamak”, “çocuk”, “çay”, “oturmak”, “akan”, “su”, “sürüklenmek”, “yemek” }
{“dere”, “akan”, “su”(2), “çay”(2), “yüzmek”, “kenar”, “nar”, “görmek”, “tanecik”, “bayılmak”}
As these distributions are generated randomly, they are needed to be improved. It is aimed to repeat the topic assignment process many times by using the computed probabilities in the previous iteration. For each word in the vocabulary, the probabilities of the word to be semantically relevant for each topic are calculated according to the Formula 3.4.
(3.4)
To see how topic assignment is changed for a word, “nar” is selected as an example. This word was assigned to in . By using the Formula 3.4, it is found that which of the topic is more semantically relevant to the word. The probabilities of being relevant to the topics and for the word, “nar”, which is in are calculated in Formula 3.5 and 3.6 by using the probabilities, which are computed previously. As is greater than , the topic assignment to the word, “nar” is changed from to .
(3.5) (3.6)
26
Table 3.6 The initial probabilities of words to be semantically relevant to the topics in the toy data collection Words ( ) Words “küçük” “su” “denmek” “sürüklemek” “nar” “yemek” “içmek” “dere” “başlamak” “yüzmek” “çocuk” “kenar” “çay” “görmek” “oturmak” “tanecik” “akan” “bayılmak”
At the end of the second iteration, the topic assignments are changed as shown in Figure 3.8. The topic of “su” in is converted to . Also, the topics of the words, “çay,” “akan,” “su,” and “nar” is changed in . As a result, the probability values in Table 3.4 and 3.6 are no longer valid for the data collection. Updated topic probabilities for the documents are listed in Table 3.7. In Table 3.8, the probabilities of the words, which are changed during the second iteration, are listed.
dere (z2) küçük (z1) akan (z2) su (z2) çay (z2) denmek (z1) } nar (z1) su (z1) içmek (z1) başlamak (z1) }
çay (z2) çocuk (z1) yüzmek (z2) }
çay (z2) kenar (z2) oturmak (z2) akan (z2) su (z2) sürüklemek (z2) nar (z1) görmek
(z2) }
nar (z1) tanecik(z2) yemek(z1) bayılmak(z2) }
27
Table 3.7 The probabilities of topics over the documents after first iteration in the toy data collection Documents
At this point of execution, each word is found as relevant only one of the topics, as one of two associated probability values is always 0.0. So, there is no need to repeat the re-assignment of the topics in the toy data collection. In the real data collections it is needed more than 1000 iterations to reach such a stable condition for real data collections.
Table 3.8 The probabilities of words to be semantically relevant to the topics after first iteration in the toy data collection
Words ( ) “su” “nar” “çay” “akan”
3.4.4 Employing LDA in CCED
In the preparation phase of CCED, LDA is desired to find the probabilities of relevancy of the documents to each meaning of the query. To execute the LDA, the external library, mallet, is used [28]. In LDA, the topics, from , through correspond to the meanings of the query. The documents are the contents of the web pages, which are relevant to the query in some degree. The words in LDA are the stemmed words of the web pages. The estimated number of meanings in the previous step of preparation phase is given to LDA as the number of topics.
28
The parameters of the Poisson and Dirichlet distributions, , are both set to 0.01 as they are suggested by mallet. To decide on the value of the number of iteration, some manual experiments are conducted. It is observed that the higher the number of iteration, higher probabilities is assigned to common meanings in all documents. As CCED aims to list the documents, which are related to rarely used meanings of the query, it is not suitable to allow high number of iterations of LDA. As a result, LDA is executed on the documents with 100 iterations. In this work, LDA is executed so that the summation of all topic probabilities for a document is equal to 1.00 in LDA models. The final topic probabilities of the documents are used as the relevancy scores of each meaning of the query in CCED.
29
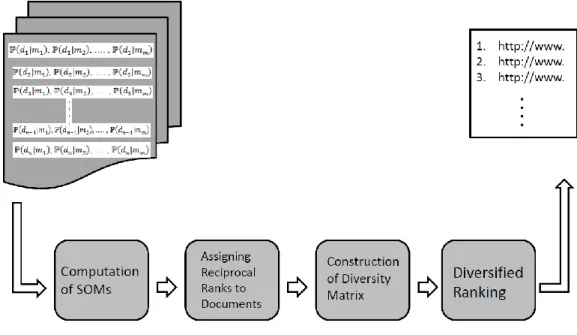
Chapter 4
Cascaded Cross Entropy-Based
Search Result Diversification: The
Algorithm
In the last step of the preparation phase, LDA produces the probabilities for each document to be relevant to the different meanings of the query. The flow of the work continues with taking CCED to the stage by setting the number of document to be included in the diversified search result list. CCED starts its execution by computing the significance values of the meanings (SOM) for the query. In this way, both dominant and rarely used meanings can be investigated from the contents of the relevant web pages to the query. By using SOM values and probabilities of documents, the similarity metric of CCED, , is computed for each document. The probabilities, which are generated for the documents, are also used to find the semantic distance between the documents. This distance is referred as diversity in this context. To measure the diversity between the documents in the set, cross entropy is used. Cross entropy measures the difference between two probability distributions. As the probabilities of each document constitute a probability distribution among the meanings, it is suitable to employ this metric to find the diversity between the documents. The reciprocal rank and the cross entropy are combined to formulate a
mono-30
objective diversification function. By finding the optimal document for each rank, the diversified search result list is composed.
This chapter introduces the steps of CCED algorithm as shown in Figure 4.1. As the first step, the SOMs are computed for the query. By taking the intuition from a data fusion technique, modified version of reciprocal rank [29] is calculated to reflect the relevancy of the documents to the query. In the second step, the cross entropy is presented to show how it can measure the diversity between the documents in CCED algorithm. Following to this, the formulation of score is obtained by combining the reciprocal rank and cross entropy in a mono-objective function. Finally, the process of composing a diversified search result list is presented.
Figure 4.1. The flow of execution in CCED.
4.1 Computing Reciprocal Ranks with SOM
Values
As mentioned in the previous chapter, number of different meanings of the query, is estimated by complete-link clustering technique. LDA [5] produces a probability distribution for each document by using estimated number of
31
different meanings of the query and the documents. A probability value in the distribution indicates the chance of being relevant to the associated meaning of the query for the document. In this step, it is aimed to extract the query-document relevancy, which is one of the essential parts of the diversification algorithms. In this work, this relevancy measurement is done with the modified formula of reciprocal rank. In addition, it is desired to find the common (dominant) and rarely used meanings of a query. Therefore, a new method, significance of meaning (SOM), is proposed. In this way, CCED gives more importance to the documents, which heavily mention about a dominant meaning, as compared to the ones about a rarely used meaning of the query.
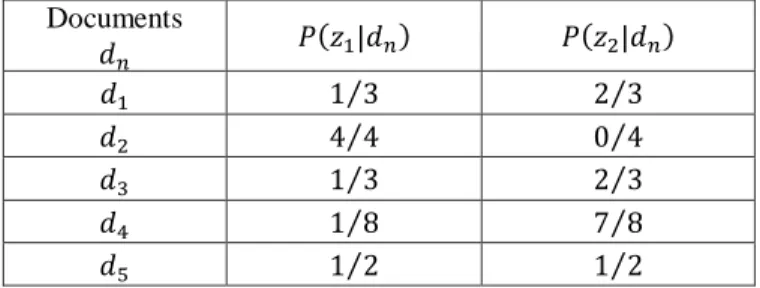
To numerically evaluate the meanings in terms of being common or rare, a new concept, significance of meaning, , is introduced. It is quantified as shown in the formula 4.1. To calculate this score for each meaning, the probabilities, which are assigned to documents, are used. The idea behind this score is that if the associated meaning is estimated by higher probability values for many numbers of documents, it is a good candidate to be a dominant meaning of the query. For such meanings, its score will be higher than many of the other meanings. It is possible that some of the meanings are estimated by higher probabilities on a few documents. In such cases, it is thought that it is not a common meaning in the context of the query. As compared to the initial example, its score will be lower.
(4.1)
The purpose of the diminution factor is to lessen the importance of dominant meanings and augment the importance of rarely used ones. Without the diminution factor, it is observed that the documents with dominant meanings come forward in the result list. As mentioned in the previous chapter, the meaning probabilities are calculated in the range [0.00, 1.00]. There should be a numerical difference on the contribution of meaning significance when the probability value is 0.10 or 0.95. This mandatory difference is provided by the
32
diminution factor. Intuitively, it can be thought that if the probability of a meaning in a document is 0.70, this document has ten different imaginary information segments and seven of them are related to the same meaning. As compared to the ideal case in which the document has seven segments and all of them are related to the same meaning, the loss due to the deviation from the ideal case can arguably be measured by subtracting 1.00 from the inverse of the probability value, . For each meaning of the query, the SOM values are calculated as shown in Table 4.1. For this example, the diminution parameter, dim, is set to 0.95. Decreasing the dim reduces the contribution of meaning probabilities to the value of sig.
The computation of significance values for each meaning is required to find the relevancy of each document to the query. As the query-document relevancy cannot be taken from the search engine side, it is needed to seek another way to measure the relevancy. In this work, this measurement is done by the modified version of reciprocal rank, [29] which is a data fusion technique. When there are n number of retrieval systems all of which ranks the documents for the same query, it is possible to merge these ranking lists into one list with this method. The final ranking is desired to reflect individual ranking lists of different retrieval systems.
The intuition behind reciprocal rank can be applicable to query-document relevancy in subtopic retrieval such that each retrieval system ranks the documents according to one meaning of the query. However, rather than the taking inverse of individual rankings, this time, the actual probability values are incorporated into the formula. Moreover, as each meaning has different SOM value, it means that each retrieval system should not be represented equally in the final ranking. To reflect the relative importance of meanings while merging the ranking lists, the probabilities are multiplied by the associated SOM values. In the light of these modifications on the formula, CCED computes the reciprocal rank, , of each document according to the Formula 4.2.
33
(4.2)
Table 4.1 An example of SOM computation in CCED Contribution to 0.10 0.30 0.50 0.70 0.80 0.95 3.226
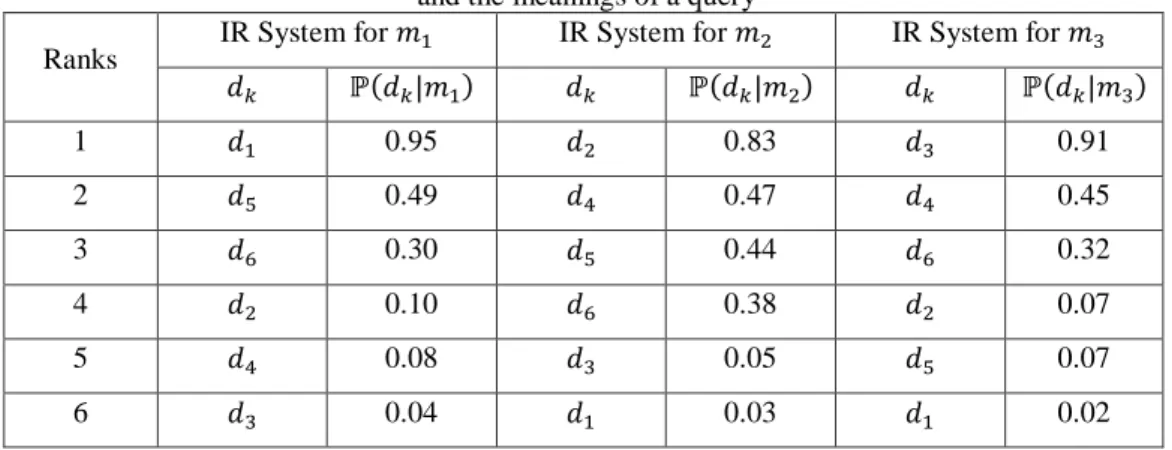
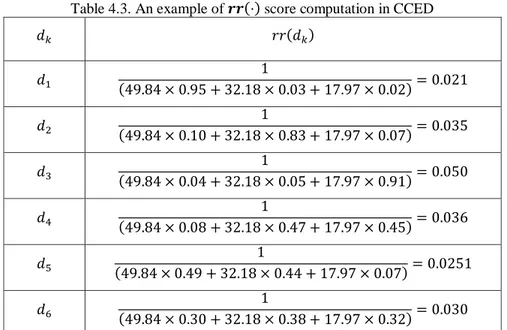
Table 4.2 illustrates the idea of , IR System, is aimed to rank the documents according to their relevance to one meaning of the query. Table 4.3 shows how scores of individual documents are calculated in the toy dataset. It is assumed that the SOM values for the meanings, , and are calculated as 49.84, 32.18, and 17.97 respectively. By employing the SOM concept, the documents, which mention dominant meanings of the query with high probabilities, can be positioned in top ranks of diversified search result list.
Table 4.2 Illustration of correspondence between different retrieval systems and the meanings of a query
Ranks IR System for IR System for IR System for
1 0.95 0.83 0.91 2 0.49 0.47 0.45 3 0.30 0.44 0.32 4 0.10 0.38 0.07 5 0.08 0.05 0.07 6 0.04 0.03 0.02
34
Table 4.3. An example of score computation in CCED
4.2 A Diversity Metric: Cross Entropy
The SRD algorithms are basically employing query-document relevancy and the diversity between the documents. In the previous step, it is explained that CCED uses reciprocal rank with SOM values to represent the role of query-document relevancy in the algorithm. In this step, it is time to measure the diversity, or semantic distance, between the documents so that it is going to be combined in an objective function. Cross entropy, [8] which is used to measure the diversity in CCED, is presented.
In SRD algorithms, the crucial aim is to include the documents, each of which covers a different meaning of the query in adjacent positions of the diversified search result list. In this way, complete coverage of the query meanings can be provided to the user. From this point of view, it is easy to see that the knowledge about which document mentions which of the meanings is needed. However, it may not be possible to exactly know the meanings of the query in advance. Without knowing of the possible meanings of the query and subtopic coverage information of the documents, semantic distance between the documents is proposed as a solution to evaluate the documents, whether they reflect different or similar aspects of the query. This distance is referred to as the
35
diversity in the context of SRD. As a semantic distance, CCED employs cross entropy by using the probability assignment to the documents for each meaning of the query. Before explaining the formulation of cross entropy, entropy will be introduced. Then, by making the connection between entropy, the cross entropy is detailed. Lastly it is defined how cross entropy is proper to diversify the search result lists.
In information theory, entropy is defined as the minimum number of bits that should be used to encode the events of a probability distribution for a random variable [30]. Also, this metric is used to measure the randomness of a probability distribution of a set. For instance, a document set with positive and negative labeled elements is a good candidate on which the entropy can be measured. The entropy of a probability distribution, associated with a random variable, , can be computed by Formula 4.3. There are number of different events, , associated with the random variable.
(4.3)
Cross entropy is based on the concept of entropy. It is the average number of bits to differentiate a probability distribution, r, from another distribution p. So, p is the target distribution and r is the estimated distribution. The value of cross entropy indicates how the probability values of each event in two distributions are close two each other. The cross entropy is defined as follows:
(4.4)
Cross entropy is not a symmetric metric; that is may not be equal to . So, if the p and r have exactly the same probabilistic distribution, the cross entropy between them is calculated as the individual entropy value of p and r.
36
Using cross entropy as a diversity metric between documents is suitable for CCED because probability events of the documents directly correspond to the meanings of the query. As the probabilities are summed to 1.0 on each document, there exists a meaning probability distribution over each document. All documents, , are compared with each other by using the Formula 4.5.
(4.5)
In CCED, target probability distribution, , is used as the meaning distribution on previously retrieved document, whereas the estimated distribution, , is the one which is examined to decide whether it is worth to include in the diversified list or not. While the score, , is getting larger, it means that, the difference between meaning probability distributions of and is increasing. It indicates that the documents mention different aspects of the query. After finishing the all comparisons between the documents, a square matrix, with diversity values between documents is constructed (Figure 4.2).
Figure 4.2. The square matrix that includes the diversity values computed between the documents in .
An example that shows how cross entropy reflects the semantic distance between documents is provided Tables 4.4 and 4.5 using a toy dataset with three documents. Suppose that diversified search result list contains the document, in the first rank. Then, it is needed to find for the second document from the remaining documents, or . Although, the diversity value, , is not directly used as a ranking score in CCED, the documents with higher values have more chance to be selected to the search result list. Table 4.4 includes the meaning probabilities of the documents. In Table 4.5, diversity between and