1387
ON THE JOB ASSESSMENT SYSTEMS IN RECRUITMENT AND AN
APPLICATION FOR PREDICTIVE VALIDITY
Asst. Prof. Tekiner KAYA
Nevsehir Hacı Bektas Veli University, Faculty of Economics and Administrative Sciences, Departmant of International Trade and Logistics, [email protected]
ORCID: 0000 0001 6136 5028
Assoc.Prof. Korhan KARACAOĞLU
Nevsehir Hacı Bektas Veli University, Faculty of Economics and Administrative Sciences, Departmant of Business Administration, [email protected]
ORCID: 0000 0003 0577 231X
Abstract
The assessment center (AC) method is a procedure used by human resource management (HRM) to evaluate and develop personnel in terms of attributes or abilities relevant to organizational effectiveness. On the job exercises are one of the distinguishing features of the assessment centre method. In this study, an new assessment model is developed and reliability of the model is analysed via ordinal logistics regression and t-test. Findings prove that on the job assessments have more power on predicting performance for blue collar in the event of well established company competencies and assessment tool integration.
Keywords: Assessment Centers, HRM, Blue Collar Recruitment, Ordinal Logistics Regression
Özet
Değerlendirme merkezi (AC) yöntemi, insan kaynakları yönetimi (İKY) tarafından personeli organizasyonel etkinlikle ilgili nitelikler veya yetenekler açısından değerlendirmek ve geliştirmek için kullanılan bir prosedürdür. İşbaşı çalışmaları, değerlendirme merkezi yönteminin ayırt edici özelliklerinden biridir. Bu çalışmada yeni bir değerlendirme modeli geliştirilmiş ve sıralı lojistik regresyon ve t-testi ile modelin güvenilirliği analiz edilmiştir. Bulgular, şirket içi yeterliliklerin rasyonel olarak belirlenmesi ve kesin değerlendirme araçları ile ölçülmesi durumunda,, iş üstünde değerlendirme sistemlerinin mavi yaka için performans tahmininde güçlü bir tahmindi olduğunu ortaya koymaktadır. Anahtar Kelimler: Değerlendirme Merkezleri, İnsan Kaynakları Yönetimi, Mavi Yaka İşe Alım, Ordinal Lojistik Regresyon
1388
INTRODUCTIONThe underlying rationale of the use of assessment centers as criterion measures is that they correspond closely to the job and therefore can be considered as miniaturized settings for observing work performance. It is defined as “a standardized evaluation of behavior based on multiple inputs” (Rupp, 2015).It has been designed to measure relatively specific sets of hard and soft skills for managerial, operational, development or promotion purposes. Initially, computers were used to compile and analyze ratings from a team of assessors. Recently, more sophisticated applications have emerged, primarily in the methods to present stimuli. Exercise stimuli have been presented via video monitors and on computer-based simulations (Bobrow and Schulz, 2002).
However, these methods appear to have poor incremental validity over other more cost-effective measures like ability tests, and other ‘context free’ measures including the personality ‘big five’ dimensions (Hoeft and Schuler, 2001; Thornton and Gibbons (2009: 172) also observes that recent AC applications are not designed and implemented as rigorously, or that recent research studies are not as rigorous in example small unrepresentative samples or unreliable criteria. Clearly, such a research is also needed to understand AC applications’ work performance prediction strength for blue collar workers who perform primarily physical work and whose career paths are relatively restricted (Lederer, 1987) in Turkish manufacturing industry.
The primary purpose of this paper is to measure the efficiency and reliability of developed two main AC tools in a big scale Turkish Automotive Manufacturer on recruitment process for blue collar members; competency based employment tests and on the job assessment model (OJAM) which were designed based on company requirements. The work performance prediction potential of developed tools were analysed. In both, AC literature and industry AC applications are analysed and constructed for specialist, engineering level or management level (white collar employees). This study focus on the efficiency of AC for blue collar workers for corporates which has high volume of recruitment operations although it takes time comparing other cost-effective recruitment tools. Since the competencies, cognitive and technical skills that required to be measured in AC for office (white collar) and operation members (blue collar) are significantly different, it is also aimed to figure out how work performance prediction capacity of ACs for blue collar is and how reliable.
1. Literature Review
The assessment center method is a procedure used by human resource management (HRM) to valuate and develop personnel in terms of attributes or abilities relevant to organizational effectiveness. Even though all assessment centers share common features, the process can be adapted in many ways to achieve different objective (Thornton and Rupp, 2006; 1) ACs have a number of key features. They are essentially multiple assessment processes, and there are various ways in which that is so: a group of candidates/participants takes part in a variety of exercises, observed by a team of trained assessors/observers, who evaluate each candidate/participant against a number of predetermined, work-related behaviours. It is important to remember that ACs are a method, not a construct and that different ACs may measure different constructs (Arthur and Villado, 2009). Mainly, many ACs measure common or similar dimensions (Arthur et. al., 2003), but even dimensions with similar names may be defined and operationalized very differently in different ACs (Thornton and Gibbons, 2009: 171).
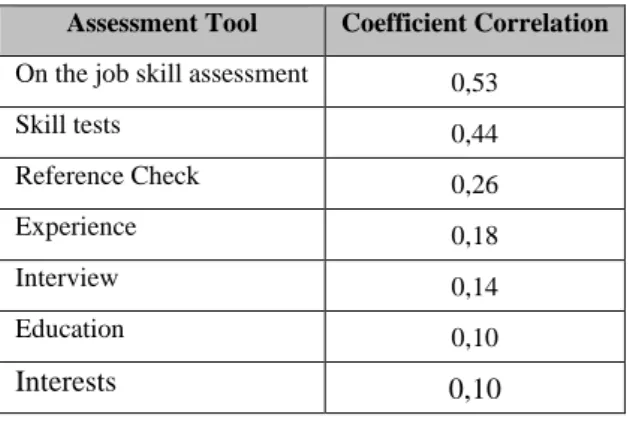
Mathis et.al. (1997; 238-249) issued hard skill and soft skill mesurement tests on the job assessments and proved that these type of on the work tests are good predictor of work performance (Table 1). Gaugler et al. (1987: 250); Rupp et al. (2008: 118) and Thornton and Gibbons, (2009: 185) observed that ACs predict work performance more accurate than classical
1389
assessment methods. In these studies, researchers exposed weak and average (between 0,37 and 0,52) correlation between work performance and AC applications.Table 1. Relation between tests/applications/ tools used recruitment and work performance Assessment Tool Coefficient Correlation
On the job skill assessment 0,53
Skill tests 0,44 Reference Check 0,26 Experience 0,18 Interview 0,14 Education 0,10 Interests 0,10
Source: (Mathis et.al., (1997)
Bray and Campbell (1968) found a correlation of ,51 between overall assessment rating (OAR) and subsequent job performance ratings for sales person. However, for the last 40 years, Thornton and Gibbons (2009) put forward that recent meta-analyses found lower average validity coefficient (around ,26 and ,28) between OAR and work performance. But the reason behind this dramatic reduction is not clear. It is understandable that certain AC features that are applicable and accepted by several groups involved in the AC in one country may not be applicable or generally acceptable by organizations, selectors, or indeed applicants involved in ACs in another country. Facing such cross-cultural variability in AC design, execution, and implementation, research into between-country differences in ACs is important (Krause et al. (2014).
Hermelin et.al. (2007) analysed 26 ACs which conducted from 1985 to 2006. Corrected estimate of ,28 validity coefficient observed on predicting supervisory job performance . This means that ACs have consistently ability to predict job performance. ACs have also been shown to have additional predictive power over and above cognitive ability and personality (Krause et al, 2006). Schmidt and Hunter (1998) exposed the relationship between cognitive ability tests and job performance was higher (r=.51) than relationship between ACs and job performance (r=,37). Although lots of studies that consist of exercises, structure of ACs, validity, reliability and dimensions of ACs were represented in literature, these studies mainly focused on white collar recruitment. And the focus point of these researches was to be able to measure cognitive abilities, soft skills and personality basically. Zibarras and Woods (2010) explain these situations as ACs are widely used mainly for graduate and managerial selection and development purposes. By the way, lots of findings from AC literature focus on cognitive skill (sustained attention, processing speech, perception etc.), personality (openness, extraversion, agreeableness etc.), soft skill (leadership, teamwork, communication etc.) and competency (problem solving, perseverance, decisiveness etc.) measurement capacity of AC via case studies, job-in basket tools, presentations, role plays, exercises and interviews. However, the required skills and abilities for blue collar members are quite different than this figure. Hybrid skills which are a blend of soft, technical and hard skills should be measured. This is very important for Japanese companies since these corporates hire all members thinking that they can wear a management cap for company in future. In addition, lifelong employment is essential. So, this makes blue collar employment crucial for Japanese companies. The other significant point is that the hiring volume is so high comparing white collar recruitment. So, this study focused on job performance predictors by measuring hybrid skills for blue collar employees via Computer Aided Work Simulation assessment process and competency based employment tests. Based on company and shop skill requirements, prediction strength was measured via newly designed AC and employment tests. In Turkey, manufacturing companies including big sized enterprises don’t prefer using AC for blue collar recruitment because of hiring cost. Thornton and Rupp (2006) also exposes that there is significant
1390
cost associated with AC, including labour, physical space, and a large amount of people’s time. On the other hand, Cascio and Ramos (1986) and Burke and Frederick (1986) figured out that the economic gain from the use of the AC is at least $2,500 per selectee per year, and can be as high as $21,000 per selectee per year. This means that even though the AC is more expensive than the interview, the benefits of better prediction far outweigh these higher costs. In addition, there is a cost of bad hire such as increased turnover, dampened morale, compromised quality of work, lost time for recruitment and train new member, sustainability, decreased productivity, reputational damage. One bad hire costs companies more than expected and more that the numbers.There are lots of variables such as number of exercises, peer evaluation, assessor, AC tools design, assessment duration, judgement algorithm design, which directly affect ACs blue collar work performance prediction strength. Binning and Barrett (1989) found that AC tools have better performance on work performance prediction for more complex jobs. For instance, Krause et.al. (2006) found that overall AC ratings have incremental predictive validity over cognitive ability. So, for some industries, cognitive flexibility (e.g. ability to solve complex problems at the same time), problem solving, analytical thinking competencies have crucial role on operational level. Collins et. al. (2003) conducted a meta-analysis that analyses relationship between AC performance and measures of cognitive ability and personality constructs. Findings show that the multiple R between AC performance and predictors was ,84 which is quite high. A meta-analysis done by Gaugler et.al. (1987) found ,37 corrected validity between OAR and dimensions. On the other hand, recent meta-analyses have found lower average validity (,26 and ,28) between performance and OAR (Hardison and Sackett, (2004); Hermelin et.al, (2007)). Furthermore, studies presented that different dimensions have in correlation with different external measures (Lance et al (2000); Spector et al. (2000); Crawley et al. (1990); Shore et. al. (1990); Dayan et al (2002)). The significant part of these findings are that the examined ACs were designed based on different (some of them are company specific) dimensions. On the other hand, these dimensions are grouped into 2 category; blue collar and white collar in Turkey. In literature, there is no study which analysis ACs’ assess potential for blue collar employees in Turkey. In general, companies prefer to use tools such as multiple choice tests (general, not company specific), interviews and rarely personality inventory tests in Turkey. So, this study also aims to shed light on the power, reliability and applicability of AC applications for blue collar. Since the dimensions needed to be measured for blue collar employees differ and hybrid formed, OJAM and Competency based employment tests designed to measure hybrid skills which consist of soft, hard and company competencies and shop specific technical skills. Also there areinternational differences among countries’ AC implementations such as selection decisions, assessment tools validity beliefs, usage ratio of AC tools, tool usage purposes and budgets for recruitment. This structure also exposes country specific AC designs to measure company specific dimensions.
2. Blue Collar Recruitment in Turkey
Automotive industry hires big amount of blue collar operation members in Turkey. 52.066 employees work on manufacturing directly in industry and 40.000 of them is blue collar operation member (OSD, 2018). From 2014 to 2018, number of blue collar employee in sector increased 21%. And one of the strongest point of Turkish Automotive companies is that they have high skilled and qualified operation members. Based on Peryon (2018) turnover research results, since overall turnover ratio is high (%16,3) in automotive industry and production volumes fluctuate severely, companies must hire significant number of blue collar employees per month.
Companies in sector desire to hire blue collar employees who have good physical condition, basic experience, able to work on shifting schedules, ability to work on repetitive processes and for at least 45 hours per week (www.kariyer.net job ads, 2019). So, dimensions aimed to measure for blue collar on assessments in Turkey are mainly; salary, residence location, psychical condition, very basic technical skill, experience, ability to learn and basic communication. Reliable systems which have ability to measure cognitive and non-cognitive skills at the same time are needed for automotive industry in Turkey.
1391
2.1. Problem
To clarify the main problem, problem solving analysis is applied. Breakdown the problem showed that 70% of the resignations&terminations of 585 cases realizes within 2 months of hiring and 58% of them is because of high workload. As a result;
• Candidates can not understand and visualize how the actual working environment and conditions in operation before hiring.
• Subjective criteria on recruitment evaluation process • No competency based member to process match
Main effects of the problem are high turnovers, hiring candidates who are not in line with corporate culture, high recruitment costs and risk of insufficient number of blue-collar team member at operation because of unpredicted resignations.
2.2. A New On the Job Assessment Model
2.2.1. Competency based new employment tests
Based on the competencies determined by company fort he blue-collar team members, 6 different tests were designed: analytical comparison, meaning, virtual mind, virtualization, analytical thinking and problem solving. Tests were designed to measure company specific blue-collar competencies and each has between 15 and 25 questions.
2.2.2. On The Job Assessment Model (OJAM)
The main aim of the process is to measure the physical capacity and strength of the candidates. In addition, process also evaluates challenge, 5S and safety perception of candidates in line with company policies. OJAM has configured on 4 different processes: Paint, welding, assembly and logistics. These are the key shops which recruit 85% of total hiring. Each processes has been established on measuring the competencies of each shops on the job evaluation.These processes are;
• Weight mounting (for logistics) • Spot welding ( for welding) • Bolt tightening (for assembly) • Sealer application (for paint)
The OJAM system has designed as follows:
1- Candidates are informed about the OJAM. Assessor makes presentation about the rules and the system (5 minutes)
2- Candidates wear safety equipments based on the process they work on (5 minutes) 3- On each process, candidates watch the video that what they should do, what the key points
are and evaluation criteria. (There are 4 bolt tightening, 4 welding, 4 sealer and 4 logistics processes. In total OJAM evaluates 12 candidates in 4 hours. And daily capacity of OJAM is 24 candidates)
4- If the candidates are ready, they click on “start” button on screen and start working on process.
5- The system measures how many cycle they did, how many mistakes occurred, stability of performance, number of andon that pulled by candidate (andon is a rope which should be pulled in case of emergency or an abnormal situation. At the beginning of assessment, this information is shared with candidates)
6- Assessor also evaluates candidates’ safety, working in a team ability, communication skills (with leader and other team members), anthropometric structure and ergonomics proportion.
7- In overall, OJAM evaluates the scores based on the standard scores determined by company and decide if the candidate is OK, Triangle of NG (Not good). The assessor also
1392
adds his/her comments and re-evaluates the OJAM score. In case the OJAM evaluates the candidate OK, assessor has authority to change it to NG by adding his/her comments. 8- Assessor assigns the OK candidates to appropriate shops based on the process scores. Forinstance, if the candidate is good at bold tightening, he/she is assigned to assembly shop. Dimensions of performance are identified by hybrid model which is based on job analysis that includes analysis of tasks and responsibilities in particular jobs and job groups and competency modelling that focus on identification of competencies needed to reach strategic aims of organization.
2.3.AC Dimensions and Validity
To test to see how the OJAM works and good at predicting performance, an empirical study performed which takes more then 8 months.
2.3.1. Data
Data gathered via pilot study on established assessment centre (AC) in a company in automotive industry in Turkey in 2017. Company hires more than 100 temporary candidates per month for production for its manufacturing shops: welding, paint, assembly and logistics. Candidates followed the each step of ex and the new recruitment process: Paper based ex-recruitment tests (Math, meaning and reading - TET), 6 paper based new recruitment tests (Analytical comparison, meaning, virtual mind, visualization, analytical thinking and problem solving), interview, health check and CAWSC (Computer Aided Work Simulation Center) process. The candidates who passed the ex-recruitment tests, interview and health check, they were hired for 6 months without checking their OJAM and new recruitment tests results. After 6 months, their performances were evaluated by their own team and group leader and gave them a score between 0 and 100. 150 candidates’:
• Job performance after 6 months, • Ex-recruitment test results (TET),
• New recruitment tests results (6 different tests),
• OJAM scores (7 different OJA - On the job assessment scores) are used as main data.
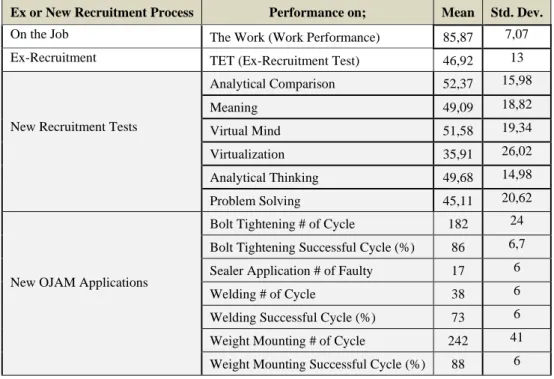
Table 2 shows the mean and standard deviation of scores
Ex or New Recruitment Process Performance on; Mean Std. Dev. On the Job The Work (Work Performance) 85,87 7,07 Ex-Recruitment TET (Ex-Recruitment Test) 46,92 13
New Recruitment Tests
Analytical Comparison 52,37 15,98 Meaning 49,09 18,82 Virtual Mind 51,58 19,34 Virtualization 35,91 26,02 Analytical Thinking 49,68 14,98 Problem Solving 45,11 20,62
New OJAM Applications
Bolt Tightening # of Cycle 182 24 Bolt Tightening Successful Cycle (%) 86 6,7 Sealer Application # of Faulty 17 6
Welding # of Cycle 38 6
Welding Successful Cycle (%) 73 6 Weight Mounting # of Cycle 242 41 Weight Mounting Successful Cycle (%) 88 6
1393
2.3.2. Pilot Study
Before launching the system, a pilot study was applied to see; • The performance of new recruitment process (OAR) • The efficiency of member to process match
The prediction strength of OJAM processes and competency based new employment tests 150 candidates called based on main pre-screening criteria (school, living place etc.). First, the ex and new recruitment paper based tests were applied. Then, all candidates attended interviews with human resources specialists and department representatives. If candidate has no major concern (such as communication, main health problem, location concern etc), then they passed to OJAM step.
3. Methodology
In this study, a multiple model approach was developed to find solutions for the problems and figure out the efficiency of OJAM system.
The real set of predictors used in the regression model must be determined by data analysis. Stepwise linear regression (SLRM) model used and this research had presented on 18. International Business Business Congress in 2019. So, the results of that study is used in this study and overall analysis are improved by adding new analysis which is the subject and aim of this study.
OLR model is used to expose the strength of the predictors on work performance which were categorized into 3 groups: Very good, average and below average. The reason behind selecting OLR model is that it has ability to figure out how significant predictors influence work performance. A major assumption of ordinal logistic regression is the assumption of proportional odd which means that each independent variable has an identical effect at each cumulative split of the ordinal dependent variable.
The third model used in this study is independent samples - t test. It is is used to expose whether significant work performance predictors differ based on graduated school type. The hypothesis to be tested are
H0: Difference between the two school type means is equal to 0 based on significant work
predictors (No difference)
H1: Difference between the two school type means is not equal to 0based on significant
work predictors
The Independent Samples t Test requires the assumption of homogeneity of variance, normally
distributed data, no significant outliers and continuous scale measurement.
The fourth model is set to measure the efficiency of member to process match on OJAM. As mentioned before, it is assigned by assessor’s observation and OJAM results. If candidates is successful, than assessor assigns candidate to a shop based on his/her performance by checking 4 different OJAM results. And Pearson correlations between related shop performance and significant work performance predictors are checked to measure the member to process match performance. High correlation was interpreted as efficient member to process match.
4. Findings
Data analysed by SPSS 17.0 statistical analyses and all assumption for all model are tested firstly. Correlations The assumption of proportional odds for OLR model is tested by parallel lines. Test results shows that the proportional odds assumption appears to have held because the significance of Chi-Square statistic is 0.838 which is greater that 0.05. And also goodness of model fit results which is useful for determining whether a model exibits good fit to data show the deviance test are non significant (x2(188)=72.134, p= 1.00). These results suggest good model fit.
The independent samples t test assumptions which are homogeneity of variance, normally distributed data, no significant outliers and continuous scale measurement are checked.
1394
Normality, homogeneity of variance and continuous scale assumptions were also checked for other models and have been held. However, 4 significant outliers are detected and removed. Stepwise linear regression model results show that 4 of 14 variables have statistically significant effect on work performance.Y (Work performance) = 27,9 + 0,10(Bolt Tightening #) + 0,04(Weight Mounting #) + 0,31(Weld #) + 0,24(Weld Perc)
So, if candidate achieves 10 more cycle on bold tightening process, the overall work performance will go up 1,03 over 100. Similar to this example, 10 more weight mounting 0,37; 10 more welding cycle 2,5; 10% more welding correctness 2,1 and 10% more bold tightening correctness 1,3.
As a second model, OLR model, is used to expose the strength of the predictors on work performance which were categorized into 3 groups: very good, average and below average. To figure out the best predictor/s of best performance, statistically significant predictors determined by stepwise regression model are used on OLR model. Pseudo R-square values are treated as rough analogues to the R2 value in ordinary least square regression. In literature, there are no
common strong guidance on how these should be interpreted (Osborne, 2015; Pituch and Stevens, 2016). However, Pseudo R-square values do not have same interpretation as R2. Table gt shows
OLR coefficiens and significance test results for each of the independent variables. The coefficients are interpreted as the predicted change in log odds of being in a higher per unit increase on independent variable. Statistically significant dependent variables are Bolt tightening #, weight mounting # and welding perc (sig. <0,05). This means as scores increase on an independent variable, there is an increased probability of falling at a higher level on the dependent variable. For instance for every one unit increase on bolt tightening #(cycle), there is a predicted increase of ,088 in the log odds of work performance being in a higher level. So, 3 of the 6 predictors have significant role on differentiating work performance level.
T figure out if the significant work performance predictors differ based on graduated school type, independent samples – t test is applied. 50 candidates are graduated from high school and 48 is from occupational high school. However, the significance value is 0.38 which is not statistically significant. It is obvious that the difference in work performance between high school graduates and occupational high school graduates is statistically significant as expected.
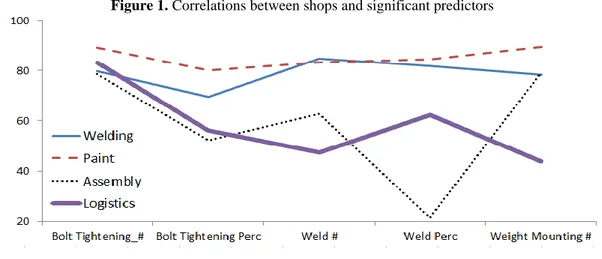
To reveal how member to process match is being operated efficiently on OJAM, Pearson correlations between related shop performance and significant work performance predictors are checked. The coefficient correlations resultsexpose that
• Bold tightening # (number of cycle) is an efficient indicator on member to process match for all shops. This means that candidate good at bold tightening can work on all shops. However, it has no role on putting the performance figure which makes difference. • Welding processes related results on OJAM are not efficient indicators on member to
process match for assembly and logistics shops as expected.
• Welding processes related results on OJAM are efficient indicators on member to process match for welding shop as expected.
• Weight mounting # process on OJAM is a bit far away from predicting logistics shop performance. It is strange that the weakest correlation of the study is observed between logistics shop performance of candidates and weight mounting # process results.
• Bolt tightening Perc performance is a good predictor of welding and paint shop performance but not strong for assembly as planned.
1395
Figure 1. Correlations between shops and significant predictors
RESULTS AND CONCLUSION
Findings prove that on the job assessments or computer based simulation assessments have more power on predicting performance for blue collar in the event of well established company competencies and assessment tool integration. If competencies and skills are determined well and assessment tools were established to measure them, OJAM has ability to predict work performance accurately. Although the correlation between OAR and work performance is average, this study shows it can be strong. On the other hand, paper based exams have no power even they were designed based on competencies and virtual. Although the 6 new paper based exam were designed to measure based on competencies, none of them had significant role as predictor. The reason behind this might be that they are not a part of measuring;
• Repetitive and continuous work performance for long hours (especially valid on serial production and continuous work flow in automotive industry)
• Hard working • Perseverance • Responsibility
As a strongest predictor, bolt tightening # process, also supports this result. In average, each candidate performs 180 cycles continuously, in a flow and with high caution for 1 hour. It has a good integrated measurement combination of competencies and skills which were aimed to predict. In terms of multiple choice questions, it is obvious that candidates do not analyse the problem in detail, do not try to find root causes, do not try to understand relationship, do not think for long hours, do not focus in depth and do not design anything while solving multiple choice questions. This may work on understanding the overall performance of candidates or distinguishing candidates on general issues. However, it is not a strong method for measuring specific work performance or repetitive processes even this employment tests were designed to measure company competencies or skills.
To increase efficiency in operation, assigning appropriate candidate to appropriate shop considering related shop dynamics is essential. Member to process match efficiency results show that relationship between shop and shop related OJAM process performances are sufficient. However, the system has still improvement potential. On the other hand, findings are applicable for all sector and has benefical findings for corporates other than candidates.
Further studies might be measuring the role of OJAM on turnover ratios. In addition, working hours on OJAM processes might have critical role on predicting work performance. In general, companies do not prefer long hours assessment for blue collar because of high costs. However, assessing blue collar employees for long hours might be less costly for mid and long term. Instead
20 40 60 80 100
Bolt Tightening_# Bolt Tightening Perc
Weld # Weld Perc Weight Mounting # Welding
Paint Assembly Logistics
1396
of 1 hour assessment per process at OJAM, different scenarios may apply and results might be compared. Work performance of candidates might be broken down into dimensions such as knowledge, skills, abilities, motivation and situational constraints and effect of dimensions on these areas might be analysed.The overall results should be considered under the restriction of OJAM and competency based new employment tests were designed to measure company competencies well. And results did not indicate any finding about turnovers since none of the candidates were resigned during pilot study.
1397
REFERENCESArthur, W. Jr, Bennett, W. Jr, Edens, P.S. and Bell, S.T. (2003), Effectiveness of training in organizations: a meta-analysis of design and evaluation features, Journal of Applied Psychology, Vol. 88 No. 2, pp. 234-245.
Arthur, W., Jr., & Villado, A. J. (2008). The importance of distinguishing between constructs and methods when comparing predictors in personnel selection research and practice.Journal of Applied Psychology, 93, 435−442.
Binning, J. F., Barrett, G. V. (1989). Validity of personnel decisions: A conceptual analysis of the inferential and evidential bases. Journal of Applied Psychology, 74(3), 478–494.
Bobrow, W. and Schulz, M. (2002, October). Applying technical advances in assessment centers. Paper presented at the 30th International Congress on Assessment Center Methods. Pittsburgh, PA.
Bray, D. W., and Campbell, R. J. (1968). Selection of salesmen by means of an assessment center. Journal of Applied Psychology, 52(1, Pt.1), 36–41. https://doi.org/10.1037/h0025353 Burke, M.J., & Frederick, J.T. (1986). A comparison of economic utility estimates for alternative SDy estimation procedures. Journal of Applied Psychology, 71, 334-339.
Cascio, W.F., & Ramos, R.A (1986). Development and application of a new method for assessing job performance in behavioural/economic terms. Journal of Applied Psychology, 11, 20-28. Collins, J. M., Schmitt, F. L., Sanchez-Ku, M., Thomas, L., McDaniel, M. A., & Le, H. (2003). Can basic individual differences shed light on the construct meaning of assessment center evaluations? International Journal of Selection and Assessment, 11, 17–29.
Dayan, K., Kasten, R., & Fox, S. (2002). Entry-level police candidate assessment center: An efficient tool or a hammer to kill a fly? Personnel Psychology, 55, 827–849.
Crawley, B., Pinder, R., & Herriot, P. (1990). Assessment centre dimensions, personality and aptitudes. Journal of Occupational Psychology, 63, 211–216.
Gaugler, B.B., Rosenthal, D.B., Thornton, G.C. and Bentson, C. (1987) Meta-analysis of assessment center validity. Journal of Applied Psychology, 72, 493–511.
Hardison, C. M., & Sackett, P. R. (2004). Assessment center criterion related validity: A meta-analytic update. Unpublished manuscript.
Hermelin, E., Lievens, F., & Robertson, I. T. (2007). The validity of assessment centres for the prediction of supervisory performance ratings: A meta-analysis. International Journal of Selection and Assessment, 15, 405–411.
Hoeft, S., and Schuler, H. (2001). The conceptual basis of assessment centre ratings. International Journal of Selection and Assessment, 9(1-2), 114–123.
International Task Force on Assessment Center Guidelines (2009). Guidelines and ethical considerations for assessment center operations. International Journal of Selection and Assessment, 17, 243-253.
Krause, D. L., Kersting, M., Heggestad, E. D., & Thornton, G. C. (2006). Incremental validity of assessment center ratings over cognitive ability tests: A study at the executive management level. International Journal of Selection and Assessment, 14, 360–371.
Krause, Diana E.Neil Anderson, Robert J. Rossberger, and Zulaicha Parastuty. (2014). Assessment center practices in Indonesia: An exploratory study. International Journal of Selection and Assessment, 22, 384-398.
1398
Lance, C. E., Newbolt, W. H., Gatewood, R. D., Foster, M. R., French, N., & Smith, D. E. (2000). Assessment center exercise factors represent cross-situational specificity, not method bias. Human Performance, 13, 323–353Lederer, M. (1987). Blue-collar jobs for women. New York, New York Books
Mathis, R. L., Nica, P.C. and Rusu, C.(coord.) (1997) Human resources management, Bucharest: Economică.
Osborne, J.W. (2015). Best practices in logistic regression. Thousand Oaks, CA: Sage Publications.
OSD (Automotive Manufacturers Association), (2018). General and Statistical Information Bulletin Of Automotive Manufacturers Reports, Istanbul. (Via http://osd.org.tr/osd-publications-/statistics/)
Peryon (Turkey Human Management Association). (2018), Çalışan Devir Oranı Araştırması Sonuç Raporu, İstanbul. (https://www.peryon.org.tr/uploads/2019/4/9/PERYO%CC%88N_
%C3%87al%C4%B1%C5%9Fan_Devir_Oran%C4%B1_Sonu%C3%A7_Raporu_2017-2018.pdf )
Pituch, K.A., and Stevens, J.P. (2016). Applied Multivariate Statistics for the Social Sciences: Analyses with SAS and IBM’s SPSS (6th ed.), Routledge.
Psychological Testing Center (2018). Design, Implementation and Evaluation of Assessment and Development Centres: Best Practice Guidelines, The British Psychology Society.
Rupp, D. E., Thornton, G. C., III, and Gibbons, A. M. 2008. The construct validity of the assessment center method and usefulness of dimensions as focal constructs. Industrial and Organizational Psychology, 1: 116-120.
Rupp, D.R. 2015. Guidelines and Ethical Considerations for Assessment Center Operations, Journal of Management, 41, 4: 1244–1273
Schmidt, F. L., Hunter, J. E. (1998). The validity and utility of selection methods in personnel psychology: Practical and theoretical implications of 85 years of research findings. Psychological Bulletin, 124, 262–274.
Shore, T. H., Thornton, G. C., & Shore, L. M. (1990). Construct validity of two categories of assessment center dimension ratings. Personnel Psychology, 43, 101–116.
Spector, P.E., Schneider, J.R., Vance, C.A & Hezlett, S.A. (2000). The relation of cognitive ability and personality traits to assessment centre performance, Journal of Applied Social Psychology, 30, 7, 1474-1491.
Thornton, G. C., III, and Rupp, D. E. 2006. Assessment centers in human resource management. Mahwah, NJ: Lawrence Erlbaum.
Thornton, G.C. and Gibbons, A.M. (2009) Validity of assessment centres for personnel selection, Human Resource Management Review, 19, 169-187.
Zibarras, L.D., Woods, S.S., (2010) A survey of UK selection practices across differentorganization sizes and industry sectors. Journal of Occupational and Organizational Psychology, 83, 499–511.