MODELLING AND VALIDATION ANALYSIS ACCORDING TO
TEMPERATURE EFFECT OF DIFFERENT TYPE BATTERIES
by
Ahmet AKTAS a*, Yagmur KIRCICEK b, and Mehmet OZKAYMAK b
a Department of Electrics Electronics Engineering, Simav Technology Faculty,
Kutahya Dumlupınar University, Kutahya, Turkey
b Department of Energy Systems Engineering, Technology Faculty,
Karabuk University, Karabuk, Turkey Original scientific paper https://doi.org/10.2298/TSCI190401331A
Nowadays, batteries used in many areas such as RES have an important place in energy storage. Because of the unstable and intermittent structure of RES, bat-tery energy storage technology is becoming important. There are many different types of batteries in the market, such as lead-acid, nickel-metal hydride, and lithi-um-ion. It is very important that these batteries are well recognized and controlled accordingly to extend their cycle life. In this study, necessary parameter values were obtained by conducting lead acid, nickel-metal hydride and lithium-ion charge-discharge experiments by using climatic chamber in the laboratory envi-ronment. A single model was created using curve fitting for three different battery types. In addition the electrical model of the batteries, the temperature model was also combined to conduct state analyzes at different operating temperatures of the batteries and a mathematical model was derived. The obtained mathematical mod-el MATLAB/M-File program was used to compare with the experimental results. In this paper, electrical and thermal mathematical equations for different types of batteries are compared with experimental and model results and the accuracy ratios are given.
Key words: battery modelling, energy storage, lead-acid, lithium-ion, nickel-metal hydride, temperature effect
Introduction
The most important problem for providing energy from RES to the electric power system is unstable and variable of the energy generated from these sources by depending on the climatic conditions [1]. From the solar panels in a sunny weather and wind turbines on a windy day efficient electricity can be generated. However, the electricity generated by RES varies according as the climatic conditions. Energy storage technologies are an import-ant player in electric power systems in recent future [2, 3]. Energy storage applications can cope with the change in value resulting from the power of RES according to meteorological conditions and only day that can work as solar energy systems. With energy storage applica-tions can be ensured more stable power quality to the users by through microgrids. All these functions are not realized productively and efficiently by using monotype energy storage unit in microgrids.
There are many storage alternatives as energy storage solution. Particularly, batteries are among the indispensable energy storage units with the development of technology. Many battery types with various chemical structures are being developed. The use of lead-acid, nick-el-metal hydride (Ni-MH), and lithium-ion batteries, which are widely used today, is quite common. Lead-acid and Ni-MH batteries have lower energy density than lithium-ion batteries. In addition, compared to lead-acid and Ni-MH batteries, lithium-ion batteries store more energy in their volume and weight [4, 5]. In this study, lead-acid, Ni-MH and lithium-ion battery types were investigated. One of the most important things to be aware of regarding the use of batteries today is the consideration of its temperature. Batteries are damaged by extreme temperatures, and they also have negative effects such as explosion and burning [6-8]. If the batteries are checked (charge-discharge) in consideration of the electrical parameters as well as the tempera-ture, long-cycle life of the batteries is ensured [9, 10].
There is no direct measurement of battery state of charge (SOC), and an approximate estimation account is possible depending on the physical, chemical and electrical parameters of the battery. Many battery models have been developed for calculating the battery characteristics and accordingly the SOC of battery [11]. Three different models, electrochemical, stochastic and electrical, have been proposed in the cell-based studies that make up the battery. The equa-tions which form the model together with the calculation accuracy criterion of electrochemical models are composed of sets of non-linear, complex PDE. In this model, which requires long calculation times, it is necessary to know a large number of parameters which must be provided by the manufacturer and which are very difficult to obtain. These models are more useful in battery design. The calculation accuracy of the statistical models based on a set of probabili-ty formula is low and there is no clear information about cell characteristics. In addition, the calculation times of these models are also extended. Mathematical battery models obtained without any electrical value; energy efficiency and capacity. Electrical models for batteries consist of passive elements such as sources and resistances and capacitors [12, 13]. There are many studies about battery modelling in the literature. Chen and Rincon-Mora [14] studied a model that combines the temporary capacitance of the Thevenin model and the properties of the impedance-based model for lithium-ion batteries. Rakhmatov et al. [15] propose a model for battery life investigation for implementations in a pocket PC. Lithium-based batteries have an improved electrical circuit model based on the temperature effect [16, 17]. In another study, the analysis of temperature and aging effects of lithium-ion batteries was investigated [18, 19]. With the proposed hybrid battery model, the capacity of the lithium battery was determined with a maximum error rate of 4.7% and 9.2% [20]. In this study, the Li-ion battery charge mod-el with maximum 1.748% error, discharge modmod-el with maximum 1.437% error rates has been observed. Another application of today’s developing batteries is hybrid and electric vehicles. Especially lithium-ion batteries used in electric vehicles have high energy densities. This high energy density causes severe temperature effects during use. More than 15 coefficients are used in other proposed thermal model structures. A thermal model with too much coefficient makes it difficult to form the equation at the beginning [21, 22]. In this study, a single coefficient is included in the proposed thermal battery model. Thus, the battery SOC is detected faster and more accurately. It is known that both internal and ambient temperature affect the operating characteristics of lithium-ion batteries especially in electric and hybrid electric vehicles [18, 23]. It is very important to know the temperature of each battery cell, especially in electric vehi-cles. Temperature-related thermal battery algorithm has been tried without thermal test chamber [24]. This removed the test process from the constant temperature conditions. Since the tests performed in this study were done in the thermal test chamber environment, the temperature
was kept constant throughout the experimental study. Thus, the batteries voltage values taken for the batteries give a real thermal model. Many modelling studies have been carried out con-sidering the temperature of the batteries [25-27].
This study analyzed both temperature and electrical characteristics and created a sin-gle mathematical model. In this study, the electrical battery model is used, which is the source of voltage and resistance. Accurate modelling of the battery and the control of the parameters with low error rates prolong both the life of the battery and ensure safe operation. The purpose of this study is to model the battery parameters with the lowest error rates by modelling differ-ent types of batteries operating in differdiffer-ent temperature conditions.
Battery charge modelling with temperature effect
The lead-acid battery charging graph in different temperatures conditions shown in fig. 1 is used in battery charging modelling studies. This graph shows the change of the terminal voltage according to the SOC of battery in case of charging a lead-acid battery. The charging graphs of all the batteries constructed in this study are based on this curve type in terms of basic structure. Therefore, the derivation of the model equation of such a curve constitutes the basis of the charge modelling studies in this study. As modeled in the curve of the example charge chart, it is divided into two parts as fC1
and fC2 functions.
The example given in fig. 1 is defined as two separate functions to increase the accura-cy by reducing the base while forming the modelling equation in a battery charge curve. These functions are represented as fC1 and fC2. In eq. (1), m1 is the slope of the function fC1, and m2 in
eq. (2) is the slope of the function fC2:
2 1 1 2 1 B B V V m SOC SOC − = − (1) 3 2 2 3 2 B B V V m SOC SOC − = − (2)
In battery charging experiments, different battery types are subjected to tests at the same current values and at different temperatures. The voltage value at the terminals of the bat-tery differs according to the SOC of the batbat-tery at different temperature values. The difference in these graphs is actually the change in the values of m1 and m2 given in eqs. (1) and (2). Thus,
if the operating temperature of the battery changes, the variation of the SOC of the battery at different temperatures can be estimated with the same equation structure in the direction of the data taken from the experimental results.
Equations (3) and (4) are given in equations fC1 and fC2. The fC1 and fC2 equations in
the battery charge model are expressed as a whole and the total charge graph is generated. The formula of this total charge graph is expressed as in eq. (5) using the equations fC1 and fC2. Thus,
the graph of the battery charge curve will be expressed by a single basic mathematical equation:
Battery charge graphs in different temperatures
B a tt e ry v o lt a g e [V ] Battery SOC [%] fC1 fC2
SOC1 SOC2 SOC3
VB1 VB2 VB3 TB1TB2TB3 TB3>TB2>TB1 55 °C > 45 °C > 35 °C TREF= 25 °C / 77 °F
Figure 1. Typical charge voltage SOC graph for lead-acid batteries under different temperatures
0 2 1 1 0 1 REF 1 2 1 d ( ) d B B B C B B B V V V f V T T SOC T SOC SOC − = + − + − (3) 02 3 2 2 02 1 REF 1 3 2 d ( ) dB B B C B B B V V V f V T T SOC T SOC SOC − = + − + − (4)
Given by eq. (3) and eq. (4), VB0 is the battery terminal voltage at the start of the
function fC1, VB02 is the battery terminal voltage at the start of the function fC2, VB1, VB2, and VB3 are the functions of the battery voltage intermediate values, percent denominated the SOC of the battery, percent denominated SOC1, SOC2, and SOC3 are the functions of the
interme-diate values of the SOC of battery, TB1 is the intermediate temperature value of the battery, TREF (25 °C/77 °F) is the reference temperature point for the battery:
(
)
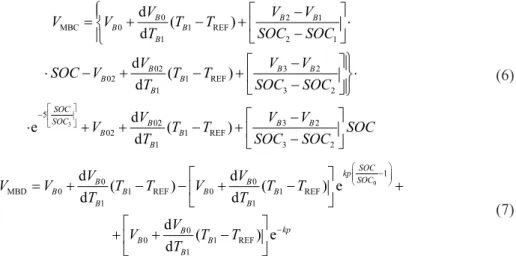
5 3 MBC 1 2 2 e SOC SOC C C C V f f f − = − + (5)The function of the VMBC battery charge curve in eq. (5) is the function of the curve
fC1 and the curve fC2 is the curve function in the second case. In this equation, the difference
between the functions fC1 and fC2 in the first section is multiplied by an exponential coefficient.
This coefficient is chosen because the e–5 value is close to zero. The value –5 is selected because
the closest value to the bending point of functions fC1 and fC2 gives e–5. In the equation, the fC1
function is first plotted for the SOC1 initial values, then the e–5 value approaches zero when it
reaches the SOC3 value. This will complete the curve drawing in the equation that will only
retain the fC2 function.
The variation of the battery according to the charging voltage value and the SOC of the battery are obtained by eq. (6). The voltage of battery calculated in battery charge modelling studies is represented by VMBC. The VMBC voltage matrix obtained from battery charge modelling
studies and the values obtained from experimental results are plotted on the same graph.
Battery discharge modelling with temperature effect
In the case of battery discharge modelling studies, the variation of the voltage at the terminals of the terminal according to the SOC of the battery is given in case of discharging of a sample battery in fig. 2. The discharge curves of all the batteries constructed in this study are based on this curve type in terms of basic structure. Therefore, the extraction of the model equation of such a curve will form the basis of all discharge modelling work as it is in charge modelling studies. The change in discharge voltage can be defined by a single function as
shown in the graphic in fig. 2.
The fD function used for battery discharge
modelling in different temperatures is given in eq. (7). The VB0 in eq. (7) is the starting point of
the voltage at the terminal terminals of the bat-tery of the discharge curve, SOC is the batbat-tery occupancy rate in percent, SOC0 is the
param-eter which defines the function in percent, the parameter is the parameter which determines the angle of bending of the curve, which is the intersection of the SOC1 and VB1 points of the kp value battery discharge curve. The voltage of
Figure 2. Typical discharge voltage SOC graph for lead-acid batteries under different temperatures VMBD VB1 VB0 55 °C > 45 °C > 35 °C Batter y voltage[ V ]
Battery charge graphs in different temperatures TB1TB2TB3
TREF= 25 °C / 77 °F
TB3>TB2>TB1
Battery SOC [%]
SOC1 SOC0 Curving point atwich the kp
battery calculated in battery discharge modelling studies in different temperatures is represented by VMBD. The VMBD voltage equation obtained from the battery discharge modelling studies and
the values obtained from the experimental results are plotted on the same graph and compared. In eq. (7), when the SOC value is the maximum, that is, when the SOC value is equal to SOC0, the exponent is equal to zero. In this case, only the exponential coefficient VB0 of the
function remains –kp. This value also points to VB0, the starting position of the curve. Then,
depending on the time-varying values of the SOC, the battery discharge curve descends down to SOC0.
As in battery charging tests, different battery types are subjected to the same discharge currents at different temperatures during discharge tests. The voltage at the terminals of the battery at different temperatures varies according to the SOC of the battery. So the SOC0 value
of the battery discharge curve is getting smaller. The difference in these graphs is actually the variation of the SOC0 value and the kp coefficient given in eq. (7). These SOC0 and kp
coeffi-cients are determined by the results obtained from different discharge values.
Thus, in case of changing the temperature of the battery, it is possible to estimate the change of the battery fullness state by the same equation structure in the direction of the data taken from the experimental results:
3 0 2 1 MBC 0 1 REF 1 2 1 02 3 2 02 1 REF 1 3 2 5 02 3 2 02 1 REF 1 3 2 d ( ) d d ( ) d d e ( ) d B B B B B B B B B B B B SOC SOC B B B B B B V V V V V T T T SOC SOC V V V SOC V T T T SOC SOC V V V V T T SOC T SOC SOC − − = + − + ⋅ − − ⋅ − + − + ⋅ − − ⋅ + + − + − (6) 0 1 0 0 MBD 0 1 REF 0 1 REF 1 1 0 0 1 REF 1 d ( ) d ( ) e d d d ( ) e d SOC kp SOC B B B B B B B B kp B B B B V V V V T T V T T T T V V T T T − − = + − − + − + + + − (7) The kp value here determines the curve point in the discharge curve of the battery.
Af-ter obtaining the experimental results, the simulation model is compared with the actual model. These kp coefficients are determined as a result of comparison and the kp values obtained during
experimental studies are given in tab. 1.
Table 1. The kp coefficients obtained during battery discharge experimental studies
Lead-acid Ni-MH Lithium-ion
Temperatures Discharge rates Discharge rates Discharge rates
1A 2A 1A 2A 1A 2A
–10° C (14 °F) kp = 2.23 kp = 2.46 kp = 2.61
0 °C (32 °F) kp = 2.23 kp = 2.46 kp = 2.61
20 °C (68 °F) kp = 2.23 kp = 2.46 kp = 2.61
The battery model developed in the study includes both electrical and thermal model. In this way, modelling of different types of batteries has been realized by considering the tem-perature effect with a single mathematical model. Battery charge and discharge modelling re-sults are compared with experimental studies and the error rate rere-sults are given for the modeled equations. The error rate amounts of the graphs calculated in the model with the data obtained in the battery charge and discharge experiments are determined:
100 B MB B B V V h V − = (8)
where VB is the battery terminal voltage and VMB – the battery terminal voltage value calculated
as model result. This voltage value is taken as VMBC for charge modelling value and VMBD for
discharge modelling value [28].
Experimental validation test bench
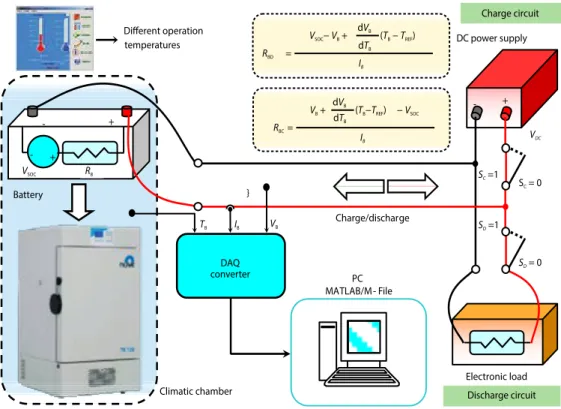
The battery will vary depending on the voltage at the battery terminals while charging and discharging due to chemical internal structure. For example, when the battery is connected to the charger, the source voltage is equal to the voltage at the terminal. However, if the ter-minals connected to the battery are removed, the voltage of the battery becomes small after a certain period of time. Likewise, the voltage reading during battery discharge is smaller than when the load is not connected. This is explained by the battery diffusion model [6]. Figure 3 shows the measurement points and the circuit diagram of the battery charge and discharge experiments.
Figure 3. Experimental test bench diagram of battery charge/discharge at climatic chamber
Battery - + DC power supply IB RBC= - + VSOC RB - + Electronic load IB ( −TB TREF) dTB dVB VSOC−VB+ RBD = SC=1 Charge circuit IB VDC VB Discharge circuit Different operation temperatures DAQ converter } TB PC MATLAB/M - File Charge/discharge Climatic chamber ( −TBTREF) dTB dVB VB+ − VSOC S = 0C SD=1 SD= 0
Battery modelling experiments were carried out taking into account battery diffusion model behavior. During this modelling study, the batteries were charged and discharged in different temperatures in the climatic chamber. The dynamic internal resistance of the battery was calculated by these current and voltage values. Then the voltage at the ends of the battery was measured after the source connection was cut off and recovery of the cells of the battery was expected. This measured battery voltage gives information on the SOC of battery, which is proportional to the charge level occupancy rate. In experimental studies, coulomb-counting method was used to determine the charge status of the batteries and is given in eq. (9). During battery discharge, current and voltage values were measured with a digital analog converter card. These current and voltage values provide information about the dynamic internal resis-tance of the battery. Then, the charge is separated from the battery terminals, as is the case during charging. The battery is expected to recover again. The battery voltage level remains constant during this time of 15-30 seconds. The voltage level of the battery is measured and recorded while the battery terminals are disconnected.
1 3600 1 IB 100 SOC Ah = − ⋅
∫
(9) In this study, eq. (10) is used to calculate the dynamic internal resistance of the battery after receiving the charging results of the batteries. The battery voltage is lower than the source voltage until the battery is fully charged while the battery is charging:REF SOC d ( ) d B B B B BC B V V T T V T R I + − − = (10)
If the battery is connected to the load while in the discharge state, the voltage value at the battery terminals will decrease by the previous value. The dynamic internal resistance of the battery while discharging is calculated:
SOC B d (d B B REF) B BD B V V V T T T R I − + − = (11)
where VB is the voltage at the terminals of the battery, VSOC – the internal source voltage of the
battery, which is associated with the occupancy of the battery represented in series with the battery, TB – the intermediate temperature value of the battery, TREF – the reference
tempera-ture point for the battery, IB – battery current during charging and discharging, RBC – dynamic
internal resistance of the battery in case of charging, and RBD – the represents dynamic internal
resistance in the case of discharge of the battery.
Summary of battery experimental studies
In this section, a summary of the results of experimental charging and discharging under different temperatures of three different batteries is given. The total battery capacity, charging and discharging currents, charging and discharging C ratios, capacity amounts in terms of mAh given to the battery and charging and discharging test periods are given in detail in tab. 2.
Table 2. Experimental parameter values of different types of batteries used in validation
Battery type
[Manufacturer] Experimental condition
Constant current [A] Battery voltage [V] Battery capacity [mAh] Battery rate [C] Elapsed time
[min] Given/Received capacity [mAh]
1A 2A 1A 2A Lead-acid [Hyundai] Charge 1 2 12 7200 0.13 0.26 350 190 5830 5700 Discharge 310 70 5160 5000 Ni-MH [Energizer] Charge 1 2 7.2 2300 0.43 0.86 110 65 1830 1750 Discharge 85 40 1416 1350 Li-ion [Panasonic] Charge 1 2 3.7 2150 0.46 0.92 95 50 1583 1450 Discharge 75 40 1250 1100
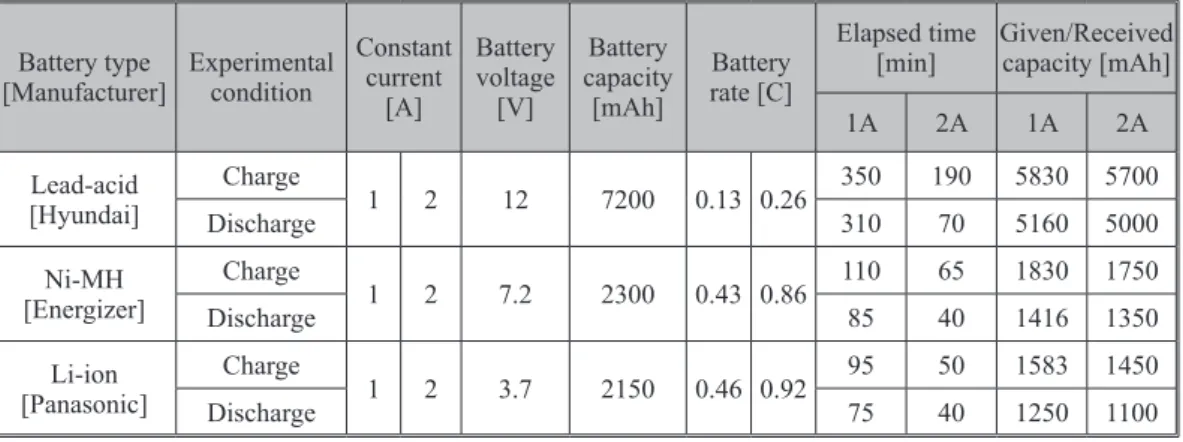
As the lead-acid battery, a battery with 12 V terminal voltage and 7200 mAh capacity was used. Figures 4(a) and 4(b) compares the values obtained from the experimental measure-ments of the lead-acid battery with the proposed mathematical model. Lead-acid battery is sup-plied by DC source with 1A and 2A charging. In the climatic chamber, the dynamic behavior of the battery was investigated in four different cases with temperature –10 °C, 0° C, 20 °C, and 40 °C. The lead acid 1A and 2A charge is the experimental and mathematical model comparison result. The error rate of the formula in eq. (8) is 1.252% at –10 °C, 0.902% at 0 °C, 1.163% at 20 °C, and 1.095% at 40 °C in 1A charging and 1.345% at –10 °C, 1.087% at 0 °C, 1.607% at 20 °C, and 1.298% at 40 °C in 2A charging. 0 10 20 30 40 50 60 70 80 90 100 0 2 4 6 8 10 12 14 B a tt e ry v o lt a g e V B , [V ] -– 10 °C (14 °F) 0 °C (32 °F) 20 °C (68 °F) 40 °C (104 °F) Experimental Proposed model -Experimental Proposed model Battery SOC [%] (a) (b) -– 10 °C (14 °F) 0 °C (32 °F) 20 °C (68 °F) 40 °C (104 °F) 0 2 4 6 8 10 12 14 B a tt e ry v o lt a g e V B , [V ] 0 10 20 30 40 50 60 70 80 90 100 Battery SOC [%]
Figure 4. Lead-acid battery charging in different temperature experimental and proposed model comparison; (a) the 1A charging; (b) the 2A charging
The experimental results were recorded by connecting the lead-acid battery at dif-ferent temperatures, with 1A and 2A discharge current by the electronic load. The measured discharge currents are plotted and the mathematical model discharge model is shown in fig. 5(a) and 5(b). Experimental Proposed model 0 10 20 30 40 50 60 70 80 90 100 Experimental Proposed model 0 2 4 6 8 10 12 14 B a tt e ry v o lt a g e V B , [V ] 0 2 4 6 8 10 12 14 B a tt e ry v o lt a g e V B , [V ] 0 10 20 30 40 50 60 70 80 90 100 -– 10 °C (14 °F) 0 °C (32 °F) 20 °C (68 °F) 40 °C (104 °F) -– 10 °C (14 °F) 0 °C (32 °F) 20 °C (68 °F) 40 °C (104 °F)
(a) Battery SOC [%] (b) Battery SOC [%]
Figure 5. Lead-acid battery discharging in different temperature experimental and proposed model comparison; (a) the 1A discharging, (b) the 2A discharging
As a result of the comparison, the error ratios were calculated as 1.401% at –10 °C, 1.224% at 0 °C, 1.365% at 20 °C, and 0.983% at 40 °C in 1A discharging and 1.563% at –10 °C, 1.302% at 0 °C, 1.564% at 20 °C, and
1.098% at 40° C in 2A discharging with given in eq. (8). The lead-acid battery internal resis-tance shows different values depending on dif-ferent temperature conditions in 1A.
The graph of the change in the internal resistance of the lead-acid battery during 1A charging/discharging under different tempera-tures is given in fig. 6. In eq. (9), the dynamic internal resistance of the lead-acid battery
de-creases as the temperature inde-creases. The internal resistance of the lead acid battery used in the experimental studies was calculated to be 1.206 Ω at –10 °C.
As the battery charges, this dynamic internal resistance gradually decreases and is about 0.385 Ω. The 6 serial 2300 mAh batteries with 1.2 V cell voltages were used in the exper-iment with Ni-MH batteries. This battery group voltage is 7.2 V in total. Figures 7(a) and 7(b) gives the experimental results of 1A and 2A at –10 °C, 0 °C, 20 °C, and 40 °C of the Ni-MH battery and the mathematical model result comparison.
0 10 20 30 40 50 60 70 80 90 100 0 1 2 3 4 5 6 7 8 Experimental Proposed model 0 10 20 30 40 50 60 70 80 90 100 0 1 2 3 4 5 6 7 8 Experimental Proposed model (a) (b) B a tt e ry v o lt a g e V B , [V ] B a tt e ry v o lt a g e V B , [V ] 0 °C (32 °F) 20 °C (68 °F) 40 °C (104 °F) 0 °C (32 °F) 20 °C (68 °F) 40 °C (104 °F)
Battery SOC [%] Battery SOC [%]
Figure 7. The Ni-MH battery charging in different temperature experimental and proposed model comparison; (a) the 1A charging, (b) the 2A charging
The error rate of the Ni-MH battery using eq. (6) is 1.671% at –10 °C, 0.889% at 0 °C, 1.567% at 20 °C, and 1.310% at 40 °C in 1A charging and 1.772% at –10 °C, 0.971% at 0 °C, 1.634% at 20 °C, and 1.501% at 40 °C in 2A charging.
Figures 8(a) and 8(b) shows the experimental results of the Ni-MH battery under different discharge conditions under 1A, 2A and the comparison of the proposed mathematical model. This comparison, it is estimated that the error rates according to eq. (8) are 1.626% at –10 °C, 0.834% at 0 °C, 1.057% at 20 °C, and 1.318% at 40 °C in case of Ni-MH battery in 1A discharging and 1.713% at –10 °C, 1.921% at 0 °C, 1.230% at 20 °C, and 1.486% at 40 °C in 2A discharging. 0 10 20 30 40 50 60 70 80 90 100 0 1 2 3 4 5 6 7 8 Experimental Proposed model 0 10 20 30 40 50 60 70 80 90 100 0 1 2 3 4 5 6 7 8 Experimental Proposed model B a tt e ry v o lt a g e V B , [V ] B a tt e ry v o lt a g e V B , [V ] (a) (b) 0 °C (32 °F) 20 °C (68 °F) 40 °C (104 °F) 0 °C (32 °F) 20 °C (68 °F) 40 °C (104 °F)
Battery SOC [%] Battery SOC [%]
Figure 8. The Ni-MH battery discharging in different temperature experimental and proposed model comparison; (a) the 1A discharging, (b) the 2A discharging
Figure 6. Lead-acid battery experimental charge/discharge internal resistance for 1A
0 10 20 30 40 50 60 70 80 90 100 0 0.4 0.8 1.2 1.6 2 In te rn a l re si st a n ce R B , [o h m ] Charge experimental Discharge experimental -– 10 °C (14 °F) 0 °C (32 °F) 20 °C (68 °F) 40 °C (104 °F) Battery SOC [%]
Figure 9 shows the dynamic internal resistance change graph of the battery during 1A charging/discharging under Ni-MH battery different operating temperatures. The internal resistance of the Ni-MH battery starts at 0.413 Ω during charging, and the charge decreases to approximately 0.1 Ω. As shown here, the dynamic internal resistance change of the Ni-MH battery during discharge is different from that of charging. The internal resistance change range (–10-40°C) of the battery at different temperatures is approximately 0.112 Ω.
One of the most important points to note here is that a lithium-ion battery should be charged in a controlled way as the SOC increases. It is understood from fig. 9 that the lithi-um-ion batteries should first be charged with constant current and then with constant voltage as the charge topology. The error rates of the lithium-ion battery and under different temperature were calculated as 1.748% at –10°C, 1.134% at 0 °C, 0.961 at 20° C and 1.408% at 40 °C in 1A charging and 1.821% at –10 °C, 1.258% at 0 °C, 1.271% at 20 °C, and 1.597% at 40 °C in 2A charging.
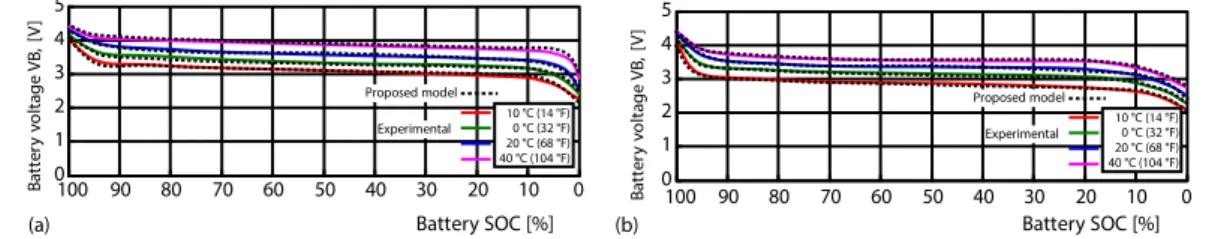
Experimental studies have used a 2150 mAh lithium-ion battery with 3.7 V terminal voltages. Figure 10(a) and 10(b) shows the comparison results of the lithium-ion battery in a climatic chamber with a DC source current of 1A and 2A charging.
0 10 20 30 40 50 60 70 80 90 100 0 1 2 3 4 5 Experimental Proposed model 0 10 20 30 40 50 60 70 80 90 100 0 1 2 3 4 5 Experimental Proposed model (a) (b) B a tt e ry v o lt a g e V B , [V ] B a tt e ry v o lt a g e V B , [V ] 0 °C (32 °F) 20 °C (68 °F) 40 °C (104 °F) 0 °C (32 °F) 20 °C (68 °F) 40 °C (104 °F)
Battery SOC [%] Battery SOC [%]
Figure 10. Lithium-ion battery charging in different temperature experimental and proposed model comparison; (a) the 1A charging, (b) the 2A charging
Figures 11(a) and 11(b) shows the comparison of the terminal voltage changes at different temperatures with the mathematical model of the lithium-ion battery under 1A and 2A by discharging under the electronic load. According to eq. (8), the error rates were calcu-lated as 0.854% at –10 °C, 1.021% at 0 °C, 1.437% at 20 °C, and 1.329% at 40 °C in 1A dis-charging and 0.972% at –10 °C, 1.375% at 0 °C, 1.567% at 20 °C, and 1.438% at 40 °C in 2A discharging for the lithium-ion battery.
0 10 20 30 40 50 60 70 80 90 100 0 1 2 3 4 5 Experimental Proposed model 0 10 20 30 40 50 60 70 80 90 100 0 1 2 3 4 5 Experimental Proposed model (a) (b) B a tt e ry v o lt a g e V B , [V ] 0 °C (32 °F) 20 °C (68 °F) 40 °C (104 °F) 0 °C (32 °F) 20 °C (68 °F) 40 °C (104 °F) B a tt e ry v o lt a g e V B , [V ] Battery SOC [%] Battery SOC [%]
Figure 11. Lithium-ion battery discharging in different temperature experimental and proposed model comparison; (a) the 1A discharging, (b) the 2A discharging
Figure 9. The Ni-MH battery experimental charge/discharge internal resistance for 1A
0 10 20 30 40 50 60 70 80 90 100 0 0.2 0.4 0.6 0.8 1 In te rn a l re si st a n ce R B , [o h m ] Charging experimental Discharging experimental 0 °C (32 °F) 20 °C (68 °F) 40 °C (104 °F) Battery SOC [%]
Figure 12 shows the change in the dy-namic internal resistance of the lithium-ion battery cell during 1A charging/discharging under different temperatures. During charging, the internal resistance of the battery decreas-es from 0.207-0.124 Ω, and during discharge, starts from 0.109 Ω at the start and reaches up to 0.253 Ω at the end of the test.
The electrical characteristics of the bat-teries vary depending on the temperature. As
the operating temperature of the batteries decreases, the ion exchange between the cells slows down. On the contrary, when the operating temperature of the batteries increases, the chemical process accelerates. Under the same conditions, the voltage value of the batteries at low tem-perature is low while the voltage value of the batteries at high temtem-perature is high. Therefore, different charge or discharge times occur at different temperatures for the same battery.
When the dynamic internal resistance of the lithium-ion battery is too low, it increases the maximum power value that can be taken from the battery. At the same time, as the value of voltage on the dynamic internal resistance decreases, waste/loss energy on the battery decreases the energy and turns it into a more efficient battery. Because of these properties, lithium-ion batteries are now a high efficiency battery with high energy density.
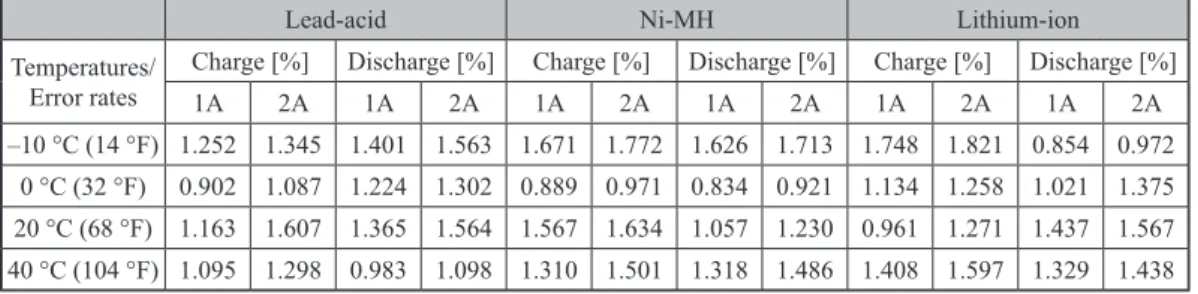
In this study, experimental results were obtained by charging/discharging lead-acid, Ni-MH and lithium-ion battery types with different current, 1A and 2A, at different temperature conditions (–10 °C, 0 °C, 20 °C, and 40 °C). Accurate modelling of battery and defining of the parameters in low error rate is not only important for controlling energy storage systems but also improve the lifetime and ensure safe operation of the energy storage systems components. The main aim of this study is modelling and analysis of these energy storage units in low error rate and determines the operational parameters. In this paper, modelling of battery that is components of energy storage system has been performed. Graphics and results were obtained with MAT-LAB/M-File program by using experimental results. In tab. 3, error rates are given as a result of comparison between experimental measurements and proposed mathematical modelling results.
Table 3. Error rates in the proposed mathematical modelling study results under different operating conditions
Lead-acid Ni-MH Lithium-ion
Temperatures/ Error rates
Charge [%] Discharge [%] Charge [%] Discharge [%] Charge [%] Discharge [%]
1A 2A 1A 2A 1A 2A 1A 2A 1A 2A 1A 2A –10 °C (14 °F) 1.252 1.345 1.401 1.563 1.671 1.772 1.626 1.713 1.748 1.821 0.854 0.972 0 °C (32 °F) 0.902 1.087 1.224 1.302 0.889 0.971 0.834 0.921 1.134 1.258 1.021 1.375 20 °C (68 °F) 1.163 1.607 1.365 1.564 1.567 1.634 1.057 1.230 0.961 1.271 1.437 1.567 40 °C (104 °F) 1.095 1.298 0.983 1.098 1.310 1.501 1.318 1.486 1.408 1.597 1.329 1.438 Conclusions
In this study, the battery charge/discharge tests are taken at different current and tem-perature conditions and the SOC of battery estimation is done by the mathematical modelling studies. If the battery exceeds the charging voltage given in the catalog information, the dis-tance between the cells of the battery is observed to increase physically. The parameters were
Figure 12. Lithium-ion battery experimental charge/discharge internal resistance for 1A
0 10 20 30 40 50 60 70 80 90 100 0 0.1 0.2 0.3 0.4 0.5 Charging experimental Discharging experimental In te rn a l re si st a n ce R B , [o h m ] 0 °C (32 °F) 20 °C (68 °F) 40 °C (104 °F) Battery SOC [%]
obtained by determining the total capacity change in battery charging and discharging mod-elling studies in the direction of these experiments. These modmod-elling studies are obtained by
curve fitting method. The proposed modelling equations allow comparison of charge/discharge
experiments for batteries. Battery charge/discharge modelling studies were performed at dif-ferent current and temperature values to compare the correctness of the equations and a math-ematical model with acceptable error rates was established. The proposed mathmath-ematical model includes both electrical and thermal models to estimate capacity for actual operating states of the batteries. As a result of the comparison, the lead-acid battery charge model with maximum 1.607%, discharge model maximum 1.564%, Ni-MH charge model maximum 1.772%, dis-charge model maximum 1.713% and Li-ion dis-charge model maximum 1.821%, disdis-charge model with maximum 1.567% error rates has been observed.
It has been observed that as the temperature increases, the capacity of the battery increases. However, this temperature limit should not disservices the battery. It has been observed that the batteries have a cut-off/end voltage quickly approaching the working con-ditions at cold temperatures. It is recommended that batteries should not be lowered to 10 V for lead-acid, 1 V for Ni-MH (single cell voltage) and 3 V for lithium-ion batteries in terms of health and cycle life.
Acknowledgment
This study was financially supported by within TUBITAK project number of 117E767.
Nomenclature
fC1 – battery charge curve 1st functions
fC2 – battery charge curve 2nd functions
hB – error ratio in proposed battery modelling
IB – battery experimental current during charging and discharging, [A]
kp – battery discharge curve m1 – slope of the function fC1
m2 – slope of the function fC2
RBC – dynamic internal resistance of the battery in case of charging, [Ω]
RBD – dynamic internal resistance of the battery in case of discharge, [Ω]
SOC1-SOC3 – the SOC of battery intermediate
values, [%]
TB – battery temperature value, [°C-°F]
TREF – reference temperature point for the battery,
[°C-°F]
VB – battery terminals voltage, [V]
VB0 – battery terminal voltage at the start of the function fC1, [V]
VB02 – battery terminal voltage at the start of the function fC2, [V]
VB1-VB3 – battery voltage intermediate values, [V]
VMB – calculated battery terminal voltage, [V]
VMBC – battery charge modelling, [V]
VMBD – battery discharge modelling, [V]
Acronyms
Ni-MH – nickel- metal hydride SOC – battery state of charge References
[1] Whittingham, M. S., History, Evolution, and Future Status of Energy Storage, Proceedings of the IEEE
Issue Special Centennial, 100 (2012), 1, pp. 1518-1534
[2] Scrosati, B., Garche, J., Lithium Batteries: Status, Prospects and Future, Journal of Power Sources, 195 (2010), 1, pp. 2419-2430
[3] Xiaosong, H., et al., Model-Based Dynamic Power Assessment of Lithium-Ion Batteries Considering Different Operating Conditions, IEEE Trans. Industr. Informatics, 10 (2014) 3, pp. 1948-1959
[4] Maryam, B., et al., Enhanced Equivalent Electrical Circuit Model of Lithium-Based Batteries Accounting for Charge Redistribution, State-of-Health, and Temperature Effects, IEEE Trans. on Trans. Electr., 3 (2017), 3, pp. 589-599
[5] Xiaoming, W., et al., Performance Analysis of a Novel Thermal Management System with Composite Phase Change Material for a Lithium-Ion Battery Pack, Energy, 156 (2018), 1, pp. 154-168
[6] Chunrong, Z., et al., Thermal Behavior Study of Discharging/Charging Cylindrical Lithium-Ion Battery Module Cooled by Channeled Liquid-Flow, Int. J. Heat Mass Transf., 120 (2018), 1, pp. 751-762
[7] Wen, Y. L., et al., Modelling of Lithium-titanate Battery with Ambient Temperature Effect for Charger Design, The Inst. of Eng. and Technol., 9 (2006), 6, pp. 1204-1212
[8] Ke, L., et al., Water Cooling Based Strategy for Lithium Ion Battery Pack Dynamic Cycling for Thermal Management System, Appl. Therm. Eng., 132 (2018), 1, pp. 575-585
[9] Chuang, Q., et al., Mathematical Model for Thermal Behavior of Lithium Ion Battery Pack under Over-charge, Int. J. Heat Mass Transf., 124 (2018), 1, pp. 552-563
[10] Ti, D., et al., Numerical Modelling and Analysis of The Thermal Behavior of Ncm Lithium-Ion Batteries Subjected to Very High C-Rate Discharge/Charge Operations, Int. J. Heat Mass Transf., 117 (2018), 1, pp. 261-272
[11] Eneko, U., et al., Li-ion Battery Modelling Optimization Based on Electrical Impedance Spectroscopy Measurements, Proceedings, Int. Symp. on Power Electronics, Electrical Drives, Automation and Motion, Ischia, Italy, 2014, pp. 154-160
[12] Hamidi, S. A., et al., Modelling and Management of Batteries and Ultracapacitors for Renewable Energy Support, Electric Power Comp. and Syst., 43 (2015), 1, pp. 1434-1452
[13] Cao, J., et al., Thermal Modelling of Passive Thermal Management System with Phase Change Material for LiFeP04 Battery, Proceedings, in: Conf. IEEE Vehicle Power and Propulsion, Seoul, Korea, 2012,
pp. 436-440
[14] Chen, M., Rincon-Mora, G. A., Accurate Electrical Battery Model Capable of Predicting Runtime and I-V Performance, IEEE Trans. Eng. Conv., 21 (2006), 1, pp. 504-51
[15] Rakhmatov, D., et al., A Model for Battery Lifetime Analysis for Organizing Applications on a Pocket Computer, IEEE Trans. VLSI Systems, 11 (2003), 1, pp. 1019-1030
[16] Mehrdad, M., et al., Electrochemical-Thermal Modelling and Experimental Validation of Commercial Graphite/Lifepo4 Pouch Lithium-Ion Batteries, Int. J. Therm. Sci., 129 (2018), 1, pp. 218-230
[17] Shang, S., et al., Non-Steady Experimental Investigation on an Integrated Thermal Management System for Power Battery with Phase Change Materials, Energy Convers. Manag., 138 (2017), 1, pp. 84-96 [18] Jaeshin, Y., et al., The 3-D Modelling of the Thermal Behavior of a Lithium-Ion Battery Module for
Hy-brid Electric Vehicle Applications, Energies, 7 (2014), 1, pp. 7586-7601
[19] Jaeshin, Y., et al., Modelling the Effect of Aging on the Electrical and Thermal Behaviors of a Lithium-Ion Battery during Constant Current Charge and Discharge Cycling, Comput. Chem. Eng., 99 (2017), 1, pp. 31-39
[20] Kaiyuan, L., et al., A Practical Lithium-Ion Battery Model for State of Energy and Voltage Respons-es Prediction Incorporating Temperature and Ageing Effects, IEEE Trans. Ind. Electron., 65 (2018), 8, pp. 6696-6708
[21] Giuseppe, G., et al., Model-Based Lithium-Ion Battery Resistance Estimation From Electric Vehicle Op-erating Data, IEEE Trans. Veh. Technol., 67 (2018), 5, pp. 3720-3728
[22] Gao, J., et al., A Real-Time Joint Estimator for Model Parameters and State of Charge f Lithium-Ion Bat-teries in Electric Vehicles, Energies, 8 (2015), 1, pp. 8594-8612, 2015
[23] Lucia, H., et al., Electric Vehicles Batteries Thermal Management Systems Employing Phase Change Materials, Journal Power Sources, 378 (2018), 1, pp. 383-403
[24] Souleman, N. M., et al., A Generic Electrothermal Li-Ion Battery Model for Rapid Evaluation of Cell Temperature Temporal Evolution, IEEE Trans. Ind. Electron., 64 (2017), 2, pp. 998-1008
[25] Ying, X., Babak, F., Electrothermal Modelling and Experimental Validation of a LiFePO4 Battery Cell,
Pro-ceedings, Conf. IEEE Transportation Electrification Conference and Expo (ITEC), Dearborn, USA, 2014,
pp. 978-982
[26] Arpit, M., et al., A Modelling Approach to Understand Charge Discharge Differences in Thermal Be-haviour in Lithium Iron Phosphate – Graphite Battery, Electrochim. Acta, 243 (2017), 1, pp. 129-41 [27] Yitao, Y., et al., Effects of Battery Design, Environmental Temperature and Electrolyte Flowrate on
Ther-mal Behaviour of a Vanadium Redox Flow Battery in Different Applications, Journal of Energy Storage,
11 (2017), 1, pp. 104-118
[28] Jongerden, M. R., Haverkort, R., Which Battery Model to Use, IEEE IET Software, 3 (2009), 1, pp. 445-457
Paper submitted: April 1, 2019 Paper revised: July 25, 2019 Paper accepted: August 2, 2019
© 2020 Society of Thermal Engineers of Serbia Published by the Vinča Institute of Nuclear Sciences, Belgrade, Serbia. This is an open access article distributed under the CC BY-NC-ND 4.0 terms and conditions

![Figure 2. Typical discharge voltage SOC graph for lead-acid batteries under different temperatures V MBDVB1VB055 °C > 45 °C > 35 °CBattery voltage[V]](https://thumb-eu.123doks.com/thumbv2/9libnet/4370548.73509/4.892.206.739.249.357/figure-typical-discharge-voltage-batteries-different-temperatures-cbattery.webp)