ORIGINAL PAPER
Psychometric Characteristics of the Turkish Version
of the Nurse Comfort Questionnaire
Şebnem Cinar Yucel1 · Gamze Goke Arslan2 · Eda Ergin3 · Sema Kuguoglu4
Published online: 4 June 2019
© Springer Science+Business Media, LLC, part of Springer Nature 2019
Abstract
The aim of this study was to determine psychometric characteristics of the Turk-ish version of the Nurse Comfort Questionnaire (NCQ). The sample of the study comprised 275 nurses in the western part of Turkey. To collect the study data, the Sociodemographic Characteristics Questionnaire and NCQ were used. After the statistical analyses conducted to determine the validity and reliability of the Turk-ish version of the Ferrandiz and Martin-Baena’s NCQ, some items were excluded from the original questionnaire, and a 39-item NCQ for Turkey was developed. The analyses showed that the 39-item NCQ had a valid and reliable structure of Turkish nurses.
Keywords Nurse Comfort Questionnaire · Comfort theory · Nursing · Reliability · Validity
* Eda Ergin
[email protected] Şebnem Cinar Yucel [email protected]
Gamze Goke Arslan [email protected]
Sema Kuguoglu [email protected]
1 Department of Fundamentals Nursing, Ege University Nursing School, 35000 Izmir, Turkey 2 Department of Fundamentals Nursing, Karamanoğlu Mehmetbey University, 70200 Karaman,
Turkey
3 Department of Fundamentals Nursing, Faculty of Health Sciences, Manisa Celal Bayar
University, 45000 Manisa, Turkey
Introduction
Kolcaba defined comfort as follows: “an expected result with a complex structure within the physical, psycho spiritual, social and environmental integrity related to the needs of an individual for ease, relief and transcendence” (Kolcaba and Kolcaba
1991; Kolcaba 1992, 1994). Kolcaba analyzed the taxonomic structure of comfort theory in two stages (Kolcaba 2001). The theory of comfort discusses comfort at three levels, namely ease, relief and transcendence which refers to an individual’s being able to overcome his/her problems depending on the intensity of the individ-ual’s met and unmet needs, and in four dimensions, namely physical comfort, psy-chology comfort, sociocultural comfort and environmental comfort resulting from the holistic approach (Table 1) (Kolcaba and Kolcaba 1991).
While developing the framework of her theory, Kolcaba benefited from Ida Jean Orlando, Virginia Henderson and Paterson to create the three levels of comfort, namely ease, relief and transcendence (Kolcaba 2001).
Dimensions of Comfort
Physical Comfort This dimension refers to factors affecting a person’s physical con-ditions such as rest and relaxation, nutrition and hydration (Kolcaba 2003).
Psycho-spiritual Comfort This dimension consists of mental, emotional and spir-itual components. The concept of self, which gives meaning to an individual’s life, includes feelings related to sexuality and self-awareness (Yücel 2011).
Environmental Comfort External factors include the effects of circumstances on human. Brightness, noise, color, heat and light are concepts related to the external environment (Yücel 2011).
Sociocultural Comfort This dimension is related to traditions, rules and religious and legal features that regulate societal and interpersonal relationships (Yücel 2011; Erdemir and Çırlak 2013).
Comfort Levels
Relief The circumstance felt by an individual after getting rid of his/her boredom when his/her comfort needs are met (Kolcaba 2003; Yücel 2011).
Table 1 Taxonomic structure of comfort theory*
* Kolcaba (2003), Kolcaba and Dimarco (2005)
Comfort Levels
Dimensions Relief Ease Transcendence
Physical Psycho-spiritual Environmental Sociocultural
Ease State of tranquility, contentment and peacefulness (Kolcaba 2003; Yücel
2011).
Transcendence An individual’s being able to overcome his/her problems (Karaba-cak and Acaroğlu 2011; Kolcaba 2003; Yücel 2011).
As a result of the evaluation performed after Kolcaba included comfort in nursing care, she emphasized that the use of comfort measurement methods in meeting the comfort needs increased the importance of meeting comfort needs. With this object in mind, she developed questions to assess patients’ and nurses’ comfort (Karaba-cak and Acaroğlu 2011; Kolcaba 2003; Yücel 2011). The questions were aimed at assessing nurses in terms of stress, anxiety, satisfaction and work environment. These assessment criteria are stated to be directly related to nurses’ comfort levels. While studies conducted in English-speaking countries have demonstrated the rela-tionship between nurses’ comfort levels (Goodwin and Candela 2013; Krinsky et al.
2014) and the quality of care they give, the gap in Turkish literature on this subject indicates the importance of conducting studies to assess the comfort levels of nurses working in Turkey.
The theory of comfort is used as a guide by the researchers and has been used in many areas such as cardiac catheterization, intensive care, nursing home, infertility, radiation therapy, emergency, orthopedic nursing, nursing care, hospitalized elderly, bladder control, birth and stressed university students (Ocakçı and Alpar 2013). Several comfort questionnaires adapted to specific languages or developed from the comfort theory are available in Turkish, Portuguese, Italian, Spanish and Persian. Of them, the General Comfort Questionnaire, Perianesthesia Comfort Scale, Uri-nary Frequency and UriUri-nary Comfort Scale, Radiotherapy Comfort Scale, Holistic Family Comfort Scale, Birth Comfort Scale and Immobilization Comfort Scale are the ones adapted to Turkish by nurse researchers (Kuğuoğlu and Karabacak 2008; Üstündağ and Eti Aslan 2010; Zengin 2010; Karabacak and Acaroğlu 2011; Çırlak and Erdemir 2013; Tosun et al. 2015; Potur et al. 2015). The Postpartum Comfort Scale and the Hemodialysis Comfort Scale were developed in Turkish (Karakaplan and Yıldız 2010; Orak et al. 2017).
Taking this gap in Turkish literature into consideration, the present study was car-ried out to determine the usability of the Nurse Comfort Questionnaire in Turkish society.
Methods Participants
This methodological study was carried out in order to evaluate the validity and reli-ability of the Turkish version of the Nurse Comfort Questionnaire. The population of the study consisted of nurses working in a university hospital in Izmir, a province in western Turkey, between October 5, 2015, and December 31, 2015. In scale valid-ity reliabilvalid-ity studies, the sample size is recommended to be fivefold to tenfold the number of the items in the scale (Şencan 2005). The sample of the study comprised
275 nurses who accepted to participate in the study between October 5, 2015, and December 31, 2015.
Data Collection and Instruments
To collect the study data, the Sociodemographic Characteristics Questionnaire and Nurse Comfort Questionnaire (NCQ) were used. The 8-item questionnaire was developed by the researchers to determine the sociodemographic characteristics of the participants. The validity and reliability study of the Nurse Comfort Ques-tionnaire, the Spanish version of the General Comfort Questionnaire developed by Kolcaba, was conducted by Ferrandiz and Martin-Baena by taking the three levels and four dimensions which constitute the theoretical components of comfort pro-posed by Kolcaba in her taxonomic structure of the concept of comfort into account (Ferrandiz and Martin-Baena 2015). The Questionnaire consists of 48 items rated on a 4-point Likert scale ranging from 1 (strongly disagree) to 4 (strongly agree). Response patterns of the Questionnaire consisting of positive and negative items are given in a mixed order. Of the 48 items, 28 are positively keyed and 20 are nega-tively keyed. Negative items are reverse scored. While the high score (4) shows high comfort level and the low score (1) shows low comfort in positively keyed items, the low score (1) shows high comfort level and the high score (4) shows low comfort level in negatively keyed items (Ferrandiz and Martin-Baena 2015).
The items in the Questionnaire are given in the social, psycho-spiritual, physical and environmental sub-dimensions as follows:
1. Social (P1) I feel relaxed at work; (P3) I have enough support; (P9) I feel my work is valued; (P10) I am inspired by knowing that I am part of a team; (P11) These surroundings are pleasant; (P15) I am inspired to do my best; (P18) I feel like I belong here; (P19) My work breaks refresh me; (P23) I am being treated fairly; (P30) The mood around here uplifts me; (P36) I work well with my administra-tors and leaders; (P38) I am encouraged to make important patient care decisions; (P43) Appropriate lighting contributes to my well-being; (P44) Most of my work is true nursing work; (P47) My schedule fits my life-style (Ferrandiz and Martin-Baena 2015).
2. Psycho-spiritual (P2) I feel competent; (P4) There are those I can depend on when I need help; (P5) I don’t want to come to work; (P7) I feel confident; (P8) I feel like I don’t belong here; (P13) No one understands me; (P14) My fatigue is difficult to endure; (P16) I am unhappy when I am at work; (P17) My values do not fit with this institution; (P20) I do not feel healthy right now; (P21) This work makes me feel scared; (P28) I am angry; (P29) I can rise above my concerns; (P31) I am content; (P33) My patient care is personalized; (P35) I feel out of place here; (P37) I don’t have many friends at work; (P42) When I am asked to precept a student or new nurse, it is a burden; (P45) I intend to stay here (Ferrandiz and Martin-Baena 2015).
3. Physical (P25) I eat a meal off the unit every day; (P27) The temperature on this unit is fine; (P40) Here, all nurses are considered leaders; (P46) I feel my career is
upwardly mobile; (P48) Patient rooms are easy to work in (Ferrandiz and Martin-Baena 2015).
4. Environmental (P6) My work load gets me down; (P12) The background noise is nerve-racking; (P22) I am afraid for my future; (P24) I have experienced changes which make me feel uneasy; (P26) I would like to see my clinical leaders more often; (P32) My body aches from my work; (P34) I have few opportunities to be a change agent; (P39) I do not receive positive reinforcement here; (P41) There is not enough cooperation among departments or disciplines here (Ferrandiz and Martin-Baena 2015).
Procedure Validity
Language Adaptation The most appropriate wording and phrases in the target lan-guage should be used, and the sentences should be adapted to the target culture when translating a scale (Şencan 2005; Ferrandiz and Martin-Baena 2015; Cam and Baysan-Arabacı 2010). In order to validate the language in accordance with the translation methodology of the scale; in the first stage, the translation into the target language (Turkish) and then back to the original language (English) was used. The scale was translated into Turkish by three linguists of the English language. The translations were evaluated by the researchers; the most appropriate translation for each item was determined, and the scale was finalized. The Turkish form and the original language form were controlled by an academician nurse living in America who is fluent in both English and Turkish. When the first English expressions were compared to the last English expressions, the expressions were consistent with each other.
Content Validity of the Questionnaire Expert opinion was obtained to establish the content validity of the NCQ. It is recommended to take opinions of at least three experts to determine whether the translated text is equivalent to the original text (Şencan 2005). To determine whether the Turkish version of the questionnaire was a valid one, opinions of ten experts were obtained. The original and translated ques-tionnaires were given to experts, and they were requested to score the items between 1 and 4 (1 point = not suitable, 2 points = requires revision, 3 points = suitable, but requires minor change and 4 points = very suitable) to determine whether the items were suitable. The items were revised in line with the recommendations by the experts. For each item, the Item Content Validity Index (M-CVI) and Scale-Related Validity Index (S-RVI) were calculated. That the M-CVI and S-CVI of the items are 0.80 or higher indicates the agreement between the experts (Polit et al. 2007).
Pilot Test It is recommended that a scale should be pilot tested on a group of 20 or 30 people with similar characteristics but not included in the study sample. A pilot study determines whether the language and statements in the scale are comprehen-sible (Şencan 2005; Cam and Baysan-Arabacı 2010). After the first translation, the
questionnaire was administered to 30 nurses with similar characteristics who were not included in the study sample.
Reliability
The reliability analysis of the questionnaire was performed in terms of its internal consistency and stability. Internal consistency was tested using Cronbach’s alpha coefficient, the item-scale correlation score and item-total correlation score. In the literature, Cronbach’s alpha internal consistency coefficient is stated to be at least 0.70 and close to 1 (Şencan 2005; Cam and Baysan-Arabacı 2010; Aksayan and Gözüm 2002). Item-total correlations are expected not to be negative and at least 0.20 (Aksayan and Gözüm 2002; Terwee et al. 2007). In order to determine the stability of the questionnaire, test–retest scores of the 30 nurses obtained from the measurements made at a fifteen-day interval were used. To evaluate the stability of the scale, the differences and the relationship between the first and second measurements were analyzed. In the literature, the correlation coefficient between the first and second evaluation is stated to be 0.70 and higher (Terwee et al. 2007).
The Construct Validity of the Scale The construct validity of the scale was
ana-lyzed using the explanatory and confirmatory factor analysis. Whether the data were adequate and suitable was analyzed using the Kaiser–Meyer–Olkin (KMO) coefficient and the Bartlett’s test of sphericity. For the factor analysis, Bartlett’s test of sphericity and KMO values are recommended to be p < 0.05 and ≥ 0.50, respectively (Aksayan and Gözüm 2002). To distribute the scale items to the fac-tors, the promax rotation method was used. To determine the most appropriate structure and the number of the factors, it is recommended that the eigenvalue should be ≥ 1 (Terwee et al. 2007). In the literature, it is emphasized that the factor load should be at least 0.30 (Cam and Baysan-Arabacı 2010). In the present study, the lowest factor value used to determine the factors in which the items were clas-sified was 0.30 (Terwee et al. 2007).
Another method used to analyze construct validity is the confirmatory fac-tor analysis. To perform the confirmafac-tory facfac-tor analysis, Pearson’s Chi-square, degree of freedom, the root mean square error of approximation (RMSEA), good-ness-of-fit index (GFI), incremental index (IFI) and Akaike information criterion (AIC) were analyzed. It is recommended that the result of the Chi-square value divided by the degree of freedom should be below 5, that the RMSEA should be below 0.08, that of the models included in the AIC, the one with the lowest value should be chosen, and that the other fit indices should be above 0.90 (Dursun and Kocagöz 2010).
Statistical Analysis The study data were analyzed using the Statistical Package for Social Sciences (SPSS) 22.0 and the AMOS program. Descriptive statistics were used to analyze the demographic data. Numbers, percentages, arithmetic mean,
standard deviation, Kaiser–Meyer–Olkin (KMO), Bartlett’s test of sphericity, Pearson’s correlation analysis, Cronbach’s alpha internal consistency analysis and paired-sample t test were used to evaluate the data. The validity of the question-naire was analyzed using the explanatory factor analysis and confirmatory factor analysis.
Results
The mean age of the nurses participating in the study was 32.17 ± 6.45. Of them, 58.9% (n = 162) were employed in the department of internal medicine, 41.1% (n = 113) were employed in the department of surgery, 85.1% (n = 234) had the bachelor’s degree, 5.1% (n = 14) had the associate degree, and 9.8% (n = 27) were the Vocational School of Health graduates.
In order to evaluate the content validity of the questionnaire, opinions of ten experts were obtained. The agreement between the experts was determined to range from 0.80 to 1 for each item (I-CVI) and as 0.99 for the overall questionnaire (S-CVI).
After the Cronbach’s alpha reliability analysis conducted to determine the inter-nal consistency of the NCQ, the interinter-nal reliability coefficient of the 48-item ques-tionnaire rated on a 4-point Likert-type scale was determined as 0.870 for the over-all questionnaire. Although the calculated Cronbach’s alpha value was sufficient, 8 items (6, 14, 26, 32, 33, 34, 40, 41) were removed from the questionnaire because they had a negative effect on reliability and the item-total correlation score for these items was less than 0.20 and negative; the reliability of the remaining 40-item tionnaire was recalculated. The internal reliability coefficient of the 40-item ques-tionnaire rated on a 4-point Likert-type scale was determined as 0.915. The analysis of the item-scale correlations of the 40-item NCQ revealed that the correlation val-ues were between 0.215 and 0.648.
In order to find out in how many and which dimensions the items of the ques-tionnaire were grouped, the factor analysis was performed. First, it was evaluated whether the data set to be analyzed was suitable for the analysis, and the Kai-ser–Meyer–Olkin (KMO) sample adequacy criteria were applied and the Bartlett’s test of sphericity which is used to assess whether there is correlation between the variables in the correlation matrix was performed. Based on this, the adequacy of the sample size calculated as KMO (0.891) and Bartlett’s test of sphericity (x2 = 4056.297, p = 0.000) value of the sample test size analysis were determined to be statistically significant for the factor analysis.
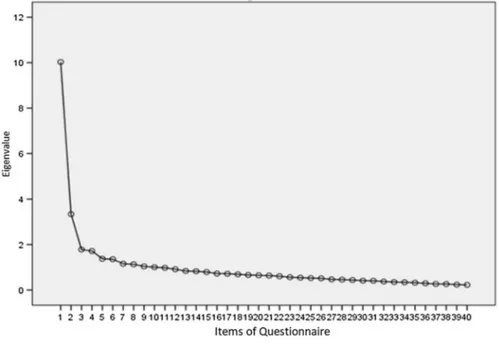
As a result of the explanatory factor analysis, it was determined that the items of the questionnaire were grouped under 11 dimensions. Because the 40-item NCQ consisted of 10 dimensions, and because some dimensions did not have enough number of items, the eigenvalue graph was examined to determine the dimensions (Fig. 1).
In the eigenvalue graph, the fact that the decrease acceleration after the third factor is low suggests that the three-factor model would be appropriate for the
40-item questionnaire (Fig. 1). The three-factor model accounted for 37.875% of the total variance.
To distribute the items of the scale to factors, the promax rotation method was used. Of the 40 items, 39 were placed in their own dimensions using the pro-max rotation method and it was observed that the factor loads ranged between 0.388 and 0.707. The fifteenth item whose factor load was less than 0.30 was not included in any sub-dimension and was excluded from the questionnaire. The items of the questionnaire were grouped under 3 factors as follows:
1. Factor (14 items) = (P5) I don’t want to come to work; (P8) I feel like I don’t belong here; (P12) The background noise is nerve-racking; (P13) No one under-stands me; (P16) I am unhappy when I am at work; (P17) My values do not fit with this institution; (P20) I do not feel healthy right now; (P21) This work makes me feel scared; (P22) I am afraid for my future; (P24) I have experienced changes which make me feel uneasy; (P25) I eat a meal off the unit every day; (P28) I am angry; (P35) I feel out of place here; (P42) When I am asked to precept a student or new nurse, it is a burden.
2. Factor (14 items) = (P9) I feel my work is valued; (P11) These surroundings are pleasant; (P18) I feel like I belong here; (P19) My work breaks refresh me; (P23) I am being treated fairly; (P30) The mood around here uplifts me; (P31) I am content; (P36) I work well with my administrators and leaders; (P38) I am encouraged to make important patient care decisions; (P43) Appropriate light-ing contributes to my well-belight-ing; (P44) Most of my work is true nurslight-ing work;
(P45) I intend to stay here; (P46) I feel my career is upwardly mobile; (P47) My schedule fits my life-style.
3. Factor (14 items) = (P1) I feel relaxed at work; (P2) I feel competent; (P3) I have enough support; (P4) There are those I can depend on when I need help; (P7) I feel confident; (P10) I am inspired by knowing that I am part of a team; (P27) the temperature on this unit is fine; (P29) I can rise above my concerns; (P37) I don’t have many friends at work; (P39) I do not receive positive reinforcement here; (P48) Patient rooms are easy to work in.
After the reliability analysis, the eigenvalues of the 3 factors of the 39-item NCQ rated on a 4-point Likert scale were determined as follows: 10.028 for the first factor, 3.340 for the second factor and 1.782 for the third factor. The
Table 2 Factor structure of the Nurse Comfort Scale (NCQ) and reliability analysis of the factors (n = 275)
* N the number of the items, †% variance
Factors †% Eigenvalue Cronbach’s alpha N*
1. Factor 25.070 10.028 0.859 14
2. Factor 8.349 3.340 0.846 14
3. Factor 4.456 1.782 0.818 11
Total 37.875 15.15 0.915 39
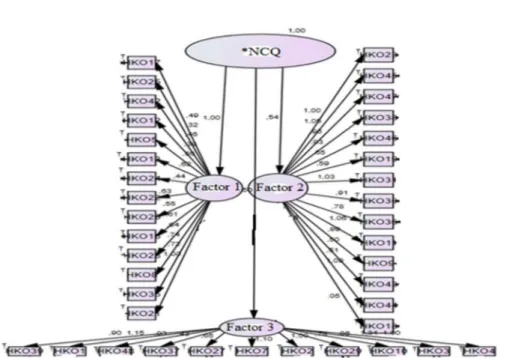
Fig. 2 Confirmatory factor analysis of the Nurse Comfort Questionnaire (NCQ). *NCQ Nurse Comfort Questionnaire, †HKO questionnaire
Cronbach’s alpha values of the sub-dimensions were 0.859 for the first factor, 0.846 for the second factor and 0.818 for the third factor (Table 2).
After the explanatory factor analysis, the confirmatory factor analysis performed for the items in the sub-dimensions revealed that the model fit indices were as fol-lows: χ2/df = 1.756, RMSEA = 0.053, RMR = 0.183, IFI = 0.856, GFI = 0.832, AIC = 1397.812 (Fig. 2).
The stability of the questionnaire over time was determined through the test–retest reliability. In the present study, no statistically significant difference was determined (t = 1.88, p = 0.06) between the results of the two measurements of the questionnaire administered to 30 nurses at a fifteen-day interval. The Pearson’s correlation coef-ficient determined after the test–retest was r = 0.93, and the relationship between the two measurements was statistically significant (p = 0.000).
Discussion
Validity is the ability of a measuring instrument to measure the feature or condition intended to measure (Alemdar and Tufekci 2015). Many methods are used to ensure the validity of a scale. In the present study, to test the validity of the NCQ, the lan-guage and content validity, and construct validity were examined. The content valid-ity of the questionnaire was evaluated by 10 people who were experts in their fields, in terms of the scale items’ content, and their language compatibility, clarity and comprehensibility for the Turkish society. I-CVI and S-CVI were used to evaluate the opinions of the experts. The analysis showed that the I-CVI for the items ranged between 0.80 and 1, and S-CVI for the overall scale was 0.99. Both the I-CVI and the S-CVI should be above 0.80 to confirm that the opinions of the experts are con-sistent (Polit, Beck and Owen 2007). In the present study, both the I-CVI and the S-CVI were above 0.80, which indicated that there was an agreement between the experts. Based on the expert opinions, it can be presumed that the Turkish version of Nurse Comfort Scale was an appropriate measurement tool for Turkish culture in terms of language and content validity.
Internal consistency is a method of reliability that determines whether all aspects of a scale have the ability to measure what is intended to measure (Aksayan and Gözüm 2002). In the literature, it is said that to assess the internal consistency and reliability in Likert-type scales, the Cronbach’s alpha coefficient should be deter-mined (Şencan 2005). The review of the literature indicates that a scale whose Cronbach’s alpha coefficient is between 0.60 and 0.80 is quite reliable, that if it is between 0.80 and 1.00, the scale has a high reliability, and that the coefficient should be as close to 1 as possible (Şencan 2005; Cam and Baysan-Arabacı 2010; Rattray and Jones 2007). The Cronbach’s alpha reliability analysis conducted to determine the internal consistency of the NCQ demonstrated that the internal reliability coef-ficient of the 4-point Likert-type scale was 0.870 for the overall scale. Although the calculated Cronbach’s alpha value was adequate, 8 items (6, 14, 26, 32, 33, 34, 40, 41) which had a negative effect on reliability and whose item-total correlation score was less than 0.20 and negative were removed from the questionnaire, and then, the reliability of the remaining 40-item questionnaire was recalculated. The analysis of
the item-scale correlations of the 40-item NCQ indicated that the correlation values ranged between 0.215 and 0.648. The internal reliability coefficient of the 40-item Likert-type scale was determined as 0.915. On the other hand, the Cronbach’s alpha coefficient was 0.859 for the first factor of the questionnaire, 0.846 for the second factor and 0.818 for the third factor. These values show that the Cronbach’s alpha coefficient for the overall questionnaire and its sub-dimensions is between 0.80 and 1, and that the internal consistency of the questionnaire was high. The Cronbach’s alpha coefficients calculated in the present study are consistent with those of Fer-randiz and Martin-Baena’s study (FerFer-randiz and Martin-Baena 2015).
To determine the construct validity of NCQ, explanatory and confirmatory factor analyses were used. Before the factor analysis, the KMO value was used to deter-mine whether the sample size was adequate, and Bartlett’s test of sphericity was used to determine whether the scale was suitable for the factor analysis. That Bart-lett’s test of sphericity was statistically significant and that the KMO value was over 0.50 indicated that the sample size was adequate for the validity analysis (Şencan
2005). After the analysis, Bartlett’s test of sphericity and KMO values were deter-mined to be above p < 0.05 and 0.50, which suggested that the results were statisti-cally significant for the factor analysis. The promax rotation method was used to distribute the scale items to factors.
In order to determine the number of factors for the explanatory factor analysis, it was suggested that the eigenvalues should be 1.00 or higher (Terwee et al. 2007). As a result of the explanatory factor analysis, the items of the questionnaire were grouped under 11 sub-dimensions. The fact that the 40-item NCQ consists of 10 dimensions shows that some dimensions do not contain enough items. The analysis of the eigenvalue graph showed that the decrease acceleration after the third factor was low suggests that the three-factor model would be appropriate for the 40-item questionnaire. The three-factor model accounts for 37.875% of the total variance. In the literature, it is stated that the explained variance should be between 40.0 and 60.0% (Şencan 2005; Cam and Baysan-Arabacı 2010). However, in sociology stud-ies, it is stated that if the variance explained is more than 0.35.0%, it would be suf-ficient (Yaslıoglu 2017). That the NCQ measures comfort, an abstract concept, and that the explained variance is less than 40.0% are a negligible situation (Yaslıoglu
2017). On Ferrandiz and Martin-Baena’s questionnaire, the factors were grouped under 12 sub-dimensions and the variance explained as a result of the explanatory factor analysis was 54.51% (Ferrandiz and Martin-Baena 2015).
To distribute the scale items to the factors, the promax rotation method was used. Of the 40 items, 39 were placed in their own dimensions using the promax rotation method and it was observed that the factor loads ranged between 0.388 and 0.707. In the literature, it is indicated that in determining to which categories the items should be distributed, the minimum factor value should be 0.30 and above, and that if the value is below 0.30, the item should be removed from the scale (Terwee et al. 2007). Therefore, the fifteenth item with a factor load less than 0.30 was not included in any sub-dimension and was excluded from the scale. The factor values determined after the explanatory in the present study were not compared with those of Ferrandiz and Martin-Baena’s study (Ferrandiz and Martin-Baena 2015).
There are a large number of fit indices used in the confirmatory factor analysis of a scale. The most commonly used one is the Chi-square (χ2) test. Another way to indicate the model’s compliance with the data is to calculate the ratio of Chi-square to the degree of freedom. The ratio ≤ 5 is stated to be acceptable (Hooper, Coughlan and Mullen 2008). It is recommended that RMSEA should be less than 0.08, that of the models included in the AIC, the one with the lowest value should be chosen, and that the other fit indices should be above 0.90 (Yaslıoglu 2017). According to the 39-item confirmatory factor analysis, the fit indices of the Nurse Comfort Question-naire were determined as follows: χ2/SD = 1.756, RMSEA = 0.053, RMR = 0.183, IFI = 0.856, GFI = 0.832, AIC = 1397.812. There is no single fit criterion for deter-mining the significance of a model. Several fit index values have to be evaluated (Yaslıoglu 2017). In the present study, the fit indices of χ2/SD, RMSEA and AIC indicated that the fit of the data set was sufficient. The results of the confirmatory factor analysis of the present study are consistent with those in the literature. The results of the confirmatory factor analysis showed that the data were appropriate for the model and confirmed the factor structure of the questionnaire. The results of the confirmatory factor analysis of the present study were not compared with those of Ferrandiz and Martin-Baena’s study (Ferrandiz and Martin-Baena 2015).
In scale studies, one of the best ways to prove the stability is the use of test–retest technique. Statistically insignificant difference between the test scores and retest scores indicates that the variance is weak (Şencan 2005; Cam and Baysan-Arabacı
2010; Rattray and Jones 2007). As a result of the test–retest reliability measurement in which the stability of the questionnaire over time was determined, it was found that the relationship between the responses given to the items of the questionnaire by the nurses (n = 30) in the two measurements performed at a fifteen-day interval was consistent and statistically significant.
Conclusion
In conclusion, after the statistical analyses conducted to determine the validity and reliability of the Turkish version of the Ferrandiz and Martin-Baena’s Nurse Com-fort Questionnaire, the Spanish version of the General ComCom-fort Questionnaire devel-oped by Kolcaba, some items were excluded from the original questionnaire, and a 39-item Nurse Comfort Questionnaire for Turkey was developed. The analyses showed that the 39-item Nurse Comfort Questionnaire had a valid and reliable struc-ture. Researchers using this scale can measure the comfort level of nurses working in Turkey and develop new programs aiming to improve nurses’ comfort.
Limitations
This methodological study was carried out in only one university hospital in Izmir, in region of western Turkey. The results cannot be generalized.
Compliance with Ethical Standards
Conflict of interest The authors declare that they have no conflict of interest.
Ethical Approval To use the questionnaire in the study, the written permission was obtained from Kol-caba, who developed the questionnaire, and Ferrandiz and Martin-Baena, who adapted the questionnaire into Spanish. The ethical approval and permission to conduct the study were obtained from the Ethics Committee of Ege University Faculty of Nursing and the hospital where the study was to be conducted, respectively.
Informed Consent Written informed consent was obtained from the nurses to participate in the study.
References
Aksayan, S., & Gözm, S. A. (2002). Guide for transcultural adaptation of the scale II: Psychometric char-acteristics and cross cultural comparison. Hemşirelikte Araştırma Geliştirme Dergisi, 4, 9–14. (in
Turkish).
Alemdar, D. K., & Tufekci, F. G. (2015). The reliability and validity of the premature infant comfort scale’s Turkish. HEAD, 12(2), 142–149. https ://doi.org/10.5222/head.2015.142. (in Turkish). Cam, M. O., & Baysan-Arabacı, L. (2010). Qualitative and quantitative steps on attitude scale
construc-tion. Hemar-G, 12(2), 59–71. (in Turkish).
Dursun, Y., & Kocagöz, E. (2010). Structural equation modeling and regression: a comparative analysis. Erciyes Üniversitesi İktisadi ve İdari Bilimler Fakültesi Dergisi, 35, 1–17. (in Turkish).
Erdemir, F., & Çırlak, A. (2013). The concept of comfort and its utilization in nursing. DEUHYO ED, 6(4), 224–230. (in Turkish).
Ferrandiz, E. F., & Martín-Baena, D. (2015). Translation and validation of a Spanish version of the Kol-caba’s general comfort questionnaire in hospital nurses. International Journal of Nursing, 2(1), 113–119. https ://doi.org/10.15640 /ijn.v2n1a 12.
Goodwin, M., & Candela, L. (2013). Outcomes of newly practicing nurses who applied principles of holistic comfort theory during the transition from school to practice: A qualitative study. Nurse Edu-cation Today, 33(6), 614–619. https ://doi.org/10.1016/j.nedt.2012.07.013.
Hooper, D., Coughlan, J., & Mullen, M. (2008). Structural equation modelling: Guidelines for determin-ing model fit. Journal of Business Research Methods Articles, 6, 53–60.
Karabacak, Ü., & Acaroğlu, R. (2011). Theory of comfort. Maltepe Üniversitesi Hemşirelik Bilim ve Sanatı Dergisi, 4(1), 197–202. (in Turkish).
Karakaplan, S., & Yıldız, H. (2010). A study on developing a postpartum comfort questionnaire. Maltepe Üniversitesi Hemşirelik Bilim ve Sanatı Dergisi, 3(1), 56–65. (in Turkish).
Kolcaba, K. Y. (1992). Holistic comfort: Operationalizing the construct as a nurse-sensitive outcome. Advances in Nursing Science, 15(1), 1–10.
Kolcaba, K. Y. (1994). A theory of holistic comfort for nursing. Journal of Advanced Nursing, 19(6), 1178–1184. https ://doi.org/10.1111/j.1365-2648.1994.tb012 02.x.
Kolcaba, K. (2001). Evolution of the mid range theory of comfort for outcomes research. Nursing out-look, 49(2), 86–92. https ://doi.org/10.1067/mno.2001.11026 8.
Kolcaba, K. (2003). Comfort theory and practice: A vision for holistic health care and research. Canada: Springer Publishing Company.
Kolcaba, K., & DiMarco, M. A. (2005). Comfort theory and its application to pediatric nursing. Pediatric nursing, 31(3), 187–195.
Kolcaba, K. Y., & Kolcaba, R. J. (1991). An analysis of the concept of comfort. Journal of Advanced Nursing, 16(11), 1301–1310. https ://doi.org/10.1111/j.1365-2648.1991.tb015 58.x.
Krinsky, R., Murillo, I., & Johnson, J. (2014). A practical application of Katharine Kolcaba’s comfort theory to cardiac patients. Applied Nursing Research, 27(2), 147–150. https ://doi.org/10.1016/j. apnr.2014.02.004.
Kuğuoğlu, S., & Karabacak, Ü. (2008). Turkish version of the general comfort questionaire. Journal of Istanbul University Florence Nightingale Nursing School, 61(16), 16–23. (in Turkish).
Ocakçı, A. F., & Alpar, E. Ş. (2013). Hemşirelik Kavram, Kuram ve Model Örnekleri (pp. 39–57) 1. Baskı. Istanbul: İstanbul Tıp Kitabevi. (in Turkish).
Orak, N. Ş., Pakyüz, S. Ç., & Kartal, A. (2017). Scale development study: Comfort on hemodialysis patients. Nefroloji Hemşireliği Dergisi, 12(2), 68–77. (in Turkish).
Polit, D. F., Beck, C. T., & Owen, S. V. (2007). Is the CVI an acceptable indicator of content valid-ity? Appraisal and recommendations. Research in Nursing & Health, 30(4), 459–467. https ://doi. org/10.1002/nur.20199 .
Potur, C. D., Doğan, M. Y., Külek, H., & Gürkan, C. Ö. (2015). Doğum konforu ölçeğinin Türkçe geçer-lik ve güvenirgeçer-lik çalışması. Anadolu Hemşiregeçer-lik ve Sağlık Bilimleri Dergisi, 18(4), 252–258. (in
Turkish).
Rattray, J., & Jones, M. C. (2007). Essential elements of questionnaire design and development. Journal of Clinical Nursing, 16(2), 234–243. https ://doi.org/10.1111/j.1365-2702.2006.01573 .x.
Şencan, H. (2005). Reliability and validity in the social and behavioral measures (2nd ed.). Ankara: Seçkin Yayıncılık. (in Turkish).
Terwee, C. B., Bot, S. D., de Boer, M. R., van der Windt, D. A., Knol, D. L., Dekker, J., et al. (2007). Quality criteria were proposed for measurement properties of health status questionnaires. Journal of Clinical Epidemiology, 60(1), 34–42. https ://doi.org/10.1016/j.jclin epi.2006.03.012.
Tosun, B., Aslan, Ö., Tunay, S., Akyüz, A., Özkan, H., Bek, D., et al. (2015). Turkish version of Kol-caba’s immobilization comfort Questionnaire: A validity and reliability study. Asian Nursing Research, 9(4), 278–284.
Üstündağ, H., & Eti Aslan, F. (2010). The Turkish adaptation of perianesthesia comfort questionnaire. Turkiye Klinikleri Journal of Nursing Sciences, 2(2), 94–99. (in Turkish).
Yaşlıoğlu, M. M. (2017). Sosyal bilimlerde faktör analizi ve geçerlilik: Keşfedici ve doğrulayıcı faktör analizlerinin kullanılması. Istanbul Business Research, 46, 74–85. (in Turkish).
Yücel, Ş. Ç. (2011). Kolcaba’s comfort theory. Journal of Ege Unıversıty School of Nursıng, 27(2), 79–88. (in Turkish).
Zengin, N. (2010). Comfort theory and the effect of intensive care unit on patient comfort. Yoğun Bakım Hemşireliği Dergisi, 14(2), 61–66. (in Turkish).
Publisher’s Note Springer Nature remains neutral with regard to jurisdictional claims in published maps and institutional affiliations.