The Effect of Nature Education Program on the Level of
Environmental Awareness of the Elementary School
Students from Different Socioeconomic Status
Nihal Yildiz Yilmaz1,*, Ayşe Mentiş Taş21Faculty of Education, Karamanoğlu Mehmetbey University, Turkey 2Faculty of Ahmet Keleşoğlu Education, Necmettin Erbakan University, Turkey
Copyright©2018 by authors, all rights reserved. Authors agree that this article remains permanently open access under the terms of the Creative Commons Attribution License 4.0 International License
Abstract The main purpose of this study is to examine
the effect of the nature education program on the environmental awareness levels of the elementary school students from different socioeconomic status. The study is designed in a concurrent nested mixed method. Pretest-posttest quasi-experimental model for quantitative data and case study model for qualitative data were used in accord with this research design. The study group consists of 78 students determined by the proportional cluster sampling method among 4th grade students in the Konya province center during 2016-2017 education years that participated in the education class in Konya Tropical Butterfly Garden, and also voluntarily participated in the research. TURKSTAT data, teachers, student information forms and voluntary participation were taken into consideration while determining the study group. The data of the study were collected with the 35-item Elementary School Environment Awareness Scale developed for the research project. In the analysis of the quantitative data, significance tests were applied, and qualitative data were analyzed by content analysis.Keywords
Nature Education, Environmental Awareness, Socioeconomic Status1. Introduction
The environment can be defined as the surroundings in which all living and inanimate entities interact. Awareness includes cognitive and affective components [1]. In regard to the environment, while the cognitive component of awareness provides agglomeration of the knowledge on the environment, the affective component provides a sensitive approach to all living and non-living beings in the world. Environmental awareness is highly complex issue because of the dependence and interdependence of the many factors which also interacts each other. Social and economic factors and cultural practices are important to alter the
people's awareness. An effective environmental education enhances environmental awareness. For this awareness to be memorable and comprehensive, a critical approach should be developed against possible interventions to the environment [2]. Environmental education is seen as the main way to create awareness, emotion and behavioral change in the environmental issues through providing understanding on that the environmental degradation caused by people can also be resolved by people [3].
Environmental education is required to improve environmental awareness and environmental quality [4]. Since education can change behaviors, environmental education is described as an effective way to develop responsible citizen behaviors towards the environment [5]. When the literature is analyzed, it is seen that the environmental education programs generally aim to change environmental behaviors by increasing environmental knowledge [6].
It is important to know how people perceive environmental problems and how they behave against them for understanding individual, group, and social responses [7]. The development of environmental knowledge is a prerequisite for environmental education and ecological behavior. However, their practicability and memorability are very small. Therefore, in order to provide internalization of environmental education and to increase ecological behavior, it is necessary to consider it holistically together with nature-based environment education [8]. Trainings, such as nature protection education, environmental education, sustainable development education and environment and sustainability education are generally parallel to each other as they cannot provide success by themselves only [9].
In the research conducted by Pooley and O'Connor [6], environmental educators interested in environmental attitudes, changing emotions and beliefs should be targeted as the sources of knowledge that will form the basis of nature programs, rather than the knowledge itself. In this research, the importance of nature education as a source of
information is emphasized. Güven and Aydoğdu [10] developed the Environmental Problems Awareness Scale¬ and applied to the teacher candidates. It was determined that the level of awareness of teacher candidates varied according to the items in the scale and the level of awareness was below the desired level. Özbebek Tunç, Ömür and Düren [11] conducted a study on university students and found that they were not insensitive to environmental issues, had a certain level of awareness, but could not take an attitude towards personal measures taken to protect the environment. In the study conducted Otto and Pensini [8] on 4th and 6th grade students, they found a relationship between nature-based environmental education and connectedness to nature, environmental knowledge and ecological behavior. The study by Uzun, Keles and Uzun [12] found a difference between environmental awareness and behaviors in the analysis of environmental sensitivity scales applied to the university students after the nature education. Although the applied group is different, the results overlap with our results. It can be said that nature education has increased environmental awareness for all age groups.
Research has sought the benefits of strengthening ties to nature by identifying the harmful effects of keeping children out of nature. These benefits are directed towards physical, intellectual and socio-emotional development. Learning the nature takes place in natural environments. However, nature activities can also be done indoor like plants grown from seeds [13]. To be able to learn indoor or outdoor, it is first necessary for educators to stimulate love and curiosity. In this way, children are aware of their surroundings and actively involved to protect them. Well-designed facilities in natural environments organized with basic environmental information are needed to help people learn about plants and animals, their properties and their interrelationships [41]. What should be noted here is to integrate both in-class and out-of-class education and to direct them to nature experiences that allow children to explore nature. It is also important to introduce all the living and non-living beings in the nature to children and make them to grasp the place of the human being among them during the nature experience [15]
Socioeconomics is the branch of science that examines the relationship between social values and the economy and the effects of economic changes on society [16]. Social values that individuals can reach the general judgment of what is right, what is wrong, what is good, what is bad, what is beautiful, what is ugly and what is fair [17]. One of the social values in this definition can be stated as nature awareness. Because awareness is a concept associated with consciousness [18] Consciousness is directly related to social values, while the relationship with economy constitutes socioeconomic levels. For this reason, socioeconomic status of the people can affect their level of awareness. Due to socio-economic concerns, parents' awareness can be reduced to ignore social values in everyday life such as the environment and nature. This
directly affects children.
Reviewing the former researches indicates that there is a limited number of studies on the nature experiences of the students [19, 20]. Absence of any research on determining the level of environmental awareness of elementary school students in Turkey proves the importance of this study in terms of contribution to the literature. In addition, it is important to conduct the study with students from different socioeconomic status to determine the effects of the socioeconomic status on environmental education. This research uses the field-based education methods like field trips and experiential learning which stem from constructive approach. This approach constitutes the basis of our effective learning and teaching program. Following that, this research examines the environmental awareness levels of the students from different socioeconomic status who participated to the Nature Education Class that takes place in Konya Tropical Butterfly Garden which is built by Konya Selçuklu Municipality. In the light of this basic objective, the responses to the following questions were sought:
1) Is there a significant difference between pretest and posttest scores of the students from different socioeconomic status?
2) What are the opinions of the students from different socioeconomic status about nature?
2. Materials and Methods
2.1. Research Design
In the research, a concurrent nested mixed methods design is used. The mixed research methodology consists of a series of procedures involving several stages [21]. This method is based on a research where the researcher collects, analyzes, and make deductions using both qualitative and quantitative approaches and methods in a single study. In the concurrent nested mixed design, the researcher may add a qualitative phase to, for example, a quantitative experimental study, or add a quantitative phase to a qualitative case study. In this design, the supportive phase is added for improving the overall pattern [22]. In line with the research problem, a qualitative phase was added to this experimental work which aimed to identify the effect of the nature education program applied to the elementary school students from different socioeconomic status on environmental awareness levels, and so the general pattern was repeated. 2.2. Study Group
The study group is consisted of 78 of the 4th grade students in the Konya central province, who are participated in the class at the Konya Tropical Butterfly Garden in the 2016-2017 educational year and who voluntarily accepted to participate in the survey. The study group was determined by using proportional cluster
sampling. The case in which all the clusters in the population have the chance of being individually selected is called cluster sampling. In a proportionally clustered sampling that constitutes a highly representative sample, the population is first divided into sub-populations according to the variables that are thought to bring significant differences in research findings [23]. While determining the study group, it was ascertained that to use the data provided by TurkSTAT (Turkey Statistical Institute) that the schools that get an appointment for the class are from which socioeconomic status (lower, medium, and upper) according to the area they are in. To confirm the difference in socioeconomic status, the teachers were interviewed, and necessary regulations were made. According to the principle of volunteerism, the approvals of teachers and students have been obtained to apply the research.
Table 1. Demographic characteristics of the study group Demographic characteristics Frequency % Rate Socioeconomic Status Upper 21 26.9 Middle 29 37.2 Lower 28 35.9 Sex Male 43 55.1 Female 35 44.9
When the demographic characteristics of the participants are examined through Table 1 it is seen that 21 students are from upper socioeconomic status, 29 are from middle socioeconomic status and 28 are from lower socioeconomic status. 43 of the students are females and 35 are males.
2.3. Data Collection Tools
Three data collection tools were used in the research. These are "Personal Information Form", "Primary School Environment Awareness Scale" and semi-structured interview form and all are developed by the researcher. 2.3.1. Personal Information Form
The form developed by the researcher has yielded data on the demographic characteristics (age, sex, school, and socioeconomic status) of the students in the study group. 2.3.2. Primary School Environmental Awareness Scale
The data of the study is collected by the Primary School Environment Awareness Scale. The scale was developed by Yıldız Yılmaz and Mentiş Taş [24] for the Individual Research Project titled "A New Look at Nature Education: Konya Tropical Butterfly Garden Nature Education Class" supported by Karamanoğlu Mehmetbey University. The scale consists of 35 items and 4 sub-dimensions. Sub-dimensions are; living in nature, renewable energy sources and their use, environmental responsibility, and continuity of living things. The total Cronbach Alpha value of the scale is calculated as 0.843 and the validity of the coverage as 0.994. For these calculations, the scale is
found to be valid and reliable. 2.3.3. Question Form
In the interview, a clearly defined problem is identified, appropriate interview questions are designed, questions become clear and easy to understand, and enough time is given for responding [25]. The interview form is prepared in parallel with the quantitative data of the research. The literature has been reviewed and questions have been prepared. After receiving the specialist opinion, the pilot was implemented for determining the intelligibility of the questions. The interview form was created as a semi-structured form because semi-structured interviews allow the participant to express his or her own perceptions of the world [26]. Since the questions are semi-structured, explanations were made by the researcher where necessary.
2.4. Process
For the study which was carried out within the scope of the project, nature education lectures were given in accordance with the constructivist approach at the Konya Tropical Butterfly Garden Nature Education Class. At the lectures, the opportunities for students to learn by field trips and experiential learning were provided. The application phase of the study lasted 8 weeks. Activities lasted between 30-45 minutes each. Week by week these activities were held:
1. Week: Pretests were applied, and students were informed about what to do.
2. Week: Under the topic "Journey to the World of Insects", students were given general information about insects. Presentations on different species were made for students to be familiar with the insects. Activities have been held.
3. Week: the insect museum was visited by the students and the information was repeated by inspecting the different insects with a microscope.
4. Week: Within the scope of "Between Interesting Creatures", students have been introduced with various living things other than insects and their characteristics. Activities have been held.
5. Week: Some of the interesting creatures in the Butterfly Garden were shown and contacted with the volunteer ones.
6. Week: The mutual relations between the plants and the other living things in the Butterfly Garden were shown in vivo.
7. Week: Information about renewable energy sources was given using through the plants, insects and other living things in the Butterfly Garden. Activities have been held.
8. Week: Posttests were applied, and semi-structured interview form was filled in by the students.
2.5. Analyzing Data
software and the qualitative data by content analysis. When quantitative data were analyzed, the Kolmogorov-Smirnov Test was used for finding whether the data set consists a normal distribution; the Kruskal-Wallis H Test for determining if there is a statistically significant difference between the groups' averages, the Mann-Whitney U Test for determining between which groups there is difference, the Wilcoxon Signed Ranks Test for finding whether there is a difference between pretest and posttest. The Kolmogorov-Smirnov Test is to test whether the sample has a fully determined normal distribution [27]. The Kruskal-Wallis test is one of the nonparametric tests to determine whether the mean differences between independent groups are manifested by chance or as an effect of the application [28]. The strongest nonparametric test that can be used when the difference between the two means does not accommodate with one or more of the hypotheses included in the significance test is the Mann-Whitney U Test [29]. The Wilcoxon Signed Ranks Test, a non-parametric comparison test which is an alternative to the t test for dependent samples, can be used for testing the differences between measurements when the sample size is low or when there are anomalies between the distributions of the measurements [30].
The data obtained from the semi-structured interview form was analyzed by a content analysis. Content analysis is a systematic and renewable technique where the inferences are made by determining the messages with the coding prepared according to certain rules [31]. In content analysis approach, categories are determined qualitatively for texts, and quantitatively, the frequency of categories is determined [32]. Content analysis provides new ideas and facilitates interpreting specific events for the researcher [33]. In content analysis approach, the data is analyzed in 4 stages, with the aim of reaching conclusions and associations that can explain the data:
1) Encoding of the data 2) Finding themes
3) Arranging the codes and the themes
4) Identification and interpretation of findings [34]. Accordingly, students from the upper socioeconomic status were coded as USS, students from the middle socioeconomic status as MSS, and students from the lower socioeconomic status as LSS. Themes were created by analyzing the contents of each question and the data given under these topics was quantitatively stated. In
some questions, the students did not have one object as the answer, but they have two or more (liked living things = birds, dogs, cats). While the codes and themes were organized, 2 from the lower socioeconomic group and 4 from the middle socioeconomic group were removed from the analysis due to their answers were not illegible.
To ensure the reliability of the qualitative data in the study, two procedures were performed. First, the data that can represent each category in the findings are directly cited without comment. Secondly, the specialist opinion was sought to determine whether each of the expression under any of the 78 conceptual categories of the three socioeconomic statuses represents the category that it belongs. For this purpose, two forms have been given to a specialist. The first form consists of a list of 78 conceptual categories of the three socioeconomic statuses, and the second form of 294 responses given by the students according to their socioeconomic status. The specialists were asked to map 78 categories with 294 responses in the given lists. Matches made by the specialist and the researcher were compared. The number of "agreements" and "disagreements" were determined in the comparison. The reliability of the study was calculated by the Miles and Huberman's (1994) formula (Reliability = [agreements / (agreements + disagreements)] x 100). Only three responses given by the researcher and the specialist were matched with different categories, one in the "education" category and two in the "cohabitation" category. In this case, Reliability = [294 / (294 + 3)] x 100 = 98.9%. In qualitative research, 90% or above values of the calculation of agreements between the specialist and the researcher is considered reliable [35]. Identification and interpretation of the findings were then combined with quantitative analysis results.
3. Findings
The normality test was performed to determine the distribution of the data. According to the results of the Kolmogorov-Smirnov Test [36] which is used for the groups with the number of observations are 30 and over, the significance value was .000 and thus it was identified that the data does not show normal distribution.
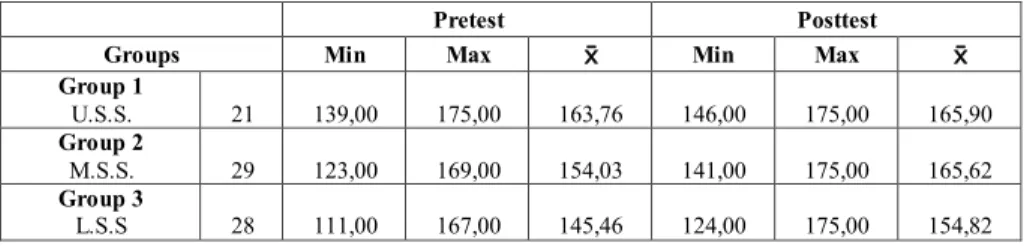
The minimum and maximum values, the pretests-posttests and the averages of the groups are given in Table 2:
Table 2. The pretest-posttest score ranges of the students from different socioeconomic status Pretest Posttest
Groups Min Max Min Max
Group 1 U.S.S. 21 139,00 175,00 163,76 146,00 175,00 165,90 Group 2 M.S.S. 29 123,00 169,00 154,03 141,00 175,00 165,62 Group 3 L.S.S 28 111,00 167,00 145,46 124,00 175,00 154,82
As can be seen in Table 2, shifting from the upper socioeconomic level to the lower socioeconomic level in the pretests decreases the averages and the minimum and the maximum scores. Considering maximums, the upper socioeconomic group gets the full score of 175.00 points. In the posttests, the scores of all the three groups in the minimums and averages are increased compared to their pretests. Considering the maximum points, only the students from upper socioeconomic status reached the full score (175.00) in the pretests, while in the posttests the other two groups also reached that score.
The Kruskal-Wallis-H test is applied to determine whether there is a difference in the pretests among the groups and it is presented in Table 3:
Table 3. Results of Kruskal Wallis-H test for environmental awareness
levels of students from different socioeconomic status
Group n means SD Rank x2 p
Environmental Awareness Level U.S.S M.S.S. L.S.S. 21 29 28 56.81 39.22 26.80 2 2 2 21.081 ,000* *p< 0,05
In Table 3, the results of the Kruskal Wallis-H test applied for determining if the students from different socioeconomic status differed significantly on their environmental awareness levels indicate that p = .000 and since p <0.05 there is a significant difference between the pretest averages.
The Mann Whitney U test was conducted for determining between which of the two groups a significant difference exist, and the results are presented in Table 4: Table 4. The Mann Whitney U test for environmental awareness levels
of students from different socioeconomic status
Group n means Rank Rank sum U p
U.S.S. 21 32.76 688,00 152,00 .003* M.S.S. 29 20.24 587,000 U.S.S. 21 35.05 736,00 83.00 .000* L.S.S. 28 17.46 489,00 M.S.S. 29 33.98 985,50 261,50 .021* L.S.S. 28 23.84 667,50 *p < 0.05
Mann Whitney U Test was applied in Table 4 to identify between which groups there is a significant difference. Accordingly, differences in the application of environmental awareness scale between the upper socioeconomic status and the middle socioeconomic status (U = 152.00; p = .003) is in favor of upper socioeconomic status; between the upper socioeconomic status and the lower socioeconomic status (U = 83.00; p = .000) is in favor of the upper socioeconomic status; and between the middle socioeconomic status and the lower socioeconomic status (U = 261.50; p = .021) is in favor of middle socioeconomic status.
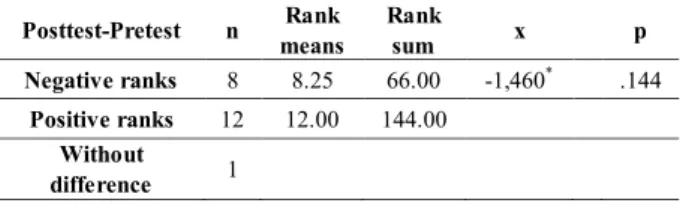
The results of the Wilcoxon Signed Ranks Test
conducted for testing if there is difference between the pretest and posttest scores of the environmental awareness scale of the students with upper socioeconomic status are presented in Table 5:
Table 5. Wilcoxon Signed Ranks Test results of the environmental
awareness scales of the students with upper socioeconomic status
Posttest-Pretest n means Rank Rank sum x p Negative ranks 8 8.25 66.00 -1,460* .144
Positive ranks 12 12.00 144.00
Without difference 1
*Based on negative ranks
The results of the Wilcoxon Signed Ranks Test conducted for finding if there is a difference between the environmental awareness pretest and posttest scores of the students with upper socioeconomic status do not show a significant difference between the averages of the pretest and the posttest scores (z = -1,460, p = .05). Since the environmental awareness levels of the students from upper socioeconomic status are also high initially, there is no significant effect of the nature education on their awareness levels.
The results of the Wilcoxon Signed Ranks Test conducted for testing whether there is a difference between the environmental awareness scale pretest and posttest scores of the students from middle socioeconomic status are presented in Table 6:
Table 6. Wilcoxon Signed Ranks Test results of the environmental
awareness levels of the students form middle socioeconomic status
Posttest-Pretest n means Rank Rank sum x p Negative ranks 1 5.50 5.50 -4,501* .000
Positive ranks 27 14.83 400.50
Without difference 1
*Based on negative ranks
The results of the Wilcoxon Signed Ranks Test conducted for testing whether there is a difference between the environmental awareness scale pretest and posttest scores of the students from middle socioeconomic status show a significant difference between the pretest and the posttest average environmental awareness scores (z = -4.501, p = .000). When the rank averages and totals of the difference scores are taken into consideration, it is seen that this difference is in favor of the posttest. In this respect, it can be stated that the environmental awareness levels of the students from middle socioeconomic status who participated in the nature education program is increased during the 8-week period.
The results of the Wilcoxon Signed Ranks Test conducted for testing whether there is a difference between the environmental awareness scale pretest and posttest scores of the students from lower socioeconomic status are presented in Table 7:
Table 7. Wilcoxon Signed Ranks Test results of the environmental
awareness measurement of the students from lower socioeconomic status
Posttest-Pretest n means Rank Rank sum x p Negative ranks 5 12.90 64.50 -2,993* .003
Positive ranks 22 14.25 313.50
Without difference 1
*Based on negative ranks
In Table 7, the results of the Wilcoxon Signed Ranks Test conducted for testing whether there is a difference between the environmental awareness scale pretest and posttest scores of the students from lower socioeconomic status show a significant difference between the pretest and
the posttest average environmental awareness scores (z = -2,993, p = .003). When the rank averages and totals of the difference scores are taken into consideration, it is seen that this difference is in favor of the posttest. In this respect, it can be said that the participation of the students from lower socioeconomic status in the nature education program and the environmental awareness levels increased during the 8-week period.
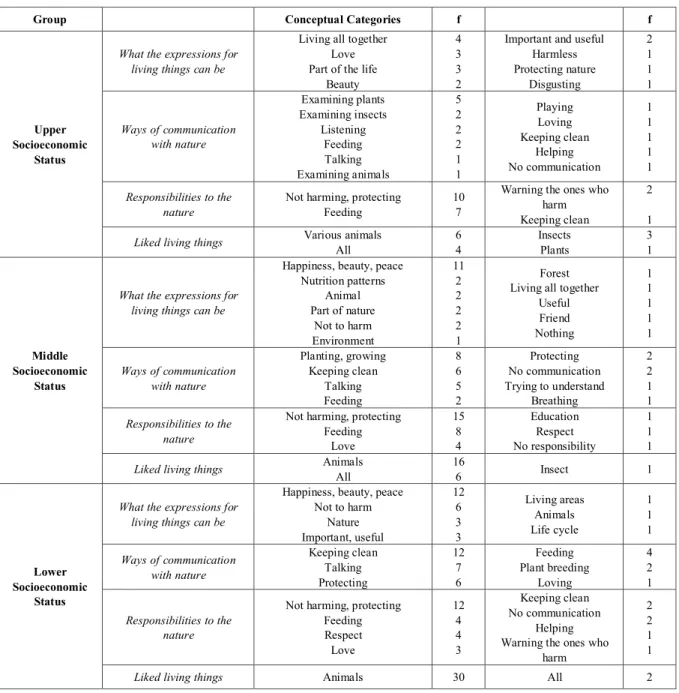
The opinions of the students from different socioeconomic status about nature, their communication with nature, their responsibilities towards nature and the nature they expressed with their reasons for love more in nature are presented in Table 8 with content analysis:
Table 8. Analysis results of the opinions of the students from different socioeconomic status about the nature
Group Conceptual Categories f f
Upper Socioeconomic
Status
What the expressions for living things can be
Living all together Love Part of the life
Beauty
4 3 3 2
Important and useful Harmless Protecting nature Disgusting 2 1 1 1 Ways of communication with nature Examining plants Examining insects Listening Feeding Talking Examining animals 5 2 2 2 1 1 Playing Loving Keeping clean Helping No communication 1 1 1 1 1 Responsibilities to the
nature Not harming, protecting Feeding 10 7
Warning the ones who harm Keeping clean
2 1
Liked living things Various animals All 6 4 Insects Plants 3 1
Middle Socioeconomic
Status
What the expressions for living things can be
Happiness, beauty, peace Nutrition patterns Animal Part of nature Not to harm Environment 11 2 2 2 2 1 Forest Living all together
Useful Friend Nothing 1 1 1 1 1 Ways of communication with nature Planting, growing Keeping clean Talking Feeding 8 6 5 2 Protecting No communication Trying to understand Breathing 2 2 1 1 Responsibilities to the nature
Not harming, protecting Feeding Love 15 8 4 Education Respect No responsibility 1 1 1
Liked living things Animals All 16 6 Insect 1
Lower Socioeconomic
Status
What the expressions for living things can be
Happiness, beauty, peace Not to harm Nature Important, useful 12 6 3 3 Living areas Animals Life cycle 1 1 1 Ways of communication with nature Keeping clean Talking Protecting 12 7 6 Feeding Plant breeding Loving 4 2 1 Responsibilities to the nature
Not harming, protecting Feeding Respect Love 12 4 4 3 Keeping clean No communication Helping Warning the ones who
harm
2 2 1 1
In Table 8, for the question "What can be the expressions for living things" the most distinct answers are of the students from the middle socioeconomic status, while the only negative answer is of a student from upper socioeconomic status. For the question "What are the ways of communication with nature?" the most distinct categories were formed by the students from, respectively, upper, middle and lower socioeconomic status. For the question "What are your responsibilities towards nature?" answers come from all three groups as to protect and not to harm. For the question "What are the liked living things", the students from upper socioeconomic status responded in 4 different categories, while the students from middle socioeconomic status in 3 and the lower in 2 different categories. In accord with the content analysis, some students' responses to the questions are presented directly in the following citation:
What the expressions for living things can be "They are a part of life and nature. They are alive like us and they know what is life. We should not harm them, we must protect them. "(USS5) "Living things are a part of nature, they are making nature beautiful. We must protect them and do not distort their beauty. "(MSS8)
"The living creatures in nature express happiness and peace for me." (LSS5)
Ways of communication with nature
"I listen to the sounds of birds because it puts me at ease. "(USS3)
"Obviously I do not communicate very much with nature." (MSS2)
"I'm talking to the plants in nature. I feel like it rejoices when I water it and I plant new friends for it. "(MSS8)
"By not harming them; by protecting them." (LSS20)
Responsibilities to nature
"We should usually give them food, not to hurt animals" (USS8)
"We have responsibilities for the living things that we live together, such as not to harm them, not to forget that they are alive like us and have a life in them." (MSS17)
"We are responsible for nature as not to crush them, not to hurt them, not to annoy them, not to destroy their home, and as to feed the dogs and the cats." (LSS1)
Liked living things
"I love all of them, but I love most the ants because it works very hard." (USS11)
"Centipede. Because it is very interesting that it has forty legs." (USS14)
"I love the cat among the living things in the nature because they are cute and they can be pets. Therefore, I love cats." (MSS14)
"I love all because all of them are beautiful and cute." (LSS8)
4. Conclusions
For the collection of the data in the study, firstly the Primary School Environmental Awareness Scale with 35 items and 4 sub-dimensions was used. Sub-dimensions of the scale are consisting of these: life in the nature, renewable energy sources and their use, environmental responsibility and survival of living things. After securing the validity and reliability of the scale in the development stages, Konya Tropical Butterfly Garden Nature Education Class was implemented for 8 weeks. Different socioeconomic statuses have been identified among students before the implementation. Scale was applied before and after the implementation. The data obtained from the application of the scale was transferred to the statistical program and analyzed.
With the aim of determining whether the data have a normal distribution or not, the Kolmogorov-Smirnov test is applied. The test shows that the data is not distributed normally. The pretest and posttest scores of the groups were determined. When the minimum, maximum and average scores of the pretest score ranges were examined, it was obtained that the students were ranked according to their socioeconomic statuses from the highest to the lowest, as upper socioeconomic status, middle socioeconomic status and lower socioeconomic status respectively. When the posttest score ranges were examined, the same rankings were found in the average and the minimum scores; and in the maximums, all three groups received the full score. The minimum and average scores of all groups also increased.
Kruskal Wallis-H test was conducted for determining whether environmental awareness levels differed significantly in pretests of students from different socioeconomic status, and it was found that p = .000. There is a significant difference between pretest averages since p <0.05. The Mann Whitney U Test was performed to determine the significant differences were between which of the groups. These differences are; between the upper socioeconomic status and the middle socioeconomic status is in favor of upper socioeconomic status; between the upper socioeconomic status and the lower socioeconomic status is in favor of the upper socioeconomic status; and between the middle socioeconomic status and the lower socioeconomic status is in favor of middle socioeconomic status. The score ranges of the groups overlap with this difference.
The Wilcoxon Signed Ranks Test is conducted for testing whether there is a difference between the environmental awareness scale pretest and posttest scores of the students from upper, middle and lower socioeconomic statuses. There was no significant
difference in students at the upper socioeconomic status and there was a meaningful difference in favor of the posttest scores of the students from middle and lower socioeconomic status.
The results of the content analysis applied to the responds to the semi-structured interview made at the end of the study show that, the students from upper socioeconomic status were the group who most use expressions that indicates living together with the living things, while this was expressed once in the middle socioeconomic status group and never in the lower socioeconomic status group. In the communication types, the students from upper socioeconomic status gave the answers in the examination category whereas the other two groups gave the answers in the keeping clean category. All three groups bear the same responsibility for not harming and protecting nature. However, the number of the categories in terms of responsibility is increased by the socioeconomic status of the students, by lower to upper status respectively. Among the liked living things, in the category of plants there was only one respond of a student from upper socioeconomic status. These results support higher levels of environmental awareness among the students from upper socioeconomic status. However, the diversity of the categories formed by the answers given by the students from middle and lower socioeconomic status and the similarities in all three groups are indicative of the positive development of the environmental awareness levels realized with the nature education activities, and the quantitative data indicates that they support each other.
In the study, all the activities during the trial process were influential in the development of different aspects of students' environmental awareness. This is because each activity is designed to develop different awareness of the students. However, it is thought that contact activities, insect museums, butterfly garden activities are more effective because the students are attracted more attention.
Shobeiri, Omidvar & Prahallada [37] investigated the level of environmental awareness of secondary school students in India and Iran. The evaluation was made using the Environment Awareness Ability Measure (EAAM). The result of the evaluation shows that the school type (state and private) affects their awareness. The results of the researches are similar as the sociocultural difference of the school types effect the environmental awareness. Fisman [38] showed that out-of-class nature education in the Learning Area Program of 3rd and 5th grade students has a significant positive impact on students' local environmental awareness and environmental knowledge. Apart from that, the program has been associated with socioeconomic status as it develops the environmental knowledge, and developments in local environmental awareness have only emerged among students living in upper socioeconomic status neighborhoods. The result of the research that the development is correlated with the
socioeconomic status and increases in favor of the upper socioeconomic status coincides with the results of this research. In the research conducted by Hausbeck, Milbrath and Enright [39], the school type, the school district and the level and the gender of the students were independent variables. The variations are found between schools and inside each school in relation to environmental learning. In the study conducted by Uzun and Sağlam [40] with high school students, a difference was found in favor of the middle socioeconomic group in the students with low, medium and high socioeconomic level of environmental consciousness. No difference was found at high and low socioeconomic level. These results do not overlap with the results of the research.
Feyzioğlu, Özenoğlu Kiremit, Öztürk Samur, Aladağ [41] conducted a qualitative study with students, teacher candidates, teachers and parents. The study indicates that nature education increased the awareness and sensitivity for natural environment, environmental pollution, and living species. The qualitative results of the study are similar to our results in terms of awareness. A qualitative study conducted by Yardımcı [19] with 4th and 5th grade students in elementary school indicates that the camp program has increased their knowledge. According to the results of both surveys, it can be stated that any education in the nature will contribute to the environmental awareness. In the qualitative study conducted with the elementary school 4th grade students by Köşker [15], the students regarded nature as vegetative elements and are concerned with protecting nature with responsibility. When the qualitative data of our study were compared with this study, they are similar in protective attitude towards the nature while differing in how the students regard the nature, i.e. as vegetative elements. Examining the qualitative data of our study shows that animals are emphasized more. In the metaphor study conducted by Kahyaoğlu [42] the primary school students produced metaphors such as the vital function of nature, the diversity of nature, the aesthetic and artistic aspect of nature, the balance and rules of nature. The qualitative data of our study are similar to this study on the issues such as the vital function of nature and the diversity of nature.
The following suggestions have been made in the light of the results obtained from the research:
For environmental awareness, it may be advisable for teachers to use more of the nature education activities within the possibilities. Teachers may be encouraged to participate in nature education studies in order to achieve this aim satisfactorily. For future research, the relationship between
environmental awareness levels of primary school students and various variables can be examined. The research is limited to 4th grade students and
similar studies can be conducted with 2nd and 3rd grade students, which are included in the scale.
Through the developed scale, the effects of environmental education activities on environmental awareness can be examined.
In order to minimize the difference between the environmental awareness of the students from different socioeconomic status, in nature educations students from lower and middle socioeconomic status can have different and more effective activities.
Acknowledgements
We thank to Karamanoğlu Mehmetbey University Scientific Research Projects Coordinatorship, Project No 25-M-16.
REFERENCES
[1] Takala, M. (1991). Environmental awareness and human activity. International Journal of Psychology, 26(5), 585-597. DOI: 10.1080/00207599108247146
[2] Polajnar, K. (2008). Conservation education and environmental awareness. Respondıng to Envıronmental Change: From Words to Deeds, 66. bridgingthegap.si [3] Özdemir, O. (2007). Yeni Bir Çevre Eğitimi Perspektifi:
“Sürdürülebilir Gelişme Amaçlı Eğitim”. Eğitim ve Bilim, 32 (145), 23-39.
http://egitimvebilim.ted.org.tr/index.php/EB/article/view/8 13
[4] Jianguo, M. (2004). Teaching environmental awareness in mathematics. Chinese Education & Society, 37 (4), 53-56. http://www.tandfonline.com/doi/
abs/10.1080/10611932.2004. 11031651?journalCode=mced20
[5] Hungerford, H. R., & Volk, T. L. (1990). Changing learner behavior through environmental education. The journal of environmental education, 21(3), 8-21.
https://doi.org/10.1080/00958964.1990.10753743
[6] Pooley, J. A., & O’Connor, M. (2000). Environmental education and attitudes: Emotions and beliefs are what is needed. Environment and behavior, 32(5), 711-723. http://journals.sagepub.com/doi/pdf/10.1177/00139165003 25007
[7] Wong, K. K. (2003). The environmental awareness of university students in Beijing, China. Journal of Contemporary China, 12(36), 519-536.
https://doi.org/10.1080/10670560305472
[8] Otto, S., & Pensini, P. (2017). Nature-based environmental education of children: Environmental knowledge and connectedness to nature, together, are related to ecological behaviour. Global Environmental Change, 47, 88-94. https://doi.org/10.1016/j.gloenvcha.2017.09.009
[9] Wals, A. E., Weakland, J., & Corcoran, P. B. (2017). Preparing for the Ecocene: Envisioning futures for
environmental and sustainability education. Japanese Journal of Environmental Education, 26(4), 4_71-76. https://doi.org/10.5647/jsoee.26.4_71
[10] Handler, D., Consultant, H. F. & Epstein, A. S. (2010). Nature education in preschool. High scope Extensions, 25(2), 1-7.
[11] Nair, S. M. (1992). Creating environmental awareness among children. ICCW news bulletin, 40(3-4), 41-3. https://www.popline.org/node/328732
[12] Köşker, N. (2013). Perceptions and Responsibilities of Primary School Students and Class Teacher Candidates towards Nature. Turkish Studies- International Periodical for the Languages, Literature and History of Turkish or Turkic. Vol: 8/3.
[13] https://tr.wikipedia.org/wiki/Sosyoekonomi. Date of Access: 08.08.2018
[14] Güven, S. (1999). Toplumbilim. Bursa: Ezgi Kitabevi Yayınları.
[15] Şahin, N. H., & Yeniçeri, Z. (2015). "Farkindalik" Üzerine Üç Araç: Psikolojik Farkindalik, Bütünleyici Kendilik Farkindaligi ve Toronto Bilgece Farkindalik Ölçekleri. Türk Psikoloji Dergisi, 30(76), 48.
[16] Yardımcı, E. (2009). Yaz Bilim Kampında Yapılan Etkinlik Temelli Doğa Eğitiminin İlköğretim 4 ve 5. Sınıftaki Çocukların Doğa Algılarına Ekisi. Bolu: Abant İzzet Baysal Üniversitesi. Master Thesis.
[17] Birinci, O. (2013). İlkokul 3. Sınıf Hayat Bilgisi Dersine Yönelik Geliştirilen Doğa Eğitimi Etkinliklerinin Öğrencilerin Doğa Algılarına Etkisi. Rize: Recep Tayyip Erdoğan Üniversitesi. Master Thesis.
[18] Creswell, J. W. (2014). Araştırma Deseni Nitel, Nicel ve Karma Yöntem Yaklaşımları. Trans. Ed. Selçuk Beşir Demir, 2017. Ankara: Eğiten Kitap.
[19] Creswell, J. W. &Plano Clark, V.L. (2011). Karma Yöntem Araştırmaları Tasarımı ve Yürütülmesi. Trans. Yüksel Dede, Selçuk Beşir Demir, 2014. Ankara: Anı Yayıncılık. [20] Karasar, N. (2011). Bilimsel Araştırma Yöntemi. 22.
Edition. Ankara: Nobel Yayıncılık.
[21] Glesne, C. (1992). Nitel Araştırmaya Giriş.Trans. Ed. Ali Ersoy, Pelin Yalçınoğlu, 2015. Ankara: Anı Yayıncılık. [22] Yıldız Yılmaz, N. & Taş, A. M. İlkokul Çevre Farkındalık
Ölçeği Geçerlik Güvenirlik Çalışması. Hitit Üniversitesi Sosyal Bilimler Enstitüsü Dergisi, 10(2), 1355-1372. [23] Merriam, S. B. (2009). Nitel Araştırma Desen ve Uygulama
İçin Bir Rehber.Çev. Ed. Selahattin Turan, 2015. Ankara: Nobel.
[24] Lilliefors, H. W. (1967). On the Kolmogorov-Smirnov test for normality with mean and variance unknown. Journal of the American statistical Association, 62(318), 399-402. http://amstat.tandfonline.com/doi/abs/10.1080/01621459.1 967.10482916#.Wko6bd-RqJg
[25] Shavelson, R. J. (1996). Sosyal Bilimler İçin İstatistik. Trans. Ed. Neşe Güler, 2016. Ankara: Pegem Akademi. [26] Alpar, R. (2016). Spor, Sağlık ve Eğitim Bilimlerinden
Örneklerle Uygulamalı İstatistik ve Geçerlik-Güvenirlik. Ankara: Detay Yayıncılık.
[27] Can, A. (2017). SPSS İle Bilimsel Araştırma Sürecinde Nicel Veri Analizi. Ankara: Pegem Akademi Yayıncılık. [28] Büyüköztürk, Ş., Çakmak, E., Akgün, Ö., Karadeniz, Ş. &
Demirel, F.(2009). Bilimsel Araştırma Yöntemleri. 4. Edition. Ankara: Pegem Akademi.
[29] Mayring, P. (2014). Qualitative Content Analysis. Theoretical Foundation, Basic Procedures and Software Solution. Austria.
www.files.qualitative-content-analysis.aau.at/. Date of Access: 18.04.2017.
[30] Krippendorff, K. (2004). Content Analysis: An Introduction to Its Methodology. London: Sage Publications.
[31] Yıldırım, A. & Şimşek, H. (2006).Sosyal Bilimlerde Nitel Araştırma Yöntemleri. 6. Edition. Ankara: Seçkin Yayıncılık.
[32] Miles, M. B. & Huberman, A. M. (1994). Nitel Veri Analizi. Trans. Ed. Sadegül Akbaba ve Ali Ersoy, 2016, Ankara: Pegem Akademi.
[33] Büyüköztürk, Ş. (2005). Sosyal Bilimler İçin Veri Analizi El Kitabı: İstatistik, Araştırma Deseni, SPSS Uygulamaları ve Yorum. Ankara: Pegem Akademi Yayıncılık.
[34] Shobeiri, S. M., Omidvar, B., & Prahallada, N. N. (2007). A comperative study of environmental awareness among secondary school students in Iran and India. International Journal of Environmental Research, 1(1), 28-34.http://ijer.ut.ac.ir/article_106_2a5323fc5cef5d4b1de 3ce6c7e73d2f7.pdf
[35] Fisman, L. (2005). The effects of local learning on environmental awareness in children: An empirical investigation. The Journal of Environmental Education,
36(3), 39-50. https://doi.org/10.3200/JOEE.36.3.39-50 [36] Hausbeck, K. W., Milbrath, L. W., & Enright, S. M. (1992).
Environmental knowledge, awareness and concern among 11th-grade students: New York State. The Journal of Environmental Education, 24(1), 27-34.
https://doi.org/10.1080/00958964.1992.9943493
[37] Uzun, N., & Sağlam, N. (2005). Sosyo-ekonomik durumun çevre bilinci ve çevre akademik başarısı üzerine etkisi. Hacettepe Üniversitesi Eğitim Fakültesi Dergisi, 29 (29). [38] Güven, E., & Aydoğdu, M. (2012). Çevre sorunlarına
yönelik farkındalık ölçeğinin geliştirilmesi ve öğretmen adaylarının farkındalık düzeylerinin belirlenmesi. Öğretmen Eğitimi ve Eğitimcileri Dergisi, 1(2), 185-202. www.jtee.org/document/issue2/2mak.pdf
[39] Özbebek Tunç, A., Ömür, G. A., & Düren, A. Z. (2012). Çevresel Farkındalık. İstanbul Üniversitesi Siyasal Bilgiler Fakültesi Dergisi, (47).
dergipark.gov.tr/download/article-file/5698
[40] Uzun, N., Keleş, Ö, & Uzun, F. V. (2013). The effects of nature education project on the environmental sensitivity. TOJSAT: The Online Journal of Science and Technology, 3(1), 160-165.
http://www.academia.edu/download/31041951/89-108-1-P B.pdf
[41] Feyzioğlu, B., Özenoğlu Kiremit, H., Öztürk Samur, A., Aladağ, E. (2012). Yibolar Doğal Ortamda Bilimsel Düşünüyor. Eğitim ve Öğretim Araştırmaları Dergisi. Volume: 1, Number: 4
[42] Kahyaoğlu, M. (2015). İlköğretim Öğrencilerinin Doğa Kavramına İlişkin Algılarının Metaforlar Yoluyla İncelenmesi. Turkish Studies- International Periodical for the Languages, Literature and History of Turkish or Turkic. Vol: 10/11.