KADIR HAS UNIVERSITY
GRADUATE SCHOOL OF SOCIAL SCIENCES
THE RELATIONSHIP BETWEEN HAPPINESS AND PERCEIVED INCOME INEQUALITY AS WELL AS SOME SOCIAL INDICATORS: A COMPARATIVE ANALYSIS ON TURKEY AND SELECTED
EUROPEAN COUNTRIES
GRADUATE THESIS SİMGE GÜNAY
S im ge Güna y M.A The sis 2016
THE RELATIONSHIP BETWEEN HAPPINESS AND PERCEIVED INCOME INEQUALITYAS WELL AS SOME SOCIAL INDICATORS: A COMPARATIVE ANALYSIS ON TURKEY AND SELECTED
EUROPEAN COUNTRIES
SİMGE GÜNAY
Submitted to the Graduate School of Social Sciences in partial fulfillment of the requirements for the degree of Master of Arts in
ECONOMICS.
KADİR HAS UNIVERSITY
vi TABLE of CONTENTS Abstract ix Özet xi Acknowledgements xiv
List of Tables xvi
Abbreviations xxxviii
1. Introduction 1
1.1 Perceived Income Distribution and Perceived Income Inequality 5
1.1.1 How is Perceived Income Distribution Defined?...5
1.1.2 How is Perceived Income Inequality Defined?... 5
1.1.3 Methods of Measurement of Perceived Income Inequality……….. 6
1.1.4 The Lack of Methods of Measurement of Perceived Income Inequality..7
1.2 Notion of Happiness 9
1.2.1 Varios Definitions of Happiness……….10
1.2.2 Understanding the Purpose of Using Happiness Data………....12
1.2.3 On the Measurement of Happiness……….13
1.2.4 Determinants of Happiness……….19
vii 1.2.5.1 Germany ……….. 23 1.2.5.2 Finland………..25 1.2.5.3 Norway……….27 1.2.5.4 Spain ………28 1.2.5.5 Sweden ……… 28 1.2.5.6 Switzerland………...30 1.2.5.7 Turkey ………..31
1.2.6 Scope and Limits of The Literature………33
2. Literature Review 36
2.1 Studies about Perceived Income Distribution and Perceived Income Inequality ………...36
2.2 Studies about the Relationship between Perceived Happiness and Some Social Characteristics………..44
2.3 Studies about the Relationship between Perceived Income Inequality and Happiness………51
3. Methodology 55
3.1 Theoretical Framework of the Study………...55
3.1.1 Generalized Ordered Logit Models………..55
3.2 Empirical Analysis………...60
3.2.1 Scope and Limits of This Study………...60
viii
3.2.2 Data……….. 63
3.2.3 Expected Outcomes………..77
3.2.4 Empirical Strategy of the Study………...78
3.2.5 Empirical Results of the Study……….81
3.2.5.1 Regression Analysis Results by Countries………...91
3.2.6 Result Comparisons………117
3.2.6.1 Turkey vs East Germany ………117
3.2.6.2 Turkey vs Finland………119
3.2.6.3 Turkey vs Norway ………..121
3.2.6.4 Turkey vs Spain ………..123
3.2.6.5 Turkey vs Sweden ………..125
3.2.6.6 Turkey vs Switzerland ………127
3.2.6.7 Turkey vs West Germany ……….. 130
3.2.7 Check for Robustness……….132
3.2.8 Discussion………...136 4. Conclusion 147 References 152 Appendix A 161 Appendix B 171 Appendix C 351 Appendix D 367
ix
ABSTRACT
The Relationship between Happiness and Perceived Income Inequality as well as Some Social Indicators: A Comparative Analysis on Turkey and Selected European Countries
Simge Günay
Master of Social Sciences in Economics Advisor: Associate Professor Meltem Ucal June, 2016
In recent years, the relationship between happiness and income distribution has become an important issue in the economics literature. Underlying reason of this situation is the widening income gap between the rich and the poor since 1980s. Several studies have traced the link between happiness and income inequality especially since the last two decades. It is also very important to study “perceived” income distribution and inequality because they may show different approaches to income distribution and inequality from many individuals. The aim of this study will be to explore the relationship between perceived happiness level and perceived income inequality in Turkey and the other selected OECD countries using the World Values Survey data. The main question will be whether and to what extent perceived income inequality affects happiness level of individuals who live in those countries. In addition, some social characterictics and socio-demographic variables will be used to learn whether they affect people’s happiness or not in Turkey and other selected
x
countries more or less than their perceptions to income inequality. Generalized ordered logit model analysis will be used in the study because it fits to the nature of our data. This study is expected to contribute to the literature in the sense that it will give relevant people a point of view about the relationship between perceived happiness of people who live in selected countries and perceived income inequality as well as selected variables, because a similar comprehensive and comparative study has not been found in the literature, which especially addresses Turkey yet. At the end of the empirical analysis, it is seen that perceptions to income inequality impact on happiness level positively, however, its impact is weaker than other social and demographic variables in the analysis.
Keywords: happiness, perceived income inequality, generalized ordered logit models, comparative analysis, Turkey.
xi
ÖZET
BAZI SOSYAL GÖSTERGELERİN YANI SIRA ALGILANAN GELİR EŞİTSİZLİĞİNİN MUTLULUK İLE İLİŞKİSİ: TÜRKİYE İLE SEÇİLMİŞ AVRUPA ÜLKELERİ ÜZERİNE KIYASLAMALI BİR ANALİZ
Simge Günay
Ekonomi, Yüksek Lisans Tezi
Danışman: Doçent Doktor Meltem Ucal
Haziran, 2016
Mutluluk ve gelir dağılımı ilişkisini konu edinen çalışmalar dünya literatüründe yer almaktadır. Kişiler arasındaki gelir eşitsizliğinin özellikle 1980 yıllarından bu yana artmakta olduğunu gösteren yayınların konuyla ilgili çalışmaların yapılmasındaki etkisi kanıksanamaz bir gerçektir. Ekonomistler iki değişken arasındaki olası ilişkiyi araştırırken ekonometrik yöntemlerden yararlanmakta ve eşitsizliğin belirlenmesinde özellikle Gini katsayısı’ndan faydalanmaktadırlar. Günümüzde, kişilerin mutluluk seviyeleri ve gelir eşitsizliği arasındaki ilişkinin belirlenmesinde, kişilerin
perspektifleri önem kazanmaktadır. Bu araştırma, gelir dağılımını bireylerin bakış açısıyla görmek, farklı perspektiflerin mutluluk seviyeleri üzerindeki etkisinde oluşabilecek değişiklikleri irdeleyebilmek açısından dikkate değerdir. Bu çalışmada, algılanan gelir eşitsizliği ile kişilerin mutlulukları arasındaki ilişki, hazır anket verisi kullanılarak incelenecektir. Yapılacak çalışma, Türkiye ile anketten seçilmiş olan
xii
Ekonomik İşbirliği ve Kalkınma Örgütü’ne üye -bazı veri sınırları nedeniyle- yedi ülkenin karşılaştırmalı bir analizini konu edinmektedir. Konuyu incelerken, algılanan gelir eşitsizliğinin mutluluk üzerinde herhangi bir etkisinin olup olmadığı ve diğer demografik ve sosyal değişkenlerin mutluluk seviyeleri üzerinde gelir eşitsizliğine kıyasla ne kadar etkili olduğu gibi soruların üzerinde durulacaktır. Değişkenler arasındaki ilişkinin, veri setiyle uyumlu olduğu belirlenen genel sıralı logit
yöntemiyle çözülmesi kararlaştırılmıştır. Çalışmanın literatüre ve ilgililere sağlaması beklenen en önemli katkı, Türkiye ve seçilmiş ülkelerdeki algılanan gelir eşitsizliği ve mutluluk seviyeleri arasındaki ilişki hakkında bir fikir verebilmesidir. Özellikle Türkiye’deki mutluluk literatüründe hissedilmekte olan çalışma eksikliği ve konunun bu çalışmada kullanılan değişkenler ve analiz yöntemiyle ilgili benzer bir
araştırmasının olmayışı, bu çalışmanın literatüre sağlayacağı beklenen katkının temelini oluşturmaktadır. Bazı demografik ve sosyal değişkenler kullanılarak konunun kıyaslamalı şekilde incelenecek olması, çalışmada sadece gelir eşitsizliği algılamasına odaklanılmadığını, ayrıca incelenecek ilişkiyle ilgili perspektifi genişletmeye çalışıldığını göstermek istemektedir. Yapılan analiz sonucunda, bireylerin gelir eşitsizliğine bakış açısının mutlulukları üzerinde pozitif bir etkiye sahip oldukları görülmüş fakat bu etkinin diğer bazı sosyal ve sosyo-demografik değişkenlere göre etkisinin oldukça zayıf olduğu gözlenmiştir.
Anahtar Kelimeler: mutluluk, algılanan gelir eşitsizliği, genel sıralı logit yöntemi,
Türkiye ile bazı Avrupa ülkelerinin karşılaştırmalı analizi.
xiii
This thesis is dedicated to my family, my mother and my father, for their unlimited trust and priceless support and love, and to my aunt, Hikmet Dalgıç. I wish she could have a chance to get a higher education instead of being obliged to work for her family. If she accept this thesis as a little gift for her invaluable sacrifice, I will be very pleased with this situation.
xiv
ACKNOWLEDGEMENTS
I would like to thank my thesis advisor Associate Professor Meltem Ucal of Graduate School of Social Sciences at Kadir Has University. Professor Ucal gave me a
direction by lighting the challenging way of my thesis. If she did not push me for improving my rough way, I would not be able to find my true path. I hope she would accept these modest lines as a token of my sincere appreciation.
I would also like to thank Associate Professor Ali Akkemik of Graduate School of Social Sciences at Kadir Has University. At the very beginning of my study, he provided me a deep understanding of clarifying the topic of my thesis. Thank you very much Professor Akkemik. Your suggestions and support are very important to me.
I would also like to thank Associate Professor Bekir Kayacan of the Department of Economic Development and International Economics at Istanbul University for his deep concern and valuable opinions about my thesis study.
It would be an unfortunate mistake if I forgot to thank Assistant Professor Özge Gökdemir of the Department of Economic Development and International
Economics at Istanbul University for her invaluable help and support. I appreciate her time and concern.
xv
I owe a lot to Uğur Kaplan of the School of Business Administration at Atılım University. I appreciate his time in helping me about organizing the data set and showing me how to overcome data difficulties.
Finally, I am greatly indebted to Assoc. Prof. Dr. Richard Williams of the
Department of Sociology at University of Notre Dame for his interest to my study and help me about some questions, which relate to generalized ordered logit models. His help means a lot to me. Thank you so much, Dear Professor Williams.
xvi
LIST of TABLES1
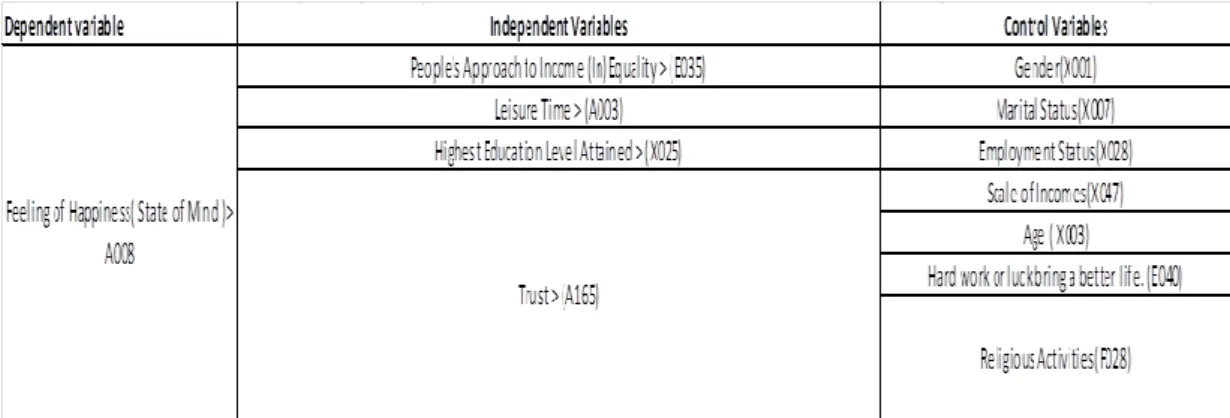
Table 3 Introducing the Dependent, Independent, and Control Variables in the
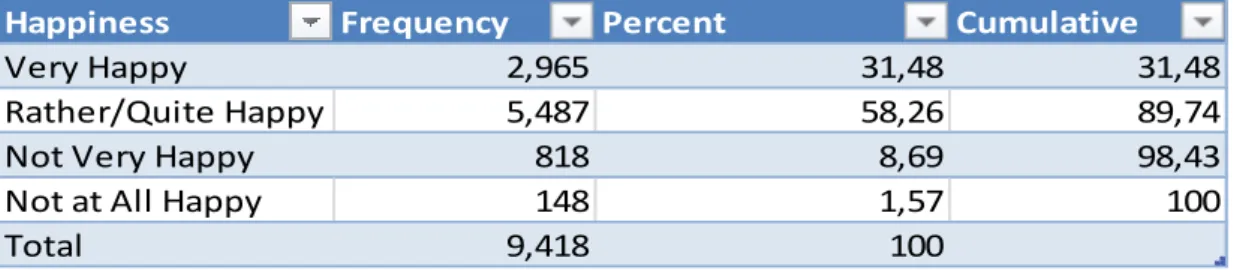
Regression Analysis………62 Table 3.1 Frequencies, Percents and Cumulatives of Happiness Data in th 3rd
Wave………...65 Table 3.2 Happiness Data by Countries (Frequencies, Percents,
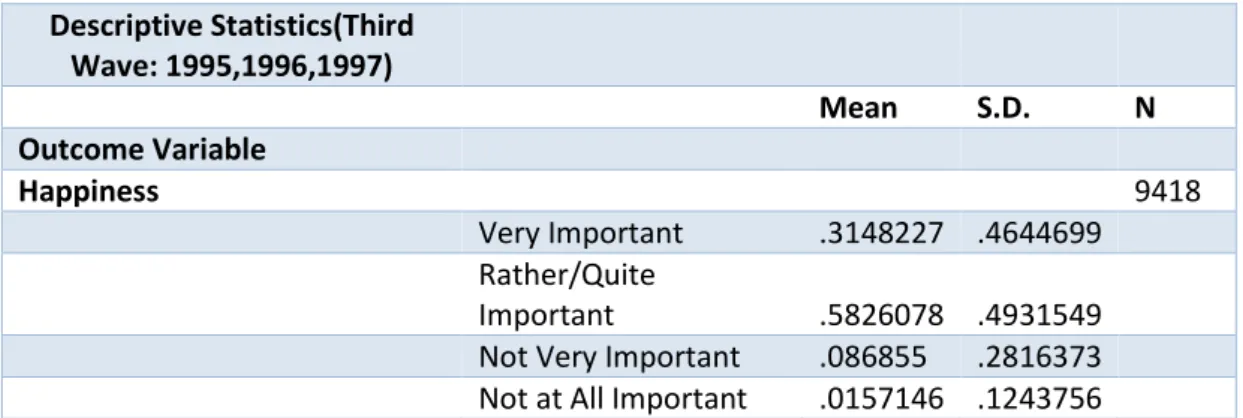
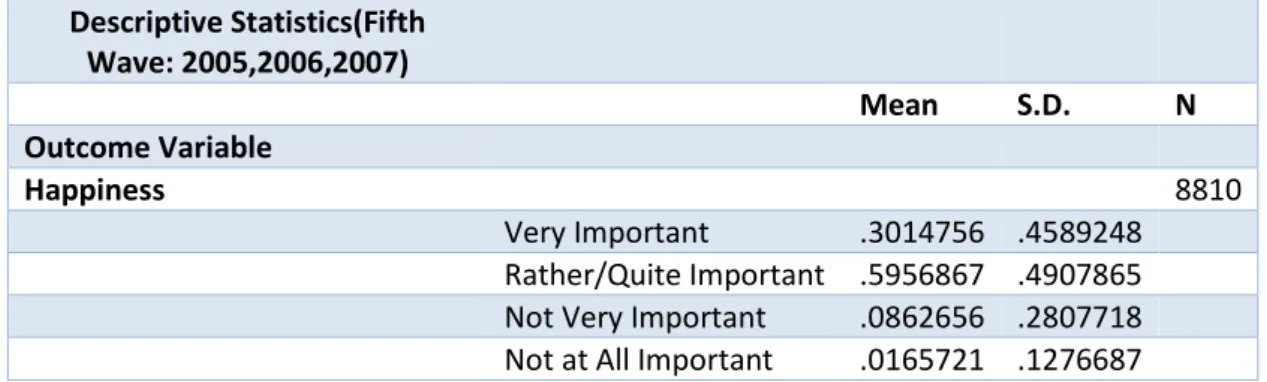
Cumulatives)………...66 Table 3.3 Descriptive Statistics of Happiness in the 3rd Wave………...67 Table 3.4 Frequencies, Percents and Cumulatives of Happiness Data in the 5th
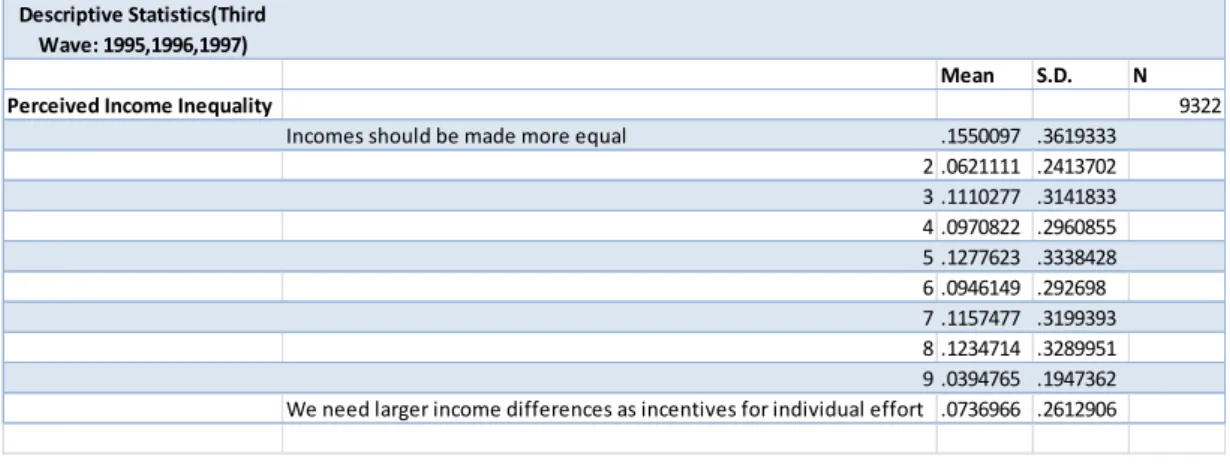
Wave………...67 Table 3.5 Descriptive Statistics of Happiness in the 5th Wave………...68 Table 3.6 Perceived Income Inequality Data in the 3rd Wave………68 Table 3.7 Descriptive Statistics of Perceived Income Inequality Data in the 3rd Wave………...69 Table 3.8 Perceived Income Inequality Data in the 5th Wave………70 Table 3.9 Descriptive Statistics of Perceived Income Inequality Data in the 5th
Wave………...70 Table 3.10 Perceived Income Inequality Data by Countries………..71 Table 3.11 Generalized Ordered Regression Results of the Third
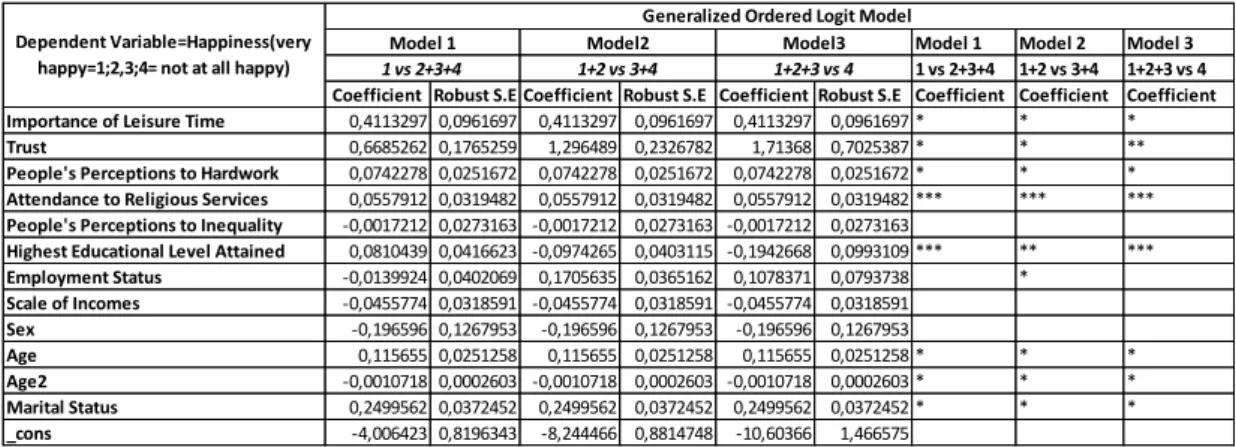
Wave………...80
1 Note: Table 3 indicates the first table in text in Chapter 3. Table B.1 indicates the first table in
Appendix B. Table C.1 indicates the first table in Appendix C. Table D.1 indicates the first table in Appendix D.
xvii
Table 3.12 Test for Parallel Lines Assumption using Gamma Option………...85
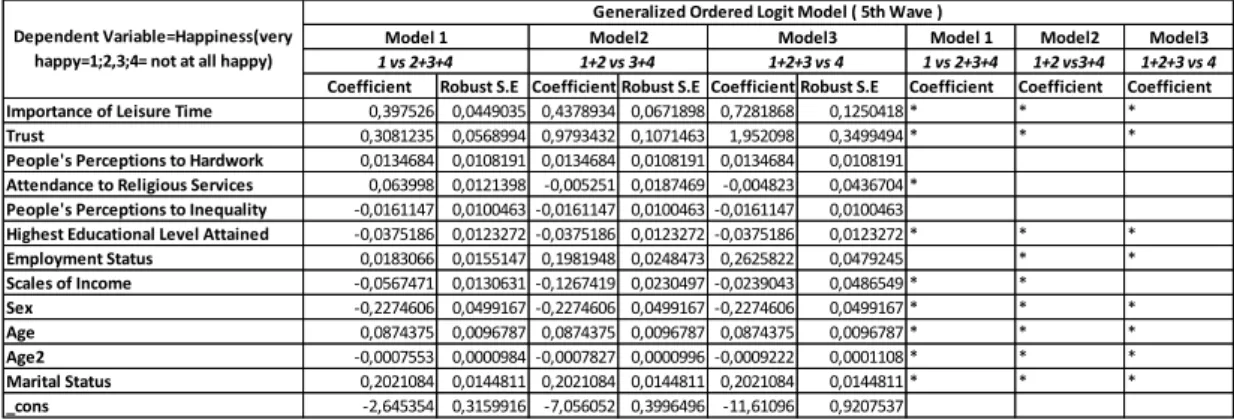
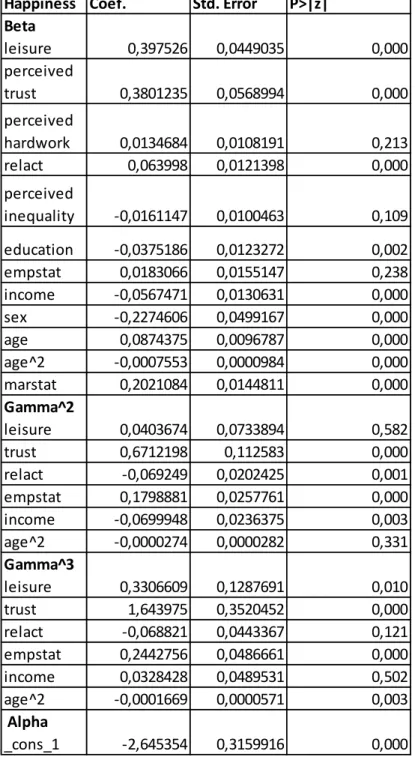
Table 3.13 Generalized Ordered Regression Results of the Fifth Wave………...86
Table 3.14 Test for Parallel Lines Assumption using Gamma Option………...89
Table 3.15 Generalized Ordered Regression Results of the East Region of Germany………..90
Table 3.16 Generalized Ordered Regression Results of the West Region of Germany………..94
Table 3.17 Generalized Ordered Regression Results of Finland………97
Table 3.18 Generalized Ordered Regression Results of Norway……….101
Table 3.19 Generalized Ordered Regression Results of Spain……….104
Table 3.20 Generalized Ordered Regression Results of Sweden……….107
Table 3.21 Generalized Ordered Regression Results of Switzerland………...109
Table 3.22 Generalized Ordered Regression Results of Turkey………...113
Table A.1 Regression Results with regard to Odds Ratios in the Third Wave…….161
Table A.2 Regression Results with regard to Odds Ratios in the Fifth Wave……..162
Table A.3 Odds Ratios of East Germany………..163
Table A.4 Odds Ratios of Finland………164
Table A.5 Odds Ratios of Norway………165
Table A.6 Odds Ratios of Spain………...166
Table A.7 Odds Ratios of Sweden………167
xviii
Table A.9 Odds Ratios of Turkey……….169
Table A.10 Odds Ratios of West Germany………..170
Tables B.1 Marginal Effects in the Third Wave………...171
Tables B.2 Marginal Effects in the Fifth Wave………189
Tables B.3 Marginal Effects in East Germany……….209
Tables B.4 Marginal Effects in Finland………...227
Tables B.5 Marginal Effects of Norway………...244
Tables B.6 Marginal Effects of Spain………...262
Tables B.7 Marginal Effects of Sweden………...280
Tables B.8 Marginal Effects of Switzerland……….298
Tables B.9 Marginal Effects of Turkey………....316
Tables B.10 Marginal Effects of West Germany……….333
Table C.1 East Germany- Regression Results after Hardwork Controlled………. 351
Table C.2 Finland- Regression Results after Hardwork Controlled…...352
Table C.3 Norway- Regression Results after Hardwork Controlled………...353
Table C.4 Spain- Regression Results after Hardwork Controlled………...354
Table C.5 Sweden- Regression Results after Hardwork Controlled………...355
Table C.6 Switzerland- Regression Results after Hardwork Controlled………….356
Table C.7 Turkey- Regression Results after Hardwork Controlled……….357
Table C.8 West Germany- Regression Results after Hardwork Controlled……….358
Table C.9 East Germany- Regression Results after Income Controlled…………..359
xix
Table C.11 Norway- Regression Results after Income Controlled………..361
Table C.12 Spain- Regression Results after Income Controlled………..362
Table C.13 Sweden- Regression Results after Income Controlled………...363
Table C.14 Switzerland- Regression Results after Income Controlled………364
Table C.15 Turkey- Regression Results after Income Controlled………365
Table C.16 West Germany- Regression Results after Income Controlled………...366
Table D.1 Results of ‘wtest’ for Happiness and Perceived Leisure Time in the 3rd Wave……….367
Table D.2 Results of ‘wtest’ for Happiness and Perceived Trust in the 3rd Wave……….367
Table D.3 Results of ‘wtest’ for Happiness and Perceived Hard work in the 3rd Wave……….367
Table D.4 Results of ‘wtest’ for Happiness and the Frequency of Attending to Religious Services in the 3rd Wave………...367
Table D.5 Results of ‘wtest’ for Happiness and Perceived Inequality in the 3rd Wave……….368
Table D.6 Results of ‘wtest’ for Happiness and the Highest Educational Level Attained in the 3rd Wave………...368
Table D.7 Results of ‘wtest’ for Happiness and Employment Status in the 3rd Wave……….368
Table D.8 Results of ‘wtest’ for Happiness and Scales of Income in the 3rd Wave……….368
Table D.9 Results of ‘wtest’ for Happiness and Sex in the 3rd Wave………...369
Table D.10 Results of ‘wtest’ for Happiness and Age in the 3rd Wave………369
Table D.11 Results of ‘wtest’ for Happiness and Age^2 in the 3rd Wave…………369
Table D.12 Results of ‘wtest’ for Happiness and Marital Status in the 3rd Wave……….369
Table D.13 Results of ‘wtest’ for Happiness and Importance of Leisure Time in the 5th Wave………369
xx
Table D.14 Results of ‘wtest’ for Happiness and Perceived Trust in the 5th
Wave………370 Table D.15 Results of ‘wtest’ for Happiness and Perceived Hard work in the 5th
Wave………370 Table D.16 Results of ‘wtest’ for Happiness and Frequency of Attending the
Religious Services in the 5th Wave………..370 Table D.17 Results of ‘wtest’ for Happiness and Perceived Inequality in the 5th
Wave………370 Table D.18 Results of ‘wtest’ for Happiness and the Highest Educational Level Attained in the 5th Wave………..371 Table D.19 Results of ‘wtest’ for Happiness and Employment Status in the 5th
Wave………371 Table D.20 Results of ‘wtest’ for Happiness and Scales of Income in the 5th
Wave………371 Table D.21 Results of ‘wtest’ for Happiness and Sex in the 5th
Wave………371 Table D.22 Results of ‘wtest’ for Happiness and Age in the 5th
Wave………372 Table D.23 Results of ‘wtest’ for Happiness and Age^2 in the 5th
Wave…………372 Table D.24 Results of ‘wtest’ for Happiness and Marital Status in the 5th
Wave……….372 Table D.25 Results of ‘wtest’ for Happiness and Importance of Leisure Time in the East Region of Germany………...372 Table D.26 Results of ‘wtest’ for Happiness and Perceived Trust in the East Region of Germany………...373 Table D.27 Results of ‘wtest’ for Happiness and Perceived Hard work in the East Region of Germany………..373 Table D.28 Results of ‘wtest’ for Happiness and Frequency of Attending the
Religious Services in the East Region of Germany……….373 Table D.29 Results of ‘wtest’ for Happiness and Perceived Inequality in the East Region of Germany………..373 Table D.30 Results of ‘wtest’ for Happiness and the Highest Educational Level Attained in the East Region of Germany……….374 Table D.31 Results of ‘wtest’ for Happiness and Employment Status in the East Region of Germany………..374
xxi
Table D.32 Results of ‘wtest’ for Happiness and Scales of Income in the East Region of Germany………...374 Table D.33 Results of ‘wtest’ for Happiness and Sex in the East Region of
Germany………374 Table D.34 Results of ‘wtest’ for Happiness and Age in the East Region of
Germany………375 Table D.35 Results of ‘wtest’ for Happiness and Age^2 in the East Region of
Germany………375 Table D.36 Results of ‘wtest’ for Happiness and Marital Status in The East Region of Germany………...375 Table D.37 Results of ‘wtest’ for Happiness and Importance of Leisure Time in the West Region of Germany………..375 Table D.38 Results of ‘wtest’ for Happiness and Perceived Trust in the West Region of Germany………...376 Table D.39 Results of ‘wtest’ for Happiness and Percived Hard work in the West Region of Germany………...376 Table D.40 Results of ‘wtest’ for Happiness and Frequency of Attending the
Religious Services in the West Region of Germany……….376 Table D.41 Results of ‘wtest’ for Happiness and Perceived Inequality in the West Region of Germany………...376 Table D.42 Results of ‘wtest’ for Happiness and the Highest Educational Level Attained in the West Region of Germany……….377 Table D.43 Results of ‘wtest’ for Happiness and Employment Status in the West Region of Germany………...377 Table D.44 Results of ‘wtest’ for Happiness and Scales of Income in the West
Region of Germany………...377 Table D.45 Results of ‘wtest’ for Happiness and Sex in the West Region of
Germany………377 Table D.46 Results of ‘wtest’ for Happiness and Age in the West Region of
Germany………378 Table D.47 Results of ‘wtest’ for Happiness and Age^2 in the West Region of the Germany………378
xxii
Table D.48 Results of ‘wtest’ for Happiness and Marital Status in the West Region of the Germany………..378 Table D.49 Results of ‘wtest’ for Happiness and Importance of Leisure Time in Finland………..378 Table D.50 Results of ‘wtest’ for Happiness and Perceived Trust in Finland……..379 Table D.51 Results of ‘wtest’ for Happiness and Perceived Hard work in
Finland………..379 Table D.52 Results of ‘wtest’ for Happiness and Frequency of Attending to Religious Services in Finland………379 Table D.53 Results of ‘wtest’ for Happiness and Perceived Inequality in
Finland………..379 Table D.54 Results of ‘wtest’ for Happiness and the Highest Educational Level Attained in Finland………...380 Table D.55 Results of ‘wtest’ for Happiness and Employment Status in
Finland………..380 Table D.56 Results of ‘wtest’ for Happiness and Scales of Income in
Finland………..380 Table D.57 Results of ‘wtest’ for Happiness and Sex in Finland………...380 Table D.58 Results of ‘wtest’ for Happiness and Age in Finland………381 Table D.59 Results of ‘wtest’ for Happiness and Age^2 in Finland………381 Table D.60 Results of ‘wtest’ for Happiness and Marital Status in Finland………381 Table D.61 Results of ‘wtest’ for Happiness and Importance of Leisure Time in Norway………..381 Table D.62 Results of ‘wtest’ for Happiness and Perceived Trust in Norway…….381 Table D.63 Results of ‘wtest’ for Happiness and Perceived Hard work in
Norway……….382 Table D.64 Results of ‘wtest’ for Happiness and Frequency of Attending the
Religious Services in Norway………..382 Table D.65 Results of ‘wtest’ for Happiness and Perceived Inequality in
Norway……….382 Table D.66 Results of ‘wtest’ for Happiness and the Highest Educational Level Attained in Norway………..382
xxiii
Table D.67 Results of ‘wtest’ for Happiness and Employment Status in
Norway……….383 Table D.68 Results of ‘wtest’ for Happiness and Scales of Income in
Norway……….383 Table D.69 Results of ‘wtest’ for Happiness and Sex in Norway………383 Table D.70 Results of ‘wtest’ for Happiness and Age in Norway………383 Table D.71 Results of ‘wtest’ for Happiness and Age^2 in Norway………383 Table D.72 Results of ‘wtest’ for Happiness and Marital Status in Norway………384 Table D.73 Results of ‘wtest’ for Happiness and Importance of Leisure Time in Spain……….384 Table D.74 Results of ‘wtest’ for Happiness and Perceived Trust in Spain……….384 Table D.75 Results of ‘wtest’ for Happiness and Perceived Hard work in
Spain……….384 Table D.76 Results of ‘wtest’ for Happiness and Frequency of Attending to Religious Services in Spain………..385 Table D.77 Results of ‘wtest’ for Happiness and Perceived Inequality in
Spain……….385 Table D.78 Results of ‘wtest’ for Happiness and the Highest Educational Level Attained in Spain………..385 Table D.79 Results of ‘wtest’ for Happiness and Employment Status in
Spain……….385 Table D.80 Results of ‘wtest’ for Happiness and Scales of Income in
Spain……….386 Table D.81 Results of ‘wtest’ for Happiness and Sex in Spain.………...386 Table D.82 Results of ‘wtest’ for Happiness and Age in Spain………...386 Table D.83 Results of ‘wtest’ for Happiness and Age^2 in Spain………...386 Table D.84 Results of ‘wtest’ for Happiness and Marital Status in
Spain……….386 Table D.85 Results of ‘Wtest’ for Happiness and Importance of Leisure Time in Sweden……….387 Table D.86 Results of ‘wtest’ for Happiness and Perceived Trust in Sweden……387
xxiv
Table D.87 Results of ‘wtest’ for Happiness and Perceived Hard work in
Sweden………387 Table D.88 Results of ‘wtest’ for Happiness and Frequency of Attending the
Religious Services in Sweden………...387 Table D.89 Results of ‘wtest’ for Happiness and Perceived Inequality in
Sweden………388 Table D.90 Results of ‘wtest’ for Happiness and the Highest Educational Level Attained in Sweden……….388 Table D.91 Results of ‘wtest’ for Happiness and Employment Status in
Sweden………....388 Table D.92 Results of ‘wtest’ for Happiness and Scales of Incomes in
Sweden………388 Table D.93 Results of ‘wtest’ for Happiness and Sex in Sweden………..388 Table D.94 Results of ‘wtest’ for Happiness and Age in Sweden………..389 Table D.95 Results of ‘wtest’ for Happiness and Age^2 in Sweden………..389 Table D.96 Results of ‘wtest’ for Happiness and Marital Status in
Sweden………389 Table D.97 Results of’wtest’ for Happiness and Importance of Leisure Time in Switzerland……….389 Table D.98 Results of’wtest’ for Happiness and Perceived Trust in
Switzerland……….389 Table D.99 Results of ‘wtest’ for Happiness and Perceived Hard work in
Switzerland……….390 Table D.100 Results of ‘wtest’ for Happiness and Frequency of Attending the Religious Services in Swizerland………390 Table D.101 Results of ‘wtest’ for Happiness and Perceived Inequality in
Switzerland……….390 Table D.102 Results of ‘wtest’ for Happiness and the Highest Educational Level Attained in Switzerland………..390 Table D.103 Results of ‘wtest’ for Happiness and Employment Status in
Switzerland……….391 Table D.104 Results of ‘wtest’ for Happiness and Scales of Income in
xxv
Table D.105 Results of ‘wtest’ for Happiness and Sex in Switzerland…………..391 Table D.106 Results of ‘wtest’ for Happiness and Age in Switzerland………….391 Table D.107 Results of ‘wtest’ for Happiness and Age^2 in Switzerland……….392 Table D.108 Results of ‘wtest’ for Happiness and Marital Status in
Switzerland……….392 Table D.109 Results of ‘wtest’ for Happiness and Importance of Leisure Time in Turkey……….392 Table D.110 Results of ‘wtest’ for Happiness and Perceived Trust in
Turkey……….392 Table D.111 Results of ‘wtest’ for Happiness and Perceived Hard work in
Turkey……….393 Table D.112 Results of ‘wtest’ for Happiness and Frequency of Attending to
Religious Services in Turkey………..393 Table D.113 Results of ‘wtest’ for Happiness and Perceived Inequality in
Turkey……….393 Table D.114 Results of ‘wtest’ for Happiness and the Highest Educational Level Attained in Turkey………..393 Table D.115 Results of ‘wtest’ for Happiness and Employment Status in
Turkey……….394 Table D.116 Results of ‘wtest’ for Happiness and Scales of Income in
Turkey……….394 Table D.117 Results of ‘wtest’ for Happiness and Sex in Turkey………..394 Table D.118 Results of ‘wtest’ for Happiness and Age in Turkey………..394 Table D.119 Results of ‘wtest’ for Happiness and Age^2 in Turkey………..394 Table D.120 Results of ‘wtest’ for Happiness and Marital Status in Turkey……...395 Table D.121 Results of ‘simanova’ for Happiness and Importance of Leisure Time in
the 3rd Wave………..395
Table D.122 Results of ‘simanova’ for Happiness and Perceived Trust in the 3rd
Wave……….396 Table D.123 Results of ‘simanova’ for Happiness and Perceived Hard work in the 3rd
xxvi
Table D.124 Results of ‘simanova’ for Happiness and Frequency of Attending the Religious Services in the 3rd Wave………...398 Table D.125 Results of ‘simanova’ for Happiness and Perceived Inequality in the 3rd
Wave……….399 Table D.126 Results of ‘simanova’ for Happiness and the Highest Educational Level Attained in the 3rd Wave………...400 Table D.127 Results of ‘simanova’ for Happiness and Employment Status in the 3rd
Wave……….401 Table D.128 Results of ‘simanova’ for Happiness and Scales of Income in the 3rd
Wave……….402 Table D.129 Results of ‘simanova’ for Happiness and Sex in the 3rd
Wave………403 Table D.130 Results of ‘simanova’ for Happiness and Age in the 3rd
Wave……...403 Table D.131 Results of ‘simanova’ for Happiness and Age^2 in the 3rd
Wave……….404 Table D.132 Results of ‘simanova’ for Happiness and Marital Status in the 3rd
Wave……….404 Table D.133 Results of ‘simanova’ for Happiness and Importance of Leisure Time in
the 5th Wave………..405
Table D.134 Results of ‘simanova’ for Happiness and Perceived Trust in the 5th
Wave……….406 Table D.135 Results of ‘simanova’ for Happiness and Perceived Hard work in the 5th
Wave……….407 Table D.136 Results of ‘simanova’ for Happiness and Frequency of Attending the Religious Services in the 5th
Wave……….408 Table D.137 Results of ‘simanova’ for Happiness and Perceived Inequality in the 5th
Wave……….409 Table D.138 Results of ‘simanova’ for Happiness and the Highest Educational Level Attained in the 5th
Wave……….410 Table D.139 Results of ‘simanova’ for Happiness and Employment Status in the 5th
Wave……….411 Table D.140 Results of ‘simanova’ for Happiness and Sex in the 5th
xxvii
Table D.141 Results of ‘simanova’ for Happiness and Age in the 5th
Wave……...412 Table D.142 Results of ‘simanova’ for Happiness and Age^2 in the 5th
Wave……….413 Table D.143 Results of ‘simanova’ for Happiness and Marital Status in the 5th
Wave……….413 Table D.144 Results of ‘simanova’ for Happiness and Importance of Leisure Time in the East Region of Germany……….414 Table D.145 Results of ‘simanova’ for Happiness and Perceived Trust in the East Region of
Germany………415 Table D.146 Results of ‘simanova’ for Happiness and Perceived Hard work in the East Region of
Germany………416 Table D.147 Results of ‘simanova’ for Happiness and Frequency of Attending to Religious Services in the East Region of Germany………..417 Table D.148 Results of ‘simanova’ for Happiness and Perceived Inequality in the East Region of
Germany………418 Table D.149 Results of’simanova’ for Happiness and the Highest Educational Level Attained in the East Region of
Germany………...419 Table D.150 Results of ‘simanova’ for Happiness and Employment Status in the East Region of
Germany………420 Table D.151 Results of ‘simanova’ for Happiness and Scales of Income in the East Region of Germany………...421 Table D.152 Results of ‘simanova’ for Happiness and Sex in the East Region of Germany………422 Table D.153 Results of ‘simanova’ for Happiness and Age in the East Region of Germany………422 Table D.154 Results of ‘simanova’ for Happiness and Age^2 in the East Region of Germany………423 Table D.155 Results of ‘simanova’ for Happiness and Marital Status in the East Region of Germany………...424
xxviii
Table D.156 Results of ‘simanova’ for Happiness and Importance of Leisure Time in the West Region of Germany………425 Table D.157 Results of ‘simanova’ for Happiness and Perceived Trust in the West Region of
Germany………426 Table D.158 Results of ‘simanova’ for Happiness and Perceived Hard work in the West Region of West
Germany………427 Table D.159 Results of ‘simanova’ for Happiness and Frequency of Attending the Religious Services in the West Region of Germany……….428 Table D.160 Results of ‘simanova’ for Happiness and Perceived Inequality in the West Region of Germany………..429 Table D.161 Results of ‘simanova’ for Happiness and the Highest Educational Level Attained in the West Region of Germany……….430 Table D.162 Results of ‘simanova’ for Happiness and Employment Status in The West Region of Germany………..431 Table D.163 Results of ‘simanova’ for Happiness and Scales of Income in the West Region of Germany………...432 Table D.164 Results of ‘simanova’ for Happiness and Sex in the West Region of Germany………433 Table D.165 Results of ‘sianova’ for Happiness and Age in the West Region of Germany………433 Table D.166 Results of ‘simanova’ for Happiness and Age^2 in the West Region of Germany………434 Table D.167 Results of ‘simanova’ for Happiness and Marital Status in the West region of Germany………435 Table D.168 Results of ‘simanova’ for Happiness and Importance of Leisure Time in Finland………..436 Table D.169 Results of ‘simanova’ for Happiness and Perceived Trust in Finland.436 Table D.170 Results of ‘simanova’ for Happiness and Perceived Hard work in
Finland………..437 Table D.171 Results of ‘simanova’ for Happiness and Frequency of Attending Religious Services in Finland………..438
xxix
Table D.172 Results of ‘simanova’ for Happiness and Perceived Inequality in
Finland………..439 Table D. 173 Results of ‘simanova’ for Happiness and the Highest Educational Level Attained in Finland………...440 Table D.174 Results of ‘simanova’ for Happiness and Employment Status in
Finland………..441 Table D.175 Results of ‘simanova’ for Happiness and Scales of Income
in Finland………..442 Table D.176 Results of’simanova’ for Happiness and Sex in Finland……….443 Table D.177 Results of ‘simanova’ for Happiness and Age in Finland…………...444 Table D.178 Results of ‘simanova’ for Happiness and Age^2 in Finland………...444 Table D.179 Results of ‘simanova’ for Happiness and Marital Status in
Finland………..445 Table D.180 Results of ‘simanova’ for Happiness and Importance of Leisure Time in Norway……….446 Table D.181 Results of ‘simanova’ for Happiness and Perceived Trust in
Norway……….446 Table D.182 Results of ‘simanova’ for Happiness and Perceived Hard work in Finland………..447 Table D.183 Results of ‘simanova’ for Happiness and Frequency of Attending Religious Services in Norway………..448 Table D.184 Results of ‘simanova’ for Happiness and Perceived Inequality in
Norway……….449 Table D.185 Results of ‘simanova’ for Happiness and the Highest Educational Level Attained in Norway………...450 Table D.186 Results of ‘simanova’ for Happiness and Employment Status
in Norway……….451 Table D.187 Results of ‘simanova’ for Happiness and Scales of Income
in Norway………..452 Table D.188 Results of ‘simanova’ for Happiness and Sex in Norway…………...453 Table D.189 Results of ‘simanova’ for Happiness and Age in Norway…………..453 Table D.190 Results of ‘simanova’ for Happiness and Age^2 in Norway………..454
xxx
Table D.191 Results of ‘simanova’ for Happiness and Marital Status in Norway...454 Table D.192 Results of ‘simanova’ for Happiness and Importance of Leisure Time in Spain……….455 Table D.193 Results of ‘simanova’ for Happiness and Perceived Trust in Spain...456 Table D.194 Results of ‘simanova’ for Happiness and Perceived Hard work
in Spain……….457 Table D.195 Results of ‘simanova’ for Happiness and Frequency of Attending Religious Services in Spain ……….458 Table D.196 Results of ‘simanova’ for Happiness and Perceived Inequality
in Spain………....459 Table D.197 Results of ‘simanova’ for Happiness and the Highest Educational Level Attained in Spain………..460 Table D. 198 Results of ‘simanova’ for Happiness and Employment Status
in Spain………461 Table D.199 Results of ‘simanova’ for Happiness and Scales of Income
in Spain……….462 Table D.200 Results of ‘simanova’ for Happiness and Sex in Spain…………...463 Table D.201 Results of ‘simanova’ for Happiness and Age in Spain ……….463 Table D.202 Results of ‘simanova’ for Happiness and Age^2 in Spain…………..464 Table D.203 Results of ‘simanova’ for Happiness and Marital Status in Spain…..464 Table D.204 Results of ‘simanova’ for Happiness and Importance of Leisure Time in Sweden……….465 Table D.205 Results of ‘simanova’ for Happiness and Perceived Trust
in Sweden………466 Table D.206 Results of ‘simanova’ for Happiness and Perceived Haed work in….467 Table D.207 Results of ‘simanova’ for Happiness and Frequency of Attending
Religious Services in Sweden………...468 Table D. 208 Results of ‘simanova’ for Happiness and Perceived Inequality in
Sweden………..469 Table D.209 Results of ‘simanova’ for Happiness and the Highest Educational Level Attained in Sweden………...470
xxxi
Table D.210 Results of ‘simanova’ for Happiness and Employment Status
in Sweden……….471 Table D.211 Results of ‘simanova’ for Happiness and Scales of Income
in Sweden………..472 Table D.212 Results of ‘simanova’ for Happiness and Sex in Sweden………473 Table D.213 Results of ‘simanova’ for Happiness and Age in Sweden…………...473 Table D.214 Results of ‘simanova’ for Happiness and Age^2 in Sweden………...474 Table D.215 Results of ‘simanova’ for Happiness and Marital Status in Sweden...474 Table D.216 Results of ‘simanova’ for Happiness and Importance of Leisure Time in Switzerland………...475 Table D.217 Results of ‘simanova’ for Happiness and Perceived Trust
in Switzerland………...475 Table D.218 Results of ‘simanova’ for Happiness and Perceived Hard work in Switzerland………...476 Table D.219 Results of ‘simanova’ for Happiness and Frequency of Attending
Religious Services……….477 Table D.220 Results of ‘simanova’ for Happiness and Perceived Inequality in
Switzerland………...478 Table D.221 Results of ‘simanova’ for Happiness and the Highest Educational Level Attained………479 Table D.222 Results of ‘simanova’ for Happiness and Employment Status in
Switzerland………...480 Table D.223 Results of ‘simanova’ for Happiness and Scales of Income in
Switzerland………...481 Table D.224 Results of ‘simanova’ for Happiness and Sex in Switzerland……….482 Table D.225 Results of ‘simanova’ for Happiness and Age in Switzerland………482 Table D.226 Results of ‘simanova’ for Happiness and Age^2 in Switzerland……483 Table D.227 Results of ‘simanova’ for Happiness and Marital Status
in Switzerland………...484 Table D.228 Results of ‘simanova’ for Happiness and Importance of Leisure Time in Turkey………...485 Table D.229 Results of ‘simanova’for Happiness and Perceived Trust in Turkey..485
xxxii
Table D.230 Results of ‘simanova’ for Happiness and Perceived Hard work in
Turkey………...486 Table D.231 Results of ‘simanova’ for Happiness and Frequency of Attending Religious Services in Turkey………487 Table D.232 Results of ‘simanova’ for Happiness and Perceived Inequality
in Turkey………...488 Table D.233 Results of ‘simanova’ for Happiness and the Highest Educational Level Attained in Turkey………489 Table D.234 Results of ‘simanova’ for Happiness and Employment Status in……490 Table D.235 Results of ‘simanova’ for Happiness and Scales of Income
in Turkey………...491 Table D.236 Results of ‘simanova’ for Hppiness and Sex in Turkey………..492 Table D.237 Results of ‘simanova’ for Happiness and Age in Turkey………492 Table D.238 Results of ‘simanova’ for Happiness and Age^2 in Turkey…………493 Table D.239 Results of ‘simanova’ for Happiness and Marital status in Turkey….493 Table D.240 Fstar Test for Happiness and Importance of Leisure Time in the 3rd Wave……….494 Table D.241 Fstar Test for Happiness and Perceived Trust in the 3rd Wave………494 Table D.242 Fstar Test for Happiness and Perceived Hard work in the 3rd Wave...494 Table D.243 Fstar Test for Happiness and Frequency of Attending Religious
Services in the 3rd Wave………...495 Table D.244 Fstar Test for Happiness and Perceived Inequality in the 3rd Wave…495 Table D.245 Fstar Test for Happiness and the Highest Educational Level Attained in
the 3rd Wave………..495
Table D.246 Fstar Test for Happiness and Employment Status in the 3rd Wave…..495 Table D.247 Fstar test for Happiness and Scales of Income in the 3rd Wave……...496 Table D.248 Fstar Test for Happiness and Sex in the 3rd Wave………...496 Table D.249 Fstar Test for Happiness and Age in the 3rd Wave………..496 Table D.250 Fstar Test for Happiness and Age^2 in the 3rd Wave………..496 Table D.251 Fstar Test for Happiness and Marital Status in the 3rd Wave………..496
xxxiii
Table D.252 Fstar Test for Happiness and Importance of Leisure Time in the 5th Wave……….497 Table D.253 Fstar Test for Happiness and Perceived Trust in the 5th Wave………497 Table D.254 Fstar Test for Happiness and Perceived Hard work in the 5th Wave...497 Table D.255 Fstar test for Happiness and Frequency of Attending Religious Services
in the 5th Wave………..497
Table D.256 Fstar Test for Happiness and Perceived Inequality in the 5th Wave…498 Table D.257 Fstar Test for Happiness and the Highest Educational Level Attained in
the 5th Wave………..498
Table D.258 Fstar Test for Happiness and Employment Status in the 5th Wave…..498 Table D.259 Fstar Test for Happiness and Scales of Income in the 5th Wave……..498 Table D.260 Fstar Test for Happiness and Sex in the 5th Wave………...498 Table D.261 Fstar Test for Happiness and Age in the 5th Wave………..499 Table D.262 Fstar Test for Happiness and Age^2 in the 5th Wave………..499 Table D.263 Fstar Test for Happiness and Marital Status in the 5th Wave………..499 Table D.264 Fstar Test for Happiness and Importance of Leisure Time in the East Region of Germany……….………..499 Table D.265 Fstar Test for Happiness and Perceived Trust in the East Region of Germany……….………...500 Table D.266 Fstar Test for Happiness and Perceived Hard work in the East Region of Germany……….………...500 Table D.267 Fstar Test for Happiness and Frequency of Attending Religious
Services in the East Region of Germany……….……….500 Table D.268 Fstar Test for Happiness and Perceived Inequality in the East Region of Germany……….………..500 Table D.269 Fstar Test for Happiness and the Highest Educational Level Attained in the East Region of Germany……….501 Table D.270 Fstar Test for Happiness and Employment Status in the East Region of Germany………501 Table D.271 Fstar Test for Happiness and Scales of Income in the East Region of Germany………501
xxxiv
Table D.272 Fstar Test for Happiness and Sex in the East Region of Germany…..501 Table D.273 Fstar Test for Happiness and Age in the East Region of Germany….502 Table D.274 Fstar Test for Happiness and Age^2 in the East Region of Germany.502 Table D.275 Fstar Test for Happiness and Marital Status in the East Region of
Germany………502 Table D.276 Fstar Test for Happiness and Importance of Leisure Time in the West Region of Germany………...502 Table D.277 Fstar Test for Happiness and Perceived Trust in the West Region of Germany………503 Table D.278 Fstar Test for Happiness and Perceived Hard work in the West region of Germany………503 Table D.279 Fstar Test for Happiness and Frequency of Attending Religious
Services in the West Region of Germany……….503 Table D.280 Fstar test for Happiness and Perceived Inequality in the West Region of Germany………503 Table D.281 Fstar Test for Happiness and the Highest Educational Level Attained in the West Region of Germany………504 Table D.282 Fstar Test for Happiness and Employment Status in the West Region of Germany………504 Table D.283 Fstar Test for Happiness and Scales of Income in the West region of Germany………504 Table D.284 Fstar Test for Happiness and Sex in the West region of Germany…..504 Table D.285 Fstar Test for Happiness and Age in the West Region of Germany…505 Table D.286 Fstar Test for Happiness and Age^2 in the West Region
of Germany………...505 Table D.287 Fstar Test for Happiness and Marital Status in the West Region of Germany………...505 Table D.288 Fstar test for Happiness and Importance of Leisure Time in Finland..505 Table D.289 Fstar Test for Happiness and Perceived Trust in Finland………506 Table D.290 Fstar Test for Happiness and Perceived Hard Work in Finland……..506 Table D.291 Fstar Test for Happiness and Frequency of Attending Religious
xxxv
Table D.292 Fstar Test for Happiness and Perceived Inequality in Finland………506 Table D.293 Fstar Test for Happiness and the Highest Educational Level Attained in Finland………..507 Table D.294 Fstar Test for Happiness and Employment Status in Finland………..507 Table D.295 Fstar Test for Happiness and Scales of Income in Finland…………..507 Table D.296 Fstar Test for Happiness and Age in Finland………...507 Table D.297 Fstar Test for Happiness and Age^2 in Finland………...507 Table D.298 Fstar Test for Happiness and Marital Status in Finland………...508 Table D.299 Fstar Test for Happiness and Importance of Leisure Time
in Norway………...508 Table D.300 Fstar Test for Happiness and Perceived Trust in Norway…………...508 Table D.301 Fstar Test for Happiness and Perceived Hard work in Norway……..508 Table D.302 Fstar Test for Happiness and Frequency of Attending Religious
Services in Norway………...509 Table D.303 Fstar Test for Happiness and Perceived Inequality in Norway………509 Table D.304 Fstar Test for Happiness and the Highest Educational Level Attained in Norway………..509 Table D.305 Fstar Test for Happiness and Employment Status in Norway……….509 Table D.306 Fstar Test for Happiness and Scales of Income in Norway………….510 Table D.307 Fstar Test for Happiness and Sex in Norway………...510 Table D.308 Fstar Test for Happiness and Age in Norway………..510 Table D.309 Fstar Test for Happiness and Age^2 in Norway………..510 Table D.310 Fstar Test for Happiness and Marital Status in Norway………..510 Table D.311 Fstar Test for Happiness and Importance of Leisure Time in Spain...511 Table D.312 Fstar test for Happiness and Perceived Trust in Spain………511 Table D.313 Fstar Test for Happiness and Perceived Hard work in Spain………..511 Table D.314 Fstar Test for Happiness and Frequency of Attending Religious
Services in Spain………...511 Table D.315 Fstar Test for Happiness and Perceived Inequality in Spain………...511
xxxvi
Table D.316 Fstar Test for Happiness and the Highest Educational Level Attained in Spain……….512 Table D.317 Fstar Test for Happiness and Employment Status in Spain………….512 Table D.318 Fstar Test for Happiness and Scales of Income in Spain……….512 Table D.319 Fstar Test for Happiness and Sex in Spain………..512 Table D.320 Fstar Test for Happiness and Age in Spain………..512 Table D.321 Fstar Test for Happiness and Age^2 in Spain………..513 Table D.322 Fstar Test for Happiness and Marital Status in Spain………..513 Table D.323 Fstar Test for Happiness and Importance of Leisure Time
in Sweden……….513 Table D.324 Fstar Test for Happiness and Perceived Trust in Sweden………513 Table D.325 Fstar Test for Happiness and Perceived Hard work in Sweden……...513 Table D.326 Fstar Test for Happiness and Frequency of Attending Religious
Services in Sweden………...514 Table D.327 Fstar Test for Happiness and Perceived Inequality in Sweden………514 Table D.328 Fstar Test for Happiness and the Highest Educational Level Attained in Sweden………..514 Table D.329 Fstar Test for Happiness and Employment Status in Sweden……….514 Table D.330 Fstar Test for Happiness and Scales of Income in Sweden………….515 Table D.331 Fstar Test for Happiness and Sex in Sweden………...515 Table D.332 Fstar Test for Happiness and Age in Sweden………..515 Table D.333 Fstar Test for Happiness and Age^2 in Sweden………..515 Table D.334 Fstar Test for Happiness and Marital Status in Sweden………..515 Table D.335 Fstar Test for Happiness and Importance of Leisure Time in
Switzerland………...516 Table D.336 Fstar Test for Happiness and Perceived Trust in Switzerland……….516 Table D.337 Fstar Test for Happiness and Perceived Hard work in Switzerland…516 Table D.338 Fstar Test for Happiness and Frequency of Attending Religious
xxxvii
Table D.339 Fstar Test for Happiness and Perceived Inequality in Switzerland….517 Table D.340 Fstar Test for Happiness and the Highest Educational Level Attained in Switzerland………...517 Table D.341 Fstar Test for Happiness and Employment Status in Swizerland……517 Table D.342 Fstar Test for Happiness and Scales of Income in Switzerland……...517 Table D.343 Fstar Test for Happiness and Sex in Switzerland………517 Table D.344 Fstar Test for Happiness and Age in Switzerland………518 Table D.345 Fstar Test for Happiness and Age^2 in Switzerland………518 Table D.346 Fstar Test for Happiness and Marital Status in Switzerland…………518 Table D.347 Fstar Test for Happiness and Importance of Leisure Time in Turkey.518 Table D.348 Fstar Test for Happiness and Perceived Trust in Turkey……….518 Table D.349 Fstar test for Happiness and Perceived Hard work in Turkey……….519 Table D.350 Fstar Test for Happiness and Frequency of Attending Religious
Services in Turkey………519 Table D.351 Fstar Test for Happiness and Perceived Inequality in Turkey……….519 Table D.352 Fstar Test for Happiness and the Highest Educational Level Attained in Turkey………...519 Table D.353 Fstar Test for Happiness and Employment Status in Turkey………..520 Table D.354 Fstar Test for Happiness and Scales of Income in Turkey…………..520 Table D.355 Fstar Test for Happiness and Sex in Turkey………. …….520 Table D.356 Fstar Test for Happiness and Age in Turkey………...520 Table D.357 Fstar Test for Happiness and Age^2 in Turkey………...520 Table D.358 Fstar Test for Happiness and Marital Status in Turkey………...521
xxxviii LIST of ABBREVIATIONS
OECD Organisation for Economic Co-operation and Development
HDI Human Development Index
I-HDI Inequality- Adjusted Human Development Index
WISP The Index of Social Progress
WBI Well-Being Index
SDI Social Development Index GNI Gross National Income GDP Gross Domestic Product TUIK Turkish Statistical Institute TURSTAT Turkish Statistical Institute LSS Leisure Satisfaction Scale
LTEQ Godin Leisure Time Exercise Questionnaire QHS Oxford Happiness Scale
MR hypothesis Meltzer- Richard Hypothesis POUM Prospect for Upward Mobility
ISSP International Social Survey Program
UNDP United Nations Development Program EU European Union
xxxix SHARE Survey on Health, Aging and Retirement in Europe
WVS World Values Survey
CEECs Central and Eastern European countries
Gologit Generalized Ordered Logit
PO Model Proportional Odds Model VIF Variance Inflation Factor
1
INTRODUCTION
In the economic literature, actual level of income inequality has been considered as a very important issue since 1980s because it has been thought as a negative
determinant in people’s lives in many respects, such as physically and psychologically. In 1980s, increasing inequality among household income distribution in the UK and the USA drew people’s attention to the problem of inequality (Atkinson and Piketty, 2007). European Union had also noticed the inequality issue because of existing poverty and social exclusion(Atkinson et al. , 2002). In addition to this, Amartya Sen’s article, which is named as “ On Economic Inequality ” (1973) and Anthony Atkinson’s article, which is named as “ The Economics of Inequality ” (1975) increased people’s interest to the subject of economic inequality in the past. Also, the establishment of Britain’s Royal
Commission on the Distribution of Income and Wealth provided a contribution to the issue approximately at the same time. From that time, research on the subject of inequality has been increased comprehensively. Besides income inequality,
happiness is a notion that is found in the middle of people’s lives because people care about it. However, the studies about perceived income inequality and happiness have not been proliferated yet although this concept is also important for individual
happiness in the sense that people’s perceptions to income inequality may shape their happiness level. Therefore, this study seeks to understand the impact of people’s perceptions to income inequality on their happiness levels on its own way. Regarding
2
the economic literature about perceived income inequality and happiness, this study will be divided into four chapters and there will also be subcategories of some of these chapters.
Structure of the Paper
In the first chapter, it will be mentioned about the definitions of perceived income distribution and perceived income inequality, and the notion of happiness.
Definitions of perceived income distribution and perceived income inequality will be considered in section 1.1. After the definitions, methods of measurement of
perceived income inequality and the lack of these methods, it will be informed about the concept of happiness in section 1.2. In the sub-sections of 1.2, it will be
mentioned about the definitions of happiness from past to the present, the purpose of using happiness data, methods of measurement of happiness, determinants of
happiness and determinants of happiness with regard to selected European countries, namely, Germany(The East and The West region of Germany will be examined dividedly.), Finland, Norway, Spain, Sweden, Switzerland and Turkey, and finally scope and limits of happiness literature.
The literature about perceived income distribution and perceived income inequality will be reviewed in subsection 2.1 of the second chapter. In addition, it is important to look at the literature on the relationship between social characteristics and perceived happiness in section 2.2 because they provide an information about variables, which affect individual happiness in a society differently from perceived income inequality. Finally, in section 2.3, it will be considered the literature on the relationship between perceived income inequality and happiness through the limited available studies on the subject.
3
In the third chapter, it will be explained the methodology of this study. Theoretical framework of the study will be mentioned in section 3.1. It will strenghten the structure of this study by providing an insight into the model/ theory to use in order to get an answer to underresearched subject in this study. The nature of generalized ordered logit models will be explained in the subsection 3.1.1. In this way, readers might be acquainted with the model to use for the econometric method of the study. In the section 3.2, empirical analysis will be mentioned. Before this, scope and limits of data and model will be mentioned in section 3.2.1. ‘Scope and limits’ part is important in the sense that they provide an insight about the strength and blind sides of the study and make people think about possible alternative methods. In addition, pointing out the limitations of the subject studied is very important in the sense that it provides an opportunity to comprehend the obstacles and to reach a more concrete research outcomes in the next studies. Then, in section 3.2.2, data to use will be explained. In doing so, it is aimed to familiarize the econometric data, which is used to examine the relationship between income inequality and happiness. More
specifically, dependent variable will be happiness in this study. Independent variables will be perceived income inequality, importance of leisure time, the frequency of attending to religious services, trust to the other people, perceived hardwork, and some socio-demographic variables such as sex, age, the highest educational level attained, scales of income, and marital status of people. Some of these variables will also be used to control the relationship between perceived income inequality and happiness. In this study, survey data will be used in order to mitigate the effects of lack of data in regard to happiness and the other social variables in Turkey. In section 3.2.3, expected outcomes will be mentioned. In section 3.2.4, empirical strategy of the study will be explained.
4
Then, empirical results will be explained in section 3.2.5, and in sub-section 3.2.5.1, obtained regression results by countries will be shared. In section 3.2.6, result comparisons between Turkey and the other European countries will be made. There will be a discussion part at the end of this chapter, in section 3.2.7.
Finally, the fourth chapter will be the conclusion part. Things, which were done during the study will be summarized. It will be again mentioned the importance of this study and why doing such study is important.
5
CHAPTER 1
1.1 PERCEIVED INCOME DISTRIBUTION and PERCEIVED INCOME INEQUALITY
1.1.1. How is Perceived Income Distribution Defined?
Perceived income distribution is explored to understand the effect of this concept on the reaction of people to redistributive policies(Cruces, Perez-Truglia and Tetaz, 2013). This notion is about the judgement of individuals on their own place of an income distribution scale. According to some studies, which will be mentioned in the
literature review part, this perception may be biased due to some reasons.
1.1.2 How is Perceived Income Inequality Defined?
While objective income distribution is obtained from official data, perceived income distribution is obtained from individuals’ perceptions to income distribution and from their placement on an income scale. In this sense, people have some beliefs (perceptions) about income inequality. This is known as perceived income inequality (Engelhardt and Wagener, 2014). Binelli et al. (2014) describe perceived income inequality as perceptions of people to the distribution of disposable income. The measurement of subjective approach to income inequality takes its source from the need of inquiry about people’s opinions and the attempt to derive particular ways of measuring income inequality from these opinions (Amiel, 1998).
6
1.1.3 Methods of Measurement of Perceived Income Inequality
In the literature, there are some measurement methods used in order to grasp the extent of perceived income inequality. First, it can be simply asked people to give an evaluative judgment on the subject of their perceptions about income inequality through a question of the questionnaire study. Evaluative judgment refers to evaluate the degree of fairness in the income distribution. Second, it can be asked people to locate themselves on an income distribution scale in order to learn their positions in a society. After responses are aggregated on a country level (individual level), it is calculated a mean- to- median ratio for each country (individual), and then, these perceived mean – to – median ratios are divided by the objective mean – to – median ratios. Third and finally, it can be used perceptions of income distribution in order to calculate perceived income inequality. In this method, people again locate
themselves on an income distribution scale. In this way, an average perception of income distribution is created and aggregated individual answers are placed into it. A pay- off value is assigned to each income class and then a standardized subjective Gini coefficient is measured based on it. It can also be calculated mean – to – median ratios as a measure of perceived income inequality. However, this measure may not change the relation between perceived income inequality and related variables. Based on a final approach, Schalembier uses a different method in order to calculate
perceived income inequality. He alters pay- off values in the previous approach because he seeks to reach a more realistic society (2015). Another paper makes a study about the Amiel and Cowell method for understanding perceived income inequality. The paper also mentions about the questionnaire method of Amiel and Cowell and replicates their study in order to improve its methodology. For this purpose, respondents are invited to an interview in order to gain a better insight about
7
their choices (Jancewicz, 2015). In another study, Amiel mentions about some significant methods of measuring income inequality. He distinguishes between two methods of measurement. According to him, the first method relies on individual welfare functions and the second one stresses basic axioms. Results of questions about opinions of individuals on the subject of their income level is important in the sense that they lead to an estimation of individual welfare functions through an estimated income scale, which varies from bad to excellent. This method includes questionnaires or interviews. In another method, students are used to respond the questionnaires or participate to the experiments. This method searches out people’s agreements with the basic axioms of measurement of inequality. The basic axioms of income inequality measurement can be divided into two approaches: The first one is a direct approach and the second one is an indirect approach. Direct comparisons about income inequality levels can be made through the first approach while a social welfare function or ordering can be made through the second approach in order to evaluate different income distributions (1998).
1.1.4 The Lack of Methods of Measurement of Perceived Income Inequality and Solution Offers
Because perceived income inequality is obtained from questionnaires or surveys, perceptions of respondents of questionnaires (surveys) may be biased. In addition, if questions of any survey (questionnaire) are long and difficult, there will be some misunderstandings and inconsistencies while answering the questions. It is also important to limit the number of questions in the survey (questionnaire) because they may distract respondents. It should be paid attention about asking the repetitious questions because they are often unnecessary. Therefore, the survey (questionnaire) should be well- constructed. Bar charts can be used to present money distributions. A
8
formal and abstract language may make the survey / questionnaire difficult to understand. Verbal questions can be used as a complement of the survey / questionnaire because they can shorten possible answers. It may be helpful if an option is added among the other options of the survey (questionnaire) such as “ I don’t know” or “ I don’t have an opinion”. Since the most of these solution offers are valid only in the case of making a survey (questionnaire) about perceived income inequality, the order of verbal and numeric questions are also important in the sense that it may make the comparisons about numerical and verbal questions easier. It may be helpful if verbal questions follow numerical ones, which are counterparts of verbal questions (Jancewicz, 2015). Amiel also considers about possible drawbacks such as the misunderstanding of questions, making mistakes in people’s own calculations or simply not answering the questions for some unknown reason (Amiel, 1998).
9 “Happiness is the
meaning and the purpose of life, the whole aim and end of human existence”.
Aristotle
1.2 THE NOTION of HAPPINESS
Both of the studies mentioned in the ‘Introduction’ part are very important in the sense that they provide an understanding about global income inequality, and about how inequality has changed in some significant years. In addition, income inequality in OECD (Organisation for Economic Co-Operation and Development) countries is also an important issue specifically in terms of learning the extent of inequality in these countries and of applying some policy implications about it. Besides these studies, recently, the relationship between income inequality and happiness started to gain importance. More precisely, relevant people started to search about how income inequality affects individual happiness especially in a European or American society. In addition, which other (e.g. social) variables can affect people’s happiness both in Turkey and the other countries? How can the results of analysis be compared? According to the results of research, what may the policy implications be? In what way they can be suggested? These are the important questions asked and are required concrete justification for implications of their studies. Therefore, this chapter will be about the concept of happiness and some considerations of its literature. After that, it will be mentioned some approaches/studies about the relationship between perceived income inequality/the other social indicators and happiness of societies. The presence of such studies are also important in the sense that they can fill in the spaces, which
10
come from the macroeconomic part of the literature, and can provide an awareness about solving social problems in order societies to be happier. These studies will also provide an information about the extent of effects of income inequality on happiness of people in a society or on a greater life satisfaction. Most importantly, do people’s perceptions to income inequality matter when it comes to their happiness levels, if so, in what ways? Does perceived income inequality cause to a bitter unhappiness or do the other variables such as perceived leisure, perceived trust, frequency of
attending to religious services, the highest educational level attained and some socio-demographic variables such as sex, age, marital status, employment status and perceived income (scales of income) impact on people’s happiness more? The aim of this study is to explore this subject and understand the relationship between
happiness and these variables considering differences between countries.
1.2.1 Various Definitions of Happiness
According to the World Happiness Report (2013), happiness can be defined at least in two ways. First of all, it can be defined as an emotion. ‘Emotion’ is related to being happy at a certain time, e.g. yesterday. Second, it can be defined as an evaluation. ‘Evaluation’ is related to being happy in life as a whole. To the report, people are very successful in the sense that they easily distinguish the two meanings of happiness. For instance, one of very poor people expresses that he / she is happy at a certain time, but he/she may express himself/ herself unhappy if life satisfaction as a whole come into the picture. The report’s approach will be accepted as the basic definition of happiness in this study.
In addition, Graham traces various definitions of happiness and its meaning in her book. She explains that ‘happiness’, ‘well-being’, ‘subjective well-being’ and ‘life
11
satisfaction’ can be used interchangebly in the literature. However, psychologists differentiate these terms. For instance, in order to understand happy feelings of people about their own lives as a whole, some questions can be asked. Life satisfaction is also related with happiness but happiness can be thought as a more general term compared to life satisfaction because life satisfaction has a little bit more correlation with income if it is compared to happiness. Subjective well-being is the most comprehensive term among the other terms. It includes happiness, life satisfaction etc. on the subject of health, education, work etc. On the other side, happiness has also been an important subject for philosophers for years. Notion of “objective good” is referred to happiness especially by philosophers (2011). In “Discordant Definitions”- a chapter of Sissela Bok’s book, Aristotle’s approach to happiness is mentioned. According to him, happiness is “the highest human good”. To him, pleasures become different with regard to the quality and human action cannot be explained by only pleasure (Bok, 2010). Also, Graham explains Aristotelian and Benthamite approach to happiness in her book. According to Aristotelian approach, happiness is defined as an “opportunity to lead a fulfilling life”. According to the Bentham’s approach to happiness, it is a “contentment”. In addition, she mentions about Stoics’ approach to happiness. To this approach, happiness is considered as an emotional state, which endures over people’s entire lives. Epicurus attaches great importance to the pleasures, which are perceived through the senses such as food, music, etc. because things are good thanks to these pleasures. John Rawls adopts a different happiness approach. To him, happiness is both defined as pursuing a purposeful life and fulfilling this life (2011).
Because happiness had not been measured empirically, notion of happiness remained unclear. It can be said that apparent quality of life are indicated by happiness.