Ad dress for Cor res pon den ce/Ya z›fl ma Ad re si: Assist. Prof. Dr. Yeliz Karaca, Süleyman Şah University Faculty of Management and Administrative Sciences,
Department of Economics, İstanbul, Turkey Phone: +90 532 354 87 01 E-mail: [email protected]
Linear Modeling of Multiple Sclerosis and Its Subgroubs
Multipl Skleroz ve Alt Gruplarının Doğrusal Modeli
Yeliz Karaca1, Onur Osman2, Rana Karabudak3
1Süleyman Şah University Faculty of Management and Administrative Sciences, Department of Economics, İstanbul, Turkey 2Arel University Faculty of Engineering and Architecture, Department of Electrical and Electronics Engineering, İstanbul, Turkey 3Hacettepe University Faculty of Medicine, Department of Neurology, Ankara, Turkey
Amaç: Bu çalışmada McDonald kriterlerine göre klinik kesin multipl skleroz (MS) hastası olan, 20 ile 55 yaşları arasında, tekrarlayan ve düzelen multipl skleroz
(RRMS), ikincil ilerleyen multipl skleroz (SPMS), birincil ilerleyen multipl skleroz (PPMS) 120 hasta ve kontrol grubu olarak MS olmayan 19 sağlıklı birey alındı. MS olgularının özürlülük dereceleri özürlülük durum ölçeği (EDSS) kullanılarak belirlendi. Beyin sapı, korpus kallosum-periventriküler, üst servikal bölgeler olmak üzere üç bölgedeki lezyon bilgileri alındı. EDSS değişimi ve üç bölge için okunan MR görüntülerindeki lezyon sayısı ve büyüklük bilgilerinin yıllar içerisinde değişimleri incelenerek MS tanısı ve alt gruplarının doğrusal matematik modellerle belirlenmeye çalışıldı.
Objective: In this study,120 patients diagnosed with clinical multiple sclerosis (MS) of relapsing remitting type (RRMS), secondary progressive type (SPMS) and
primary progressive type (PPMS) were examined, as well as 19 healthy subjects. All subjects were between the ages of 20 and 55. Disability levels of MS symptoms were determined using Expanded Disability Status Scale (EDSS). We focused on three regions in the brain, brain stem, periventricular corpus callosum, and upper cervical regions EDSS scores and number of lesions in these three regions are considered as the parameters of the linear mathematical model to determine the subgroups of the disease.
Materials and Methods: Initially, the distinction between healthy subjects and patients was made. Then, if the subject was determined to have MS, the
distinction of type, i.e. RRMS, SPMS/PPMS, and later, RRMS/SPMS distinction was made. In all determinations linear models were used and number of lesions in the specified three regions and EDSS scores were assumed as the parameters of the model. The coefficients of the models were obtained by least squares method.
Results: In the linear model attached to MR parameters, there was 100% success for distinction of patients and healthy subjects. Success for distinction of RRMS
and SPMS/PPMS patients and RRMS/SPMS patients was 94% and 78.94%, respectively is attained. Based on EDSS scores, linear model provides 99% success in the distinction between patients and healthy subjects. In the models created for the distinction between groups, success rate was 94% was for RRMS-SPMS/PPMS and 64% for RRMS/SPMS.
Conclusion: The correlation of MS diagnosis using various features obtained from MR images and EDSS scores with subgroups of the disease and the possibility
of developing a linear model were determined. Using the features having the highest correlation rate, various linear models were developed and high success was achieved. (Turkish Journal of Neurology 2015; 21:7-12)
Key Words: Relapsing remitting multiple sclerosis (RRMS), secondary progressive multiple sclerosis (SPMS), primary progressive multiple sclerosis (PPMS),
linear model, least squares method
Conflicts of Interest: The authors reported no conflict of interest related to this article.
Sum mary
Introduction
In recent years, studies on mathematic modeling has generated interest in various fields, including medicine, and been implemented. Researchers have been trying to find smart interfaces to utilize mathematics in understanding multiple sclerosis. These interfaces make use of Magnetic Resonance Imaging (MRI), Expanded Disability Status Scale (EDSS), and cerebrospinal fluid, with the help of which disease could be diagnosed. With features obtained from these methods and mathematical modeling, the relationship of the disease diagnosis with its types have been examined (1).
In this study, three sub-groups among clinical progress types of the disease multiple sclerosis have been examined:
1- Relapsing Remitting Multiple Sclerosis (RRMS): This group comprises of 25% of MS patients. It generally starts out as a benign type at the initial phase and full recovery follows subsequently. The full or half recovery period follows acute attacks. However, after repeating attacks several sequelae can remain. These attacks can last for days, weeks or even months. During the transitions between attacks there is no progression of the disease (2,3,4,5,6).
2- Secondary Progressive Multiple Sclerosis (SPMS): The emergence of this type is very similar to the Relapsing Remitting MS type. The early phase lasts 5 to 6 years; following the early phase, the disease goes through a secondary progressive period. While the number of attacks declines and healing is relatively slow, impairment becomes much worse (2,3,4,5,6).
3- Primary Progressive Multiple Sclerosis (PPMS): Generally, as improvement is recorded from the beginning of the disease, this is a syndrome characterized by slow or rapid progression (2,3,4,5,6).
Besides neurological examinations, MRI is performed routinely in MS. Although MRI application can show lesions in brain and spinal cord, results are not diagnostic. Especially in the early period of the disease, magnetic imaging may not reveal all lesions. Besides, other diseases may cause similar lesions in the nervous system (2,7).
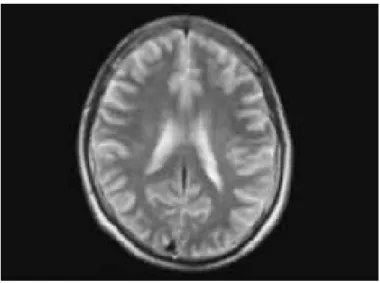
MRI is a very valuable diagnostic tool, as it displays the distribution, magnitude and number of lesions caused by MS in
the brain and spinal cord, and also documents their changes in time. The history of the disease, the results of the neurological examination and MR images are secure indicators for MS. Figure 1a shows an MRI image and Figure 1b shows the image of an MS patient. In Figure 1b lesion regions are marked (7).
MS diagnosis criteria, developed by McDonald et al. in 2001 and revised by Polman et al. in 2005, by an international panel in 2010 are still being used (8). While there is still not a complete cure for MS, treatments that control the disease course have been developed in the last 20 years and these therapies are important cornerstones in the field (1).
In MS patients, it is very important for patients and clinicians to estimate the natural course of the disease and to understand long-term results. This information should be obtained from data that reflect the whole course of the disease. In the study of Hirst C. et al., a meta-analysis showed the mortality caused by MS disease (9).
In a mathematical model, by applying the new data of lesion formation in T2 in MRI images of MS patients, from a static and dynamic perspective, two models were used to investigate the temporal change of T2 activity (11). By using the MR images the time series model with the behavior change of lesions in T2 is obtained for the long-term indications of MS (12). The MRI data of Relapsing Remitting MS were modeled with Poisson series (13). In clinical studies of MS, MRI basis results are evaluated (14). In MR images of MS patients, it is a crucial problem to detect the size of the lesions in brain (15). Subgroup analyses of RRMS and SPMS in MS were obtained (16).
There are few studies on the linear modeling and automated categorization of MS subgroups (8,16).
Materials and Methods
Multiple Sclerosis Data
In this study, monitored by Hacettepe University Faculty of Medicine, Departments of Neurology and Radiology and Primary Magnetic Resonance Imaging center, 120 patients with a definite MS diagnosis based on the McDonald criteria with RRMS, SPMS or PPMS were enrolled. All patients were between the ages of 20 and 55. In addition, 19 healthy subjects who did not have MS
Gereç ve Yöntem: Üç bölgedeki lezyon sayıları ve lezyon sayılarının maksimum, minimum, varyans, ortalama değerleri MR parametreleri olarak belirlendi. MS
hastalığı ve alt grupları ile kontrol grubunun MR parametreleri ve EDSS skoru sonuçlarını karşılaştırmak için korelasyon katsayıları hesaplandı. MR parametreleri ve EDSS skorlarına bağlı doğrusal modeller en küçük kareler yöntemi kullanılarak hatayı minimum yapacak şekilde oluşturuldu.
Bulgular: MR parametrelerine bağlı doğrusal modelde; hasta/normal ayrımı için %100’lük bir başarım elde edilmiştir. RRMS/SPMS, PPMS ayrımı için
%94, RRMS/SPMS ayrışımı için %78,94’e kadar başarım sağlanmaktadır. Hastaların PPMS olup olmadıkları ise bu değişkenlerle %95’lik bir başarım ile elde edilmiştir. EDSS skorları göz önünde bulundurularak yapılan doğrusal modelde hasta/normal ayrımında %99, RRMS/SPMS, PPMS ayrımı için yapılan modelde %94, RRMS/SPMS ayrımı %64, PPMS ayrımı ise %95 başarı ile yapılmıştır.
Sonuç: MR görüntülerinden elde edilen çeşitli özelliklerin ve EDSS skorunun MS tanısı ve alt grupları ile yüksek bir korelasyona sahip olduğu, bu nedenle
doğrusal bir modelin geliştirilebileceği belirlenmiş olup, en yüksek korelasyona sahip özellikler kullanılarak çeşitli doğrusal modeller geliştirilmiş ve yüksek başarım elde edilmiştir. (Türk Nöroloji Dergisi 2015; 21:7-12)
Anah tar Ke li me ler: Tekrarlayan ve düzelen multipl skleroz (RRMS), ikincil ilerleyen multipl skleroz (SPMS), birincil ilerleyen multipl skleroz (PPMS),
doğrusal model, en küçük kareler yöntemi
(based on MRI scans) were enrolled as control subjects. Level of disability in MS patients were determined by using the Extended Disability Status Scale (EDSS). Magnetic resonance images are obtained with a 1.5 Tesla device (Magnetom, Siemens Medical Systems, Erlangen, Germany). The lesions on T2-weighted turbo spin-echo (TSE) sequences were counted in metric units. The brainstem, corpus callosum-periventricular region, including the upper cervical lesions in the three regions were included in the information. Magnetic resonance read for three regions lesion in the years to the information changes (number of increments/ reductions in size) were compared based on the EDSS scores of years, changes within the clinical diagnostics compared with MS. While observing the duration of the disease, there were minimum three years between the first and second MRI scans and there were maximum 8 or 10 years between the second and third and MRI scans (1).
Feature Extraction
In this study, we used the number of lesions according to the locations of the brain and EDSS score for modeling. First, second, and third regions were designated as brain stem, periventricular corpus callosum, and upper cervical regions, respectively. First and third MRI scans were considered for each patient.
Number of Lesions
For the first and the third MRI scans, the numbers of lesions in three regions were designated as features. The labels of these features are given below;
Num 11: Number of lesions in the first MRI scan in the first
region.
Num 12: Number of lesions in the first MRI scan in the
second region.
Num 13: Number of lesions in the first MRI scan in the third
region.
Num 31: Number of lesions in the third MRI scan in the first
region.
Num 32: Number of lesions in the third MRI scan in the
second region.
Num 33: Number of lesions in the third MRI scan in the third
region.
Expanded Disability Status Scale
EDSS is partly based on the measurements of eight regions known as a functional system in the central nervous system. First, the scale measures the temporary numbness in the face or fingers or degrees of impairment such as visual impairment. And then, by using walking distance, it measures the disability in terms of mobility (10).
These systems are rated according to the degree of the impairment. These degrees can be 0 for normal condition and may rise up to 5 or 6 for conditions where the impairment is highest. By adding the movement and daily life limitations to these functional system degrees, we defined the 20 steps of EDSS (10).
The EDSS quantifies disability in eight Functional Systems (FS) and allows neurologists to assign a Functional System Score (FSS) in each of these in Table 1 (17).
Linear Model
In Figure 2 general block diagram of the model is given. To make a decision, we used linear models for each bifurcation. In the first node, Healthy/Patient distinction was made. If the subject was determined to be a patient, then, for the classification of the
disease, RRMS-SPMS/PPMS distinction was made. As a last step, if the subject was determined to be in RRMS or SPMS subgroups, RRMS/SPMS distinction was made. Finally, RRMS, SPMS, and PPMS subgroups were determined using three bifurcations.
For example, there may be two physical entities x and y with a linear connection (18,19). If we want to write y as a function of x, since the connection between x and y is linear, we can express it as the equation (2.1), y=a+bx (2.1).
In the equation, y is a dependent variable, x is an independent variable, a and b are the constant coefficients.
What we look for in this equation are the most accurate values possible for a and b. If we mark points that correspond with these pairs in a 2-dimensional plane, we obtain clouds of points that spread roughly on a straight line. For various reasons, (measurement mistakes, exceptional cases, exterior factors that are not included in the model, etc.) points will not appear on a perfectly straight
Figure 1b. Magnetic resonance imaging (MRI) image of lesion regions with multiple sclerosis (MS)
Figure 1a. Magnetic resonance imaging (MRI) image of a healthy subject
line (18). If we want to state the connection between x and y as a single linear equation, we have to find a line that will pass as close as possible. In other words, in the equation above, we should
select a and b so that the line that will be as close to data points as possible (18). This is a typical regression problem and in this case, it was solved by using least-squares method.
Results
In MRI 1, (120 patients and 19 healthy) 139 people with known data, in MRI 2, (68 patients and 19 healthy) 87 people with known data and in MRI 3, (38 patients and 19 healthy) 57 people with known data are used in analyses for variables of MRI.
Linear models are obtained according to the number of lesions. First and third MRI scans are considered. In Table 2, Healthy/ Patient distinction results are given. Approximately 100% of accuracy is obtained. In Table 3, the results of RRMS-SPMS/PPMS distinction are given. Approximately 94% and 82% of accuracy is obtained for the first and third MRI scans respectively. In Table 4, the results of RRMS/SPMS distinction are given. Approximately 65% and 74% of accuracy is obtained for the first and third MRI scans respectively.
In Table 5-7 linear models are obtained according to the EDSS score in the given MRI scans. In Table 5, Healthy/Patient distinction results are given. Approximately 99% of accuracy is obtained. In Table 6, the results of RRMS-SPMS/PPMS distinction are given. Approximately 94% and 89% of accuracy
Table 1. Appendix A. description of Expanded Disability Status Scale (EDSS) scores Score Description
1.0 No disability, minimal signs in one FS
1.5 No disability, minimal signs in more than one FS 2.0 Minimal disability in one FS
2.5 Mild disability in one FS or minimal disability in two FS
3.0 Moderate disability in one FS, or mild disability in three or four FS. No impairment to walking
3.5 Moderate disability in one FS and more than minimal disability in several others. No impairment to walking
4.0 Significant disability but self-sufficient and up and about some 12 hours a day. Able to walk without aid or rest for 500 m 4.5 Significant disability but up and about much of the day, able to work a full day, may otherwise have some limitation of full
activity or require minimal assistance. Able to walk without aid or rest for 300 m
5.0 Disability severe enough to impair full daily activities and ability to work a full day without special provisions. Able to walk without aid or rest for 200 m
5.5 Disability severe enough to preclude full daily activities. Able to walk without aid or rest for 100 m 6.0 Requires a walking aid - cane, crutch, etc - to walk about 100 m with or without resting
6.5 Requires two walking aids-pair of canes, crutches, etc-to walk about 20 m without resting
7.0 Unable to walk beyond approximately 5 m even with aid. Essentially restricted to wheelchair; though wheels self in standard wheelchair and transfers alone. Up and about in wheelchair some 12 hours a day
7.5 Unable to take more than a few steps. Restricted to wheelchair and may need aid in transferring. Can wheel self but cannot carry on in standard wheelchair for a full day and may require a motorized wheelchair
8.0 Essentially restricted to bed or chair or pushed in wheelchair. May be out of bed itself much of the day. Retains many self-care functions. Generally has effective use of arms
8.5 Essentially restricted to bed much of day. Has some effective use of arms retains some self-care functions 9.0 Confined to bed. Can still communicate and eat.
9.5 Confined to bed and totally dependent. Unable to communicate effectively or eat/swallow 10.0 Death due to MS (17).
FS: Functional systems, MS: Multiple sclerosis
Figure 2. Healthy, patient, relapsing remitting type (RRMS), secondary progressive type (SPMS) and primary progressive type (PPMS) distinction
is obtained for the first and third MRI scans respectively. In Table 7, the results of RRMS/SPMS distinction are given. Approximately 62% of accuracy is obtained for the first and third MRI scans.
The accuracy of the linear models with respect to the number of lesions and EDSS scores is very close to each other. Healthy/
Patient distinction can be determined with high success using number of lesions in three regions and EDSS score. There is a quite sufficient distinction between RRMS-SPMS and PPMS. However, success ratio of RRMS/SPMS distinction is lower than the others since the clinical finding of RRMS and SPMS is close to each other and not easily distinguishable.
Table 7. Results of relapsing remitting type (RRMS)/secondary progressive type (SPMS) distinction according to the expanded disability status scale EDSS score
MRI scan no Feature No of subjects Accuracy
1st MRI EDSS 120 61.67%
3rd MRI EDSS 38 61.58%
EDSS: Expanded disability status scale, MRI: Magnetic resonance imaging
Table 2. Results of healthy/patient discrimination according to the number of lesions
MRI scan no Features No of subjects Accuracy
1st MRI Num11, Num12, Num13 139 99.28%.
3rd MRI Num31, Num32, Num33 54 100%
MRI: Magnetic resonance imaging
Table 3. Results of relapsing remitting type (RRMS)-secondary progressive type (SPMS)/ primary progressive type (PPMS) distinction according to the number of lesions
MRI scan no Features No of subjects Accuracy
1st MRI Num11, Num12, Num13 120 94.17%
3rd MRI Num31, Num32, Num33 38 81.58%
MRI: Magnetic resonance imaging
Table 4. Results of relapsing remitting type (RRMS)/ secondary progressive type (SPMS) distinction according to the number of lesions
MRI scan no Features No of subjects Accuracy
1st MRI Num11, Num12, Num13 120 65%
3rd MRI Num31, Num32, Num33 38 73.68%
MRI: Magnetic resonance imaging
Table 5. Results of Healthy/Patient distinction according to the expanded disability status scale (EDSS) score
MRI scan no Feature No of subjects Accuracy
1st MRI EDSS 139 99.28%
3rd MRI EDSS 57 98.25%
MRI: Magnetic resonance imaging, EDSS: Expanded disability status scale
Table 6. Results of relapsing remitting type (RRMS)-secondary progressive type (SPMS)/ primary progressive type (PPMS) distinction according to the expanded disability status scale (EDSS) score
MRI scan no Feature No of subjects Accuracy
1st MRI EDSS 120 94.17%
3rd MRI EDSS 38 89.47%
Conclusion
In this study, 3 different MRI scans acquired at different time points that belong to, 120 RRMS, SPMS and PPMS patients and 19 healthy subjects (a control group) between the ages of 20 and 55 were used. Based on the MRI scans, numbers of lesions in brain stem, periventricular corpus callosum, upper cervical regions and EDSS scores were considered as the features of the model. In most of the studies, it is not possible to find the same number of patients in each subgroup. This naturally leads to a deviation in the output of the classifier and thus biases may occur. In this case, the performance of the classifier has been determined based on the number of groups.
Selecting coefficients among the coefficients we received for this study has triggered the need to obtain new coefficients. We have used the linear model to calculate the bias. One and 0 have been assigned to two groups. We have applied the linear model accordingly, and set the threshold as 0.5. The values higher than the threshold are marked as 1 while the ones smaller than the threshold were assigned to the other group (zero). The threshold value has been determined in a way to minimize the error.
According to number of lesions, in a linear model that was designed to make the distinction between healthy subjects and patient group, 100% accuracy was obtained. In the linear model that was designed according to number of lesions, up to 94.17% accuracy was obtained in the classification between patients. In the distinction between RRMS/SPMS, up to 73.68% accuracy in the linear model was attained by using the same variables. In the linear model that was designed by taking EDSS scores into consideration, in the classification of healthy and normal people, 99.28% accuracy was attained. In the linear model for the RRMS-SPMS/PPMS classification 94.17% accuracy, for the classification of RRMS/ SPMS 61.67% accuracy was attained. According to these results, with the help of linear models that are designed using EDSS scores of patients and various statistical features of lesions in brain stem, periventricular corpus callosum, upper cervical regions, highly successful results can be obtained for the identification of MS and its subgroups and these results correspond with clinical findings.
The findings obtained from the study, data such as lesion diameter, number etc. obtained from the MR images of the patients, EDSS and doctors’ guidance were used as well. By obtaining different characteristics of MRI images in the further studies we will be conducting and making endeavors to find subgroups with a higher level of sensitivity through the development of non-linear and linear models.
Acknowledgements
The authors are deeply grateful to Hacettepe University Medical Faculty, Neurology and Radiology Department in Primer Magnetic Resonance Imaging Center, and to radiologists Eray Atlı
MD. and Mehmet Yorubulut MD., for their cooperation in both the the domain knowledge and in the manual segmentation of the input dataset. Also, Yeliz Karaca MD. expresses gratitude to the Turkish Neurological Association for all their support.
References
1. Karaca Y. Multiple Skleroz hastalığının ve alt gruplarının belirlenmesi için optimum bir matematiksel modelin oluşturulması (Doktora Tezi). İstanbul: Marmara Üniversitesi, 2012.
2. Karabudak R, Işık N, Siva A. Multiple Sklerozda Tanı ve Tedavi Kılavuzu. Ankara: Bilimsel Tıp yayınevi, 20095-20.
3. Kaymakamzade B. Progresif Başlangıçlı Multiple Skleroz Hastalarında Aksonal Hasar Belirteçlerinin Klinik ve Beyin Omurilik Sıvısı Özellikleri Temelinde Değerlendirilmesi, (Uzmanlık Tezi). Ankara: Hacettepe Üniversitesi Tıp Fakültesi Nöroloji Anabilim Dalı, 2011.
4. Gilroy J. Basic Neurology. 3rd ed. The McGraw-Hill Companies, 2000:225-278.
5. Karabudak R. MS ile yaşamak. Ankara: Aşina Kitaplar, 2006: 11-34. 6. Karabudak R, Aksel S, Altınbaş A, Kuşçu DY. Olgularla Multiple Skleroz.
Ankara: Bilimsel Tıp Yayınevi, 2011:29-36, 241-243.
7. MS-GATEWAY. 20.05.2011. Available from: http://www.ms-gateway.gen.tr/ msi-anlamak/ms-tanx131sx131/mr-ve-ms-77.htm
8. Compston A, McDonald IR, Noseworthy J, Lassmann H, Miller DH, Smith KJ, Wekerle H, Confavreux C. McAlpine’s Multiple Sclerosis. 4th ed. Churchill Livingstone Elsevier, 2005:.3-5.
9. Hirst C, Ingram G, Swingler R, Compston DAS, Pickersgill T, Robertson NP. Change in disability in patients with multiple sclerosis: a 20-year prospective population-based analysis. J Neurol Neurosurg Psychiatry, 2008;79:1137-1143.
10. Helgason CM, Malik DS, Cheng SC, Jobe TH, Mordeson JN. Statistical versus Fuzzy Measures of Variable Interaction in Patients with Stroke. Neuroepidemiology 2001;20:77-84.
11. Rovaris M, Rocca MA, Barkhof F, Calebrese M, Stefano ND, Khalil M, Fazekas F, Fisniku L, Gallo P, Miller DM, Moltalban X, Polam C, Rovira A, Sombekke MH, Sormani MP, Stromillo ML, Filippi M. Relationship between brain MRI lesion load and short-term disease evolution in non-disabling MS: a large-scale, multicentre study. Mult Scler 2010;17:319-326.
12. Mejer DS, Guttamann CR. MRI time series modelling of MS lesion development. NLM Gatew 2006;32:531-537.
13. Mackay RJ. Estimating the order of a hidden markov model. Can J Stat 2002;30:573-589.
14. Albert PS, McFarland HF, Smith ME, Frank JA. Time series for modelling counts from a relapsing-remitting disease: Application to modelling disease activity in multiple sclerosis. Stat Med 1994;13:453-466.
15. Pelletier D, Garriso K, Henry R. Measurement of Whole-Brain Atrophy in Multiple Sclerosis. J Neuroimaging 2004;14:11-19.
16. Sajja BR, Datta S, He R, Mehta M, Gupta RK, Wolinsky JS, Narayana PA. Unified Approach for Multiple Sclerosis Lesion Segmentation on Brain MRI. Ann Biomed Eng 2006;34:142-151.
17. Gaspari M. Roveda G. Scandellari C. Stecchi S. An expert system for the evaluation of EDSS in multiple sclerosis. Artif Intell Med 2002;25:187-210. 18. Sümbüloğlu K, Sümbüloğlu V. Biyoistatistik. 14. Baskı. Ankara: Hatiboğlu
yayınevi, 2010:186-201.
19. Kocaçalışkan İ, Bingöl NA. Biyoistatistik. 2. Baskı. Ankara: Nobel yayınevi, 2010:77:149.