ARTIFICIAL NOSE: IDENTIFICATION OF
VOLATILE ORGANIC MOLECULES WITH
OPTOFLUIDIC PHOTONIC BRAGG FIBERS
a thesis submitted to
the graduate school of engineering and science
of bilkent university
in partial fulfillment of the requirements for
the degree of
master of science
in
materials science and nanotechnology
By
Abubakar Isa Adamu
December, 2016
ABSTRACT
ARTIFICIAL NOSE: IDENTIFICATION OF VOLATILE
ORGANIC MOLECULES WITH OPTOFLUIDIC
PHOTONIC BRAGG FIBERS
Abubakar Isa Adamu
M.S. in Materials Science and Nanotechnology Advisor: Aykutlu Dana
December, 2016
Artificial nose system, comprising of a bundle of photonic Bragg fibers used for identification of industrial toxic gases is reported. The system, otherwise known as optoelectronic nose, harvests the unique infrared spectrum of volatile organic compounds (VOCs), in conjunction to a fabricated multilayered photonic Bragg fibers that filters the incident spectrum of the infrared to a narrow transmission band. The sensing mechanism of the device comprises the measurement of in-frared absorption of volatile analytes inside the hollow cores of optofluidic Bragg fibers. An array of six fibers is used, where each fiber target a different region of the midinfrared in the range of 2-14 µm with transmission bandwidths of about 1-3 µm. The quenching in the transmission of each fiber due to the presence of analyte molecules in the hollow core is measured separately and the cross response of the array allows the identification of virtually any (VOC). The device was used for the identification of seven industrial VOC vapors with high selectivity using a standard blackbody source and an infrared detector. The array response is regis-tered as a unique six digit binary code for each analyte by assigning a threshold value to the fiber transmissions. The developed prototype is a comprehensive and versatile artificial nose that is applicable to a wide range of analytes.
Keywords: Electronic noses, Photonic band gap fibers, Optofluidics, Volatile Or-ganic Compound, Sensor arrays.
¨
OZET
YAPAY BURUN: OPTOFLUIDIC FOTON˙IK BRAGG
F˙IBERLER˙I ˙ILE UC
¸ UCU ORGAN˙IK B˙ILES
¸ ˙IKLERN
TES
¸H˙IS˙I
Abubakar Isa Adamu
Malzeme Birim ve Nanoteknoloji, Y¨uksek Lisans Tez Danı¸smanı: Aykutlu Dana
Aralık 2016
Endustriyel zehirli gazların tespiti i¸cini fotonik Bragg lif demeti i¸ceren yapay burun sistemi bildirildi. Optofluidic burun olarak da bilinen system; gonder-ilen kızılotesi spektrumunu dar bir iletim bandına filtreleyen, birden fazla kat-man i¸ceren fotonik Bragg lifleri ile u¸cucu organik bile¸siklerin (VOC) kendine ozgu kızılotesi spektrumunu so˘gurup kullanmaktadır . Cihazın tespit mekaniz-ması, fotonik Bragg liflerinin i¸ci bo¸s ¸cekirdeklerinde bulunan u¸cucu analitlerin kızılotesi emilim ol¸cumunu i¸cermektedir. Her biri, 2 - 14µm aralı˘gında olan orta kızılotesi aralı˘gında farklı bolgeleri hedef alan ve 1 - 3 µm civarında iletim bandına sahip fiberlerden, altı fiber i¸ceren bir duzen kullanılmı¸stır. Analit molekullerin varlı˘gından dolayı, her fiberin iletiminde ya¸sanan donma ayrı ayrı ol¸culmu¸s; duzende meydana gelen tum tepkiler kar¸sıla¸stırılarak gorunurdeki tum kimyasal-ların tespiti sa˘glanmı¸stır. Cihaz, standart bir kara cisim kayna˘gı ve kızılotesi detektoru kullanılarak, yedi farklı endustriyel VOC buharının tanımlanmasında kullanılmı¸stır. Duzenin tepkileri , fiber iletimlerine bir alt limit atanarak, altı hane i¸ceren ozgun bir ikili kod ile kaydedilmi¸stir. Geli¸stirilmi¸s prototip, kapsamlı ve ¸cok yonlu bir yapay burun olup; medikal te¸shislerde kullanılabilme potan-siyeline sahip oldu˘gu gibi, gunluk aktivitelerde ve geni¸s bir yelpazede kullanıma uygundur.
Anahtar s¨ozc¨ukler : Elektronik burunlar, Fotonik bant aralıklı lifler, Optofluidics, Sensor Dizisi.
Acknowledgement
Firstly I would like to thank my parents for supporting me in my academic carrier both morally and financially. I will not have been where I am without the help of my entire family. I will like to thank and appreciate Prof. Mehmet Bayindir, my co-advisor and supervisor during the work of this thesis, and As-sot. Prof. Aykutlu Dana, for his guidiance, support and ultimately being my dissertation Supervisor. They have both provided me a broad view of the scien-tific community and kept me on my toes all the time, quite literally because my worktable was high and I have to step on my toes sometimes. I cannot that them enough.
I have enjoyed working and exchanging ideas with the many interesting and talented colleagues at National Nanotechnology Research Center-UNAM, the instructors have been of immense help to me, in understanding the world of Nanoscience and Nanotechnology. And my colleagues in the Bayindir research group became almost like family, I sometimes forget my home is thousand miles away in another continent. Specifically, I would like to thank Zainab Saad Yusuf, Oyewole Efunbajo and John Omole Kayode for being there all the time, their support means a lot to me. Previous Members of Bayindir Group: Orhan Genc, Abba Saleh, Urandelger Tuvshindorj, Umar Gishiwa, Tamer Do˘gan, Late Bihter Da˘glar (RIP, always be in our hearts), Pinar Beyazkilic, Ersin Ero˘glu, Mehmet Kanik, Murat Dere, Ne¸se ozgur, Ozan Akta¸s, Girayhan Say, Dilara Oksuz, Tural Khudiyev, Bekir Turedi, Osama Tobail, Mostafa M. El-Ashry, Ali Ya¸sar, Pelin Toren and Gokcen Birlik Demirel are all acknowledged for their help.
This work was supported by Tubitak : (113T069) and European Research Council
Contents
1 Artificial Nose 15
1.1 Introduction . . . 15
1.2 Olfaction of Volatile Organic Compounds . . . 17
1.2.1 Photonic Nose . . . 18
1.2.2 MOSFET and MOS Transducers . . . 19
1.2.3 Colorimetric Sensors . . . 20
1.2.4 Virus and Bacteriophage-based gas Sensors . . . 21
1.2.5 Colloidal Quantum Dots Gas sensing . . . 22
2 Optofluidic Nose 23 2.1 Introduction . . . 23
2.2 Hollow Core Array of Photonic Bragg Fibers . . . 25
2.3 Binary Code Identification of Chemicals . . . 27
CONTENTS vi
3.1 Introduction . . . 28
3.2 Multilayered Hollow core Bragg Fiber . . . 29
3.3 Selection of Materials . . . 30
3.4 Polymer/Chalcogenide Bragg Fibers . . . 30
3.4.1 Properties of Polymer and Chalcogenide . . . 31
3.4.2 Measurement and Preparation of Polymer Film Films . . . 32
3.4.3 Surface activation and treatment of Polymer surfaces . . . 32
3.4.4 Preparation of As2Se3/PES Preform . . . 33
3.4.5 Preform Preparation . . . 34
3.4.6 Fiber Drawing . . . 37
4 Binary Coded Identification of Industrial Chemical Vapors 39 4.1 Optofluidic Nose Setup . . . 39
4.2 Measurements and Data Analysis . . . 43
4.3 Chemicals . . . 44
4.4 Fiber Array Responses to Chemical vapors . . . 44
4.5 Recognition and classification of Industrial Toxic gases . . . 50
5 Summary and Future Outlook 61 5.1 Conclusion . . . 61
CONTENTS vii
5.2 Prospect of Application in Breath analysis . . . 63
A Data 78
List of Figures
1.1 Architecture of the developed wireless e-nose network. culled from Ref 27 . . . 18
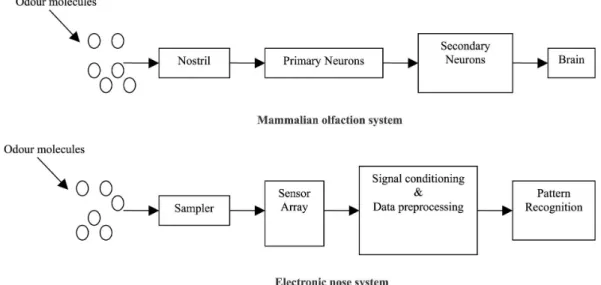
1.2 A schematic of e-noses mimicking the mammalian nose. Image from Ref. 28 . . . 19
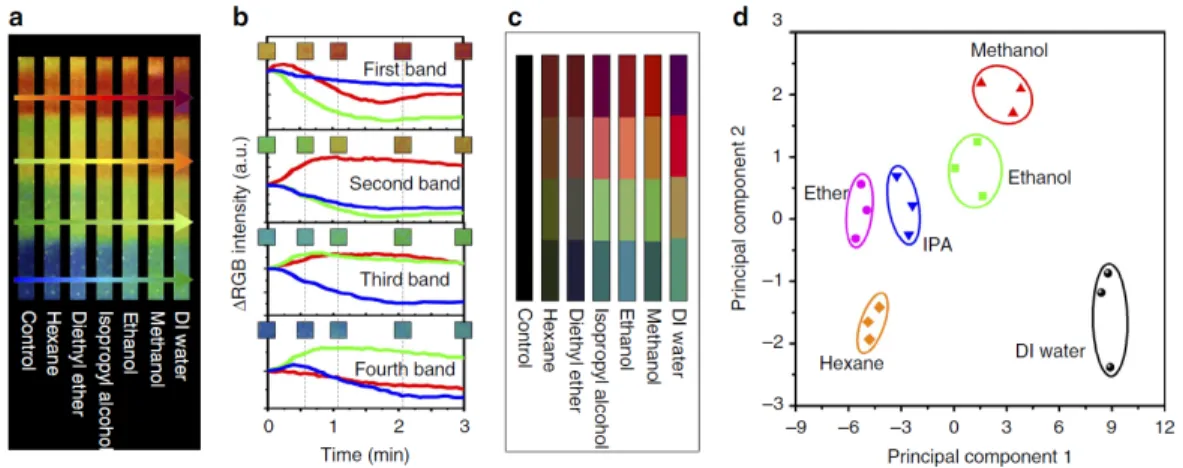
1.3 Phage litmus sensing of gas phase VOCs. (a) Photographs of the Phage litmus after exposure to hexane, diethyl ether, isopropyl al-cohol, ethanol, methanol and DI water, respectively. (b) Real-time RGB colour change profile of a Phage litmus after exposure to DI water. Each plot represents the RGB colour intensity change from each matrix of a Phage litmus. (c) VOC colour fingerprints used to selectively distinguish various chemicals. (d) Principal component analysis plot of the colour changes resulting from the exposure of the Phage litmus to different VOCs. Image from Ref. 32 . . . 21
2.1 Phage litmus sensing of gas phase VOCs. (a) A bundle of fibers with different target wavelengths, each representing a binary logic after the passsage of anaytes and IR light coupled into the fiber. (b) Crossection of the fiber showing multilayered reflective mirrors inside the fiber. Chalcogenide and Polymer alternating layers (c) Light bounces inside the fiber with an inner diameter of about 100-500 microns. . . 27
LIST OF FIGURES ix
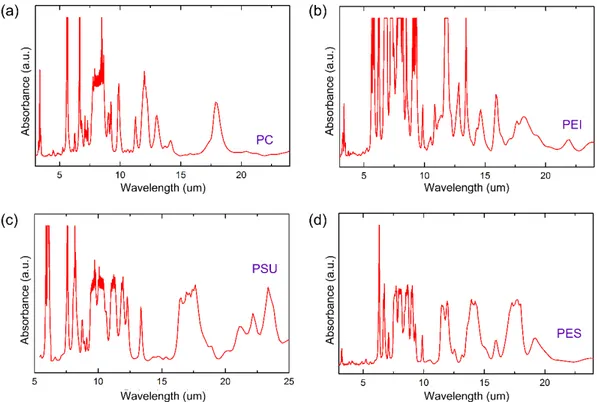
3.1 Infrared absorption spectra of the candidate polymer materials for fiber fabrication. (a) Polycarbon (PC), (b) polyetherimide (PEI), (c) polysulphone (PSU), (d) polyethershulphone (PES). . . 31
3.2 (a) Shows the SEM image if polymer film after 180W treatment for 12 minutes. (b) Shows the surface of PES polymer before treatment 33
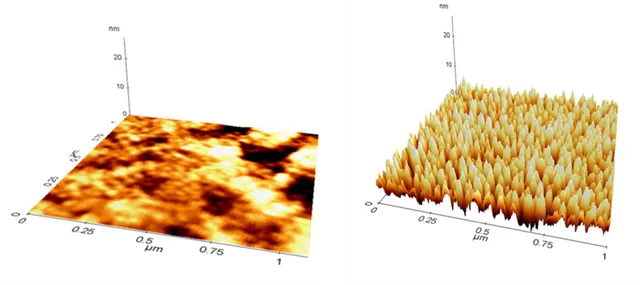
3.3 Atomic Force Microscope image of PES polymer before and after plasma treatment for 25 minutes . . . 33
3.4 (a) The coated film is first rolled around the glass rod. (b) The coated polymer film is then followed by a uncoated layers polymer film to provide mechanical support for the multilayer (c) Teflon tape used to cover the preform before consolidation. (d) A preform sample, after consolidation before etching of core glass . . . 35
3.5 Fiber tower used for drawing fibers at low temperature below 800 degrees Celsius . . . 36
3.6 A contact-angle device (DataPhysics OCA)used in measuring the wettability of polymer surfaces before thermal evaporation. . . 38
3.7 (a) Scanning Electron Microscopy (SEM) Cross section of hollow core Bragg fiber. (b,c) PES/Chalcogenide multilayer (d) Image of Fabricated fibers . . . 38
4.1 (a), (b) The optofluidic nose measurement setup. OAPM: Off Axis parabolic gold mirror, SS: Shutter stage, FH: Fiber holder, ZnSe: Zinc Selenide infrared lens, MCT: Mercury Cadmium Telluride infrared detector, MFC: Mass flow controller. FH1 is used to hold the tips of the fibers at equal intervals. Industrial chemical vapors are introduced to the fiber array through FH2, which is sealed against leaks and that allows the coupling of the infrared light to the MCT detector. . . 41
LIST OF FIGURES x
4.2 (a) Enclosed compartment where bubbler flask are filled with liquid toxic chemicals (b) Pair of bubbler tubes used for injecting gas to purge our the vapour pressure. (c) A Thermobath filled with blubbers tubes of toxic chemicals to maintain a steady temperature during measurements . . . 45
4.3 The response of Fiber 2 to industrial chemical vapors. (a) There is no significant overlap of the transmission band of Fiber 2 and the absorption bands of Toluene vapor, resulting in only a slight quenching (4 percent) in transmission with the presence of Toluene molecules in the fiber core. (b) The transmission of the Fiber 2 is quenched 45 percent from the initial value in Ethyl acetate mea-surement due to the absorption bands at 9 and 11 m. (c) The response of Fiber 2 to the 7 different common industrial chemi-cal vapors. (d) Binary coded representation of Fiber 2 response. Blue scale representation of the Fiber 2 response to the chemicals. The determined threshold value of 35 percent tags Acetic acid and Ethyl acetate with a 1 whereas the remaining chemical vapors are tagged with a 0. (Aa: Acetic acid, Ea: Ethyl acetate, He: Hexane, Fo: Formaldehyde, Ac: Acetone, Be: Benzene, To: Toluene). . . 46
4.4 Wavelength scalable hollow core Bragg fibers with photonic bandgaps at different parts of the midinfrared wavelengths. (a) Thermal fiber drawing allows scaling down the diameter, and the quarter wave stack period of the dielectric mirrors (poly-mer/chalcogenide multilayers) along with it simultaneously. This allows tuning the bandgap of the fiber during drawing. (b) The array of Bragg fibers used in this study. (c) The SEM image of Fiber 1, showing the multilayer stack (dielectric mirror), and hol-low core where volatile chemical molecules are introduced and the infrared light is coupled to the fiber simultaneously to measure the change in transmission with the presence of the analyte. (d) The transmission spectra of the six fabricated fibers which covers the fingerprint region. . . 53
LIST OF FIGURES xi
4.5 The response of Fiber 1 to the 7 different common industrial chem-ical vapors. With Binary coded representation of Fiber 1 response. Blue scale representation of the Fiber 1 response to the chemicals. The determined threshold value of 10 percent was tagged. (Aa: Acetic acid, Ea: Ethyl acetate, He: Hexane, Fo: Formaldehyde, Ac: Acetone, Be: Benzene, To: Toluene). . . 54
4.6 The response of Fiber 2 to the 7 different common industrial chem-ical vapors. With Binary coded representation of Fiber 2 response. Blue scale representation of the Fiber 2 response to the chemicals. The determined threshold value of 35 percent tags Acetic acid and Ethyl acetate with a 1 whereas the remaining chemical vapors are tagged with a 0. (Aa: Acetic acid, Ea: Ethyl acetate, He: Hexane, Fo: Formaldehyde, Ac: Acetone, Be: Benzene, To: Toluene). . . . 54
4.7 The response of Fiber 3 to the 7 different common industrial chem-ical vapors. With Binary coded representation of Fiber 3 response. Blue scale representation of the Fiber 3 response to the chemicals. The determined threshold value of 30 percent was tagged. (Aa: Acetic acid, Ea: Ethyl acetate, He: Hexane, Fo: Formaldehyde, Ac: Acetone, Be: Benzene, To: Toluene) . . . 55
4.8 The response of Fiber 4 to the 7 different common industrial chem-ical vapors. With Binary coded representation of Fiber 4 response. Blue scale representation of the Fiber 4 response to the chemicals. The determined threshold value of 7 percent was tagged. (Aa: Acetic acid, Ea: Ethyl acetate, He: Hexane, Fo: Formaldehyde, Ac: Acetone, Be: Benzene, To: Toluene) . . . 55
LIST OF FIGURES xii
4.9 The response of Fiber 5 to the 7 different common industrial chem-ical vapors. With Binary coded representation of Fiber 5 response. Blue scale representation of the Fiber 5 response to the chemicals. The determined threshold value of 20 percent was tagged. (Aa: Acetic acid, Ea: Ethyl acetate, He: Hexane, Fo: Formaldehyde, Ac: Acetone, Be: Benzene, To: Toluene) . . . 56
4.10 The response of Fiber 6 to the 7 different common industrial chem-ical vapors. With Binary coded representation of Fiber 6 response. Blue scale representation of the Fiber 6 response to the chemicals. The determined threshold value of 5 percent was tagged. (Aa: Acetic acid, Ea: Ethyl acetate, He: Hexane, Fo: Formaldehyde, Ac: Acetone, Be: Benzene, To: Toluene) . . . 56
4.11 Binary coded identification of the industrial chemical vapors with the fiber array. (a) Color code representation of the six-fiber array response. Even chemically similar species such as benzene and toluene are recognized with a unique set of fiber responses. The determined threshold values for each of the fibers are shown in color code. (b) The binary coded array response with the determined threshold values is shown for each of the seven chemicals. Each chemical is identified with a unique six-digit code . . . 59
4.12 Response of Fiber 2 as a function of temperature when Acetone is introduced. As temperature reduces, the vapor pressure also reduces. Thus reducing the molecule ppt level as seen from fiber response . . . 60
List of Tables
4.1 The measurement data taken with the optofluidic nose. The aver-ages and standard deviations of the three measurements taken for each fiber-chemical combination, the digital codes of the chemicals and the thresholds for each fiber are listed . . . 44
Chapter 1
Artificial Nose
1.1
Introduction
The Nose being an organ for smelling has been under investigations since the stone ages, with many attempts to understand the working principle of the unique organ. The field even more focus lately with attempts to mimic the human nose and apply it to many day to day activities. In order to successfully replicate the nose, it is vital to understand how the nose functions. The mammalian nose for example has the ability to distinctly smell a single analyte from a mixture of several gases, these gases are composed of molecules, each of which has a different shapes and sizes [1, 2] consequently, these molecules have a corresponding sized and shaped receptor in human nose. Thus, a specific olfactory receptor receives a certain molecule, it then sends a signal to the brain and the brain interprets the smell associated with that particular molecule and simulates the necessary action such as tears, sneeze or other reflex actions [3–5]. Electronic noses take motivation from these biological models and mimic its operations with corresponding sensors as receptors which then transmits the signal for processing. Electronic noses are examples of a growing research in fields of biomimetics, or biomimicry.
identity information is thought to be contained in the temporal patterns of spike activities distributed across many second-order neurons, but the detail of how these patterns are being precessed and interpreted is yet to be known [6–9]. Re-gardless of the insufficient information regarding the neural network, the general idea of olfactory mechanism has greatly inspired artificial noses. Artificial noses that are primarily used for chemosensing applications instead of an explicit test olfactory hypothesis.
Chemical sensors are generally deployed in identification and analysis of Volatile Organic Compounds (VOC), with varying methods for pattern recog-nition, and different operational principles. A lot of these gas sensors are de-ployed in arrays, such as: conducting polymers [10–12], amperometric gas sen-sors [13–15], metal oxide semiconductors (MOS) [16,17], piezoelectric [18], optical fluorescence [19] to name a few.
Although, instrumental methods of determining volatile gases such as gas chro-matography or mass spectrometry (GC/MS) have been commercialized, they are quite expensive and require a good technical know-how to operate them [20]. Therefore there is a need for a device for rapid inexpensive analysis of volatile or-ganic compounds (VOCs), which does not require specialist technicians. Besides this, just like other sensors, it should be portable, less prone to drift over time and highly sensitive as well as selective.
Chemisorption has been the preferred method when a highly selective system is required [20], however, the high binding strength result in poor reversibility. So weaker absorptive interactions are mostly applied because they have good reversibility, but in contrast, have weaker selectivity [20, 21]. This is a trade off which compromises efficiency of the resulting device. Thus the ideal gas sensor should be reliable, robust, selective, sensitive and easily reversible.
This demand gave birth to Electronic nose otherwise known as E-nose. Since its conceptualization, there has been lots of researchers and numerous works pub-lished in this field, The sensor technology of Machine Olfaction got acceptability
in food applications [22, 23], possible medical applications [24] Ozone monitor-ing [25, 26], et cetera. Lately an Electronic Nose Network for monitormonitor-ing live-stock remotely has been reported [27], in their research, Yang et. al. proposed a wireless means of management and monitoring the odors in a livestock in real time. Fig. 1.1 gives a rough schematic of the reported wireless e-nose which is deployed in and around the farm and odor data are collected via wireless commu-nication. The proposed e-nose consists of two main categories, namely the data acquisition section and the data processing part. A software is developed for remotely collecting and processing odor data from the wireless e-nose network; a neural-network-based odor dispersion prototype, proposed for modeling odor dispersion downwind of the odor source in real time. In the operational part, a simple and user-friendly interface is reported, for assisting end users in deter-mining the accurate odor. The schematic of the prototype is shown in Figure 1.1.
1.2
Olfaction of Volatile Organic Compounds
The mammalian nose is for so many reasons, the ideal prototype of a gas sensor, with the ability to identify a specific VOC within a mixture of billions. An infrared sensing system, specifically mid-infrared is the backbone of the photonic nose. It is composed of an infrared light source which provides the initial spectrum, a gas cell, a wavelength selector, and a detector to detect both the background and analyte spectrum. [28, 29] The analyte transmission and the background could be separated with a beam splitter and a dedicated detector for each spectrum. The analyte molecules, when present inside the gas cell, interact and absorb the incoming spectrally filtered infrared photons according to the analytes fingerprint absorption spectra. By monitoring the spectrum from the detector on the other side of the gas cell, it is possible to detect weather or not the wavelength is absorbed and deduce matching molecular structures. [28]
Figure 1.2 gives a relative correlation between the human nose and artificial noses.
Figure 1.1: Architecture of the developed wireless e-nose network. culled from Ref 27
1.2.1
Photonic Nose
The advancement of an artificial nose based on the modulation of optical signals was first reported by Dickinson et al., where a fluorescence-based approach is used in conjunction with a fiber-optics array.
Bayindir Research group has improvised over the years, a novel approach to detect volatile chemicals. In this thesis, we present an optofluidic photonic nose for VOC detection, with improvements such that it is FTIR-free. Thic will come in detail in Chapter 2 and 3. Although the sensitivity of the optufluidic nose stands to be at low ppm levels. This however is adequate for identification of
Figure 1.2: A schematic of e-noses mimicking the mammalian nose. Image from Ref. 28
gases and other applications such as counterfeit beverage detection, for appli-cation of photonic nose in areas such as disease diagnosis, ppb level sensitivity is required. Therefore, improving the performance of the system is paramount. In the previous studies of Bayindir Group researchers, it was shown theoreti-cally that the selectivity of an optoelectronic nose was highly dependent on the photonic bandgap of the fibers
1.2.2
MOSFET and MOS Transducers
The operational principle and application of metal oxide sensors has well been established in literature. It is based on the change in conductance of the ox-ide upon interaction with a volatile organic molecule and the change is usually proportional to the concentration of the gas [30]. There are two types of metal oxide sensors, i.e. the n-type- such as zinc oxide, tin dioxide, titanium dioxide or iron (III) oxide)- (which respond to reducing gases) and p-type- such as nickel oxide, cobalt oxide, (which respond to gases that oxidises) [31]. As for the n-type sensor, it operates when oxygen in the air reacts with the sensor’s surface and traps any free electrons available on that surface or at the grain boundaries of
the oxide grains [30]. This results in the production of a large resistance in these areas due of the lack of carriers and the resulting potential barriers produced between the grains inhibit the mobility of the carrier [30]. In contrast, if the sensor is exposed to reducing gases such as H2, CH4, CO or C2H5, there will be
a drop in the resistance because the gas reacts with the oxygen thereby releasing an electron.
1.2.3
Colorimetric Sensors
Most colorimetric gas sensors employ the changes in the absorption properties of gasochromic materials, these changes results in a color change when exposed to specific gases. Colorimetric sensors use gas sensitive dyes which are embedded into a transparent gas permeable films (mostly polymers), LEDs are coupled at the ends of the waveguides and then directed towards a photodetector to help detect the color change. These sensors have a vast application in day to day life such as fire alarms where CO and NO gaschromic materials are deployed. Many of the array systems have demonstrated remarkable success in chemical vapour detection and differentiation, although the primary aim of these array sensors (such as conductive polymers, [32] conductive polymer/carbon-black composites, [33] fluorescent dye/polymer [34] systems and tin oxide sensors [35])has been the detection of non-coordinating organic vapours. Rarely applied in the most toxic and the most odiferous compounds such as amines, phosphines and thiols and other metal-binding species. Suslick presented a colorimetric array detector for vapour-phase ligands that tackles the problem. He and his team took advantage of the large colour changes induced in metalloporphyrins upon ligand binding, and developed an easy colorimetric technique that minimizes the need for extensive signal transduction hardware. [36]
1.2.4
Virus and Bacteriophage-based gas Sensors
Self-assembly of genetically engineered viruses and bacteria has been harvested for application in gas phase biosensors. [37, 38] Such sensors are composed of phage-bundles incorporated with nanostructures, upon exposure to volatile or-ganic compounds, the photonic structure of the bundles undergo a deformation resulting into a distinct color change, the displayed characteristic color patterns is unique for specific target molecule or gas. For example, M13 filamentous bacte-rial viruses has been depicted in sensing VOC such as Methanol, Ethanol, Ether, Hexane and Distilled Water). [37]
Figure 1.3: Phage litmus sensing of gas phase VOCs. (a) Photographs of the Phage litmus after exposure to hexane, diethyl ether, isopropyl alcohol, ethanol, methanol and DI water, respectively. (b) Real-time RGB colour change profile of a Phage litmus after exposure to DI water. Each plot represents the RGB colour intensity change from each matrix of a Phage litmus. (c) VOC colour fingerprints used to selectively distinguish various chemicals. (d) Principal component analy-sis plot of the colour changes resulting from the exposure of the Phage litmus to different VOCs. Image from Ref. 32
1.2.5
Colloidal Quantum Dots Gas sensing
Lots of articles have shown the advantage of reducing the sizes of metal ox-ide grains down to sub-microns and nanometer scale, this reduction is aimed to further improve the sensing properties such as sensitivity, selectivity and also stability of the oxide layer over time. [39–42] Furthermore, the nanostructured semiconductor oxides provides much larger surface-to-volume ratio, some coupled with their single crystallinity, they provides high stability. Wet synthesized quan-tum dots such as ZnO of sizes ranging from 2.5 - 4.5nm have been studied for application in chemo-resistive gas sensing. Tin Oxide also for example, has wide band gap semiconductor with high chemical stability and excellent optical and electrical properties [39], such sensors also have high sensitivity, simple design, and low weight and cost. [43, 44] This makes Tin oxide semiconductor sensors prominent and widely used for detection of various pollutant and combustible gases.
Chapter 2
Optofluidic Nose
2.1
Introduction
Odorant sensitive and discrimination in the olfactory system appear to have an extensive neural processing of the primary sensory inputs from the olfactory ep-ithelium [6]. Recently, Bayindir research group has improvised a unique approach to photonic nose. The approach has utilized an FTIR (Bruker FTIR demo li-brary) device in taking the data during measurements, an improvement on that is presented in this thesis, an FTIR free robust and compact system for the de-tection and smelling of VOC will be discussed in detail in Chapter 4. Owing to the unique properties that organic elements exhibit at the infrared spectrum, in that every element exhibits a unique absorption spectrum, making it a good op-portunity to discriminate between odoants without undergoing a reaction. This solves the many problems faced by semiconductor metal oxide sensors, because although such sensors have low fabrication cost and are quite simple to operate, oxide sensors suffer from lack of selectivity, they are generally deployed to target a specific gas but not a variety of VOCs or combustible gases. Gas-phase chemical sensing has been an active field for decades and has expanded exponentially with new scientific advancements such as the introduction of nanotechnology. [45–48] A great variety of applications, ranging from toxic chemical detection to disease
diagnostics has been investigated [49–51] and these studies have found practical uses on individual consumer level such as fire or natural gas alarms. However, there are challenges in the commercialization of gas sensors for applications where identification of multiple chemicals is required, such as food and water safety and environmental monitoring. [52,53] For instance, indoor air quality monitoring, the target molecules are an enormous range of volatile organic compounds (VOCs) that evaporate from products such as paint, varnishes, cleaning supplies, pes-ticides, and furnishings. [53, 54] An analytical tool that can be used for such purposes should be able to accurately recognize a wide range of VOCs while addressing the challenges of complexity, size and cost of conventional systems.
A promising solution to successfully distinguish multiple analytes is to use an array of sensors, each responsive to several different analytes, in contrast with the conventional lock-and-key sensors which are specific to a single analyte. [55] Sensor arrays are also called artificial noses [56–59] as their development was inspired by the mammalian nose, where the cross response of various types of sensory proteins, each responsive to a number of different chemicals, are regis-tered to distinguish odors. [60] This approach enables the nose to classify and recognize several different analytes by the unique response of the sensor array to each of them. [55] Artificial noses employing arrays of a great variety of sen-sor technologies have been used for the successful detection and identification of gaseous species. [59] The difficulty in the development of a simple, practical and cost-effective artificial nose arises due to the limitations of the employed sen-sor technologies. For instance, transduction mechanisms that directly measure the physical properties such as the change in resistance, [61–63] or refractive in-dex [64–66] are too non-specific for the recognition of analytes. This leads to the use of highly complex recognition setups [67] or signal interpretation meth-ods [68–70] coupled with the sensor to achieve a reliable selectivity. Alternatively, the surface of the transducers are functionalized with chemical [71–74] or biolog-ical [75–77] recognition layers. To ensure the desired selectivity, each transducer in the array needs to be specific to a different set of analytes than the other. This requires the immobilization of different biological receptor types or employment of different reactive chemicals to each transducer, which substantially increases
the complexity and cost of the system. These problems are usually intertwined with others, such as the impractical response times, temperature dependence and limited reusability, which hinders the development of an all-around artificial nose.
With advancements on Photonic nose, new approached has been taken in making the system more robust and high applicability, there has been studies demonstrating hollow core Bragg fiber arrays for beverage monitoring [76] and VOC detection, however these reported systems used an FTIR device in anal-ysis of the data and experiments. This thesis presents for the first time in the best of my knowledge, an FTIR-free system that detects and identifies industrial toxic gasses as discussed in Chapter 4. In digital optoelectronic nose scheme, an ordinary black-body source such as a heated filament is used. The broadband radiation is coupled to the fibers, and analytes are introduced to the hollow core of the fibers simultaneously. The array response is measured with an array of infrared detectors. The quenching in the transmission of each fiber is registered to identify the chemical and tag the chemical with a binary code.
2.2
Hollow
Core
Array
of
Photonic
Bragg
Fibers
A competent alternative to artificial noses which could address these problems is the measurement of the light absorption of analyte gases in hollow waveg-uides [78, 79] or gas cells [49]. Midinfrared absorption is particularly promising for the detection and identification of chemicals as most chemicals have specific absorption bands within this range and the electromagnetic wave absorption is several times higher compared to shorter wavelengths. [49, 80] Discerning target molecules by their absorption bands require the coverage of a wide wavelength range with good spectral resolution in the measurements. Additionally, long optical path lengths are necessary to ensure the desired sensitivity, as stated by the Beer-Lambert law. Several techniques were developed to overcome the
issues of optical path length and wavelength selectivity. These methods incorpo-rate a monochromator or interferometer system [81–83], tunable monochromatic light sources [84–86], or wavelength filters [87] to determine the absorption wave-lengths. The wavelength selective parts are coupled with different optical cavity designs or waveguides to enhance the light-analyte interaction. [49, 80–82] How-ever, the size reduction of these systems remained limited as the solution of this two sided problem requires a straightforward approach that can address the is-sues of wavelength selectivity and long optical path lengths simultaneously. As seen in 2.1In an array of fibers, the bundle consist of a number of fibers each of different transmission band, this gives the ability to not only identify a single chemical, but also separate a range of chemicals, i.e, the number of chemicals to be selectively identified increases exponentially with an increase in the number of fibers in the bundle. [86]
Figure 2.1: Phage litmus sensing of gas phase VOCs. (a) A bundle of fibers with different target wavelengths, each representing a binary logic after the passsage of anaytes and IR light coupled into the fiber. (b) Crossection of the fiber showing multilayered reflective mirrors inside the fiber. Chalcogenide and Polymer alter-nating layers (c) Light bounces inside the fiber with an inner diameter of about 100-500 microns.
2.3
Binary Code Identification of Chemicals
As each fiber is addressed separately during the measurements, it is possible to assign a threshold value to each fiber and register the response as a true (1) or false (0) in Boolean algebra. In this approach, if the fiber response is higher than a predetermined threshold value, the chemical is tagged with a 1 for the measurement with this particular fiber. If the response is lower than the threshold it is tagged as 0. We apply this method in chapter 4 for the identification of industrial toxic gases. Hierarchical clustering analysis of the 25-fiber array response and the binary codes of each chemical assigned by the array. Successful classification and binary tagging of 100 chemicals was possible with the array of 25 fibers [28]
Chapter 3
Design and Fabrication of
Photonic band gap fibers
3.1
Introduction
The propagation of electromagnetic radiation in periodic media is a subject of great interest lately due to its vast areas of application. It is quite known that electromagnetic radiation or light, experience Fresnel reflection from dielectric interfaces where the refractive index is alternating of various material. Periodic layered media are bulk of layered media where layers of dielectric material are being stacked in periodic fashion. A layered media can contain a minimum of two different layers. The different layers can have varying thickness or same thickness, depending on the property of the desired wave of propagation. Many phenomena affect the efficiency of light propagation and reflectance. Factors such as the optical properties of the material of choice (real and imaginary part of the refractive indices, the attenuation on the material), the thicknesses/period of the layers, the number of layers and also the morphology of the surfaces are a few important parameter for all reflectors, but the effect of some of these factors are less crucial depending of purpose of application. For example, the effect of the
roughness of the reflective surfaces illustrated in equation 3.1 is vital for reflec-tive mirrors especially in X-rays, this is because the thickness is in range of few nanometers and a little deformation can change the phase-shift, In the equation, R is the reflectance of the first Bragg order, R0 stands for reflectance of perfectly
smooth multilayer surface while Λ, σ represents the period of the structure and the root-mean-square of roughness respectively. In infrared, since the wavelength is significantly higher, roughness of surface is more tolerable than Xray reflec-tors and since we use top to bottom approach, roughness before fabrication are reduced by orders of magnitude after the final photonic fibers are fabricated
R(σ) R0
= exp(−4π
2σ2
Λ2 ) (3.1)
For the reflection of mid infrared light, it is necessary to engineer the struc-ture to comply with the principle of operation for constructive interference of the waves reflected from the individual lattice plains of the crystal, this is referred to as Bragg reflection [12]. Bragg reflectors are multilayered photonic crystal mate-rials, that contins alternating layers of two dielectric pair materials with different refractive indices. By using a stack of such layers, mirrors can be fabricated, and targeted to obtain any reflectivity between 0% and almost 100% for a specific target wavelength, λ. This case is different in metallic mirrors, where the high reflectivity arises because of the extinction of light, Bragg reflective mirrors of-ten exhibit small intrinsic absorption. The high reflectivity is purely caused by multiple constructive-interference effects.
3.2
Multilayered Hollow core Bragg Fiber
A composite polymer/chalcogenide hollow cylinder which has dielectric multi-layers of arsenic triselenide chalcogenide glass (As2Se3) and Poly(ether sulfone) (PES) enclosing its hollow core was prepared by top-to-bottom thermal approach for fiber fabrication. Steps and procedures will be discussed later in this chapter.
But before the fabrication of the Bragg fibers, one important step is the selec-tion of material. Two important aspects to bear in mind here are: (1) Intrinsic properties of the material, which includes optical property, mechanical, chemi-cal properties etc. (2) secondly the spectrum of application. It is important to note that the material will be used for identifying absorption of other elements or compounds, therefore if the infrared spectrum of the chosen material has high absorption within the the span of its application, then it will limit the transmis-sion of the fiber eventually. The first part is important for the optical reflectivity, satisfying the Bragg law and modeling the thickness. The second part is impor-tant for application of such fiber. Ideally, a material with little or no absolution will be desired, but we are limited with polymers here, which all have absorption in the mid infrared range. Figure 3.1 gives the absorption of some polymers, and we can see PES holds the least total absorption amongst them.
3.3
Selection of Materials
3.4
Polymer/Chalcogenide Bragg Fibers
As noted from Figure 3.1, (a) and (b), the absorption of polycarbon (PC) and polyetherimide (PEI) is not very strong at wavelengths above 15 µm. How-ever there are absorption bands for almost How-every wavelength smaller than this value. Polysulphone (PSU) on the other hand, has absorption-free regions only at around 15 µm and 20 µm. Polyethersulphone (PES) also has absorption peaks throughout the mid-infrared, however, there are regions without any absorption at the wavelengths around 5 µm, 10 µm, 15 µm and 20 µm. These absorption-free regions can be exploited for the fabrication of fibers with bandgaps scanning the whole mid-infrared. Therefore, PES was chosen for our fabrication of Bragg fibers.
Figure 3.1: Infrared absorption spectra of the candidate polymer materials for fiber fabrication. (a) Polycarbon (PC), (b) polyetherimide (PEI), (c) polysul-phone (PSU), (d) polyethershulpolysul-phone (PES).
3.4.1
Properties of Polymer and Chalcogenide
The flexibility of polymer is an important quality that allows for making bends and coils of photonic fibers. It is a cheap material and readily available, its not poisonous and has high durability. This gives the photonic fiber a very long period of application. Arsenic Selenide on the other hand has no absorption in the mid-infrared region, making it a perfect candidate for this application, it is cheap and not exposed after fabrication, so there is no danger of toxicity. On the Optical properties side, chalcogenide has 2.6 refractive index and PES has 1.7, this gives a good contrast and modeling each thickness during drawing, gives opportunity to satisfy the Bragg equation for various wavelengths within out interest
3.4.2
Measurement and Preparation of Polymer Film
Films
The dimensions of the polymer used are 30cm by 50cm, with thickness of about 46 µm. The length of the film is selected accoding to the dimension of the cored rod and number of multilayers required. we used an 18cm diameter rod for this experiment. The chalcogenide glass were initially in form of ingots, and they were ground in a mechanical blender to attain fine powder to feed into the thermal evaporator.
3.4.3
Surface activation and treatment of Polymer
sur-faces
The PES film is treated with a plasma to activate the surface and increase the total surface area. Adhesion and wettability are of critical importance during the deposition. layer coatings will be placed on the surface through the thermal evap-oration, the surface plasma treatment increase the adhesiveness of the material. The effect o the surface morphology can be seen from the AFM image in figure 3.4.3. SEM images of the surface in figure 3.4.3 shows increase in roughness after 180W plasma treantment. The surface activation of polymer helps with adhe-sion of films especially when interfaces adheadhe-sion is difficult to accomplish due to inherent chemical surface differences of the interfacing surfaces. In general, the oxidation of methyl groups (-CH3) into -CH2OH groups following treatment is regarded as the fundamental change in surface chemistry that affects the wetta-bility and adhesion properties of the polyolefin substrate [88], suggesting that the oxidation process is mainly mediated as a result of the OH radicals during the flame treatment. [89, 90]
AFM and SEM images were taken for polymers after plasma treatment, and the wettability is measured using contact angle device shown in Figure 3.6. Figure 3.4.3 shows the AFM of PES polymers before and after the treatment. the surface area of reaction increases after the plasma treatment, and this is expected to aid
Figure 3.2: (a) Shows the SEM image if polymer film after 180W treatment for 12 minutes. (b) Shows the surface of PES polymer before treatment
the bonding of deposited chalcogenide material during the thermal deposition.
Figure 3.3: Atomic Force Microscope image of PES polymer before and after plasma treatment for 25 minutes
3.4.4
Preparation of As2Se3/PES Preform
Hollow-core infrared Bragg fibers were prepared by thermal drawing in a cus-tom made fiber tower, as seen in figure 3.4.4 . A low temperature fiber tower
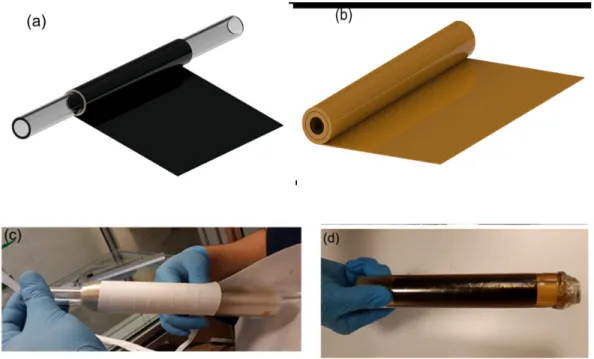
is used because both chalcogenide and polymer have melting points below 400 degrees Celsius. Firstly, a thin film of PES polymers was placed inside a thermal evaporator, the film was treated as mentioned earlier in the chapter. The PES films (with sizes of about 50 cm x 30 cm) were coated with As2Se3 glass in a custom made thermal evaporator for large surface area films. The ratio of the chalcogenide coating (refractive index of about 2.8) and polymer film (refractive index of about 1.6) thicknesses were arranged to form high refractive index con-trast quarter wave stack multilayers as the coated films are rolled into a cylinder. After the deposition of the chalcogenide, the structure is then rolled on a cylin-drical glass of 18mm diameter). The rolls of this film causes a periodic alteration between the two materials, i.e As2Se3 in contact with glass, followed by the poly-mer material, then chalcogenide again as shown in Figure 3.4.4. After a film is rolled, the preform is further rolled with only PES film until a diameter of 36 mm is attained. after this the rolled structure is placed in oven under vacuum in controlled heating steps of 50 degrees to 70 degrees. This done in order to remove potential moist and purge humidity between the films.
3.4.5
Preform Preparation
The next step in preparation of preform is consolidation and then etching. The winded layers of polymer and chalcogenide are first covered with a teflon tape, this helps not only in holding the structure together, but also provides mechanical support when inserted into the oven
3.4.5.1 Consolidation
During conslidation, it is expected that the air molecules trapped between the layers will evaporate, this is why it is necessary to leave small room when covering the outer layer with teflon. After the the structure is put in a consolidator, here, the preform is heated to a temperature of 340 degrees Celsius, this makes sure the films stick to each other embedded with the chalcogenide layers between them.
Figure 3.4: (a) The coated film is first rolled around the glass rod. (b) The coated polymer film is then followed by a uncoated layers polymer film to provide mechanical support for the multilayer (c) Teflon tape used to cover the preform before consolidation. (d) A preform sample, after consolidation before etching of core glass
The temperature of consolidation depends greatly on the type of material used, but generally, it is a temperature before either of the materials reach melting point. The consolidation takes about 2 hours and the preform is left to cool gradually.
3.4.5.2 Etching of Quarts glass
The next step is a wet etching, done to remove the initial glass rod. Chemical etching with hydrofluoric acid is applied with seeds placed in the solution to rotate the solution in order to accelerate the etching procedure. After the glass is completely etched, the preform is rinsed intensely with water. It is important here, to note the type of etching material used. the purpose of the etching it to remove the rod inserted in the middle of the preform, therefore if another material is used other than quartz glass, then a different etching material might need to be
Figure 3.5: Fiber tower used for drawing fibers at low temperature below 800 degrees Celsius
used to remove the rod, but not to affect the surrounding layers of consolidated preform.
Steps of the preform preparation: (1) Polymer/chalcogenide composite films are rolled around a glass rod. (2) The polymer part which will form the cladding is obtained by rolling bare PES films around the composite structure until the desired preform diameter is reached. (3) The preform is covered by Teflon tape to protect it from extra heat during the consolidation. (4) The composite preform which is ready for drawing after consolidation and etching of the glass.
3.4.6
Fiber Drawing
The obtained polymer/chalcogenide composite rod (preform) was fed to the fur-nace of a fiber tower and drawn under controlled load and temperature as shown in Figure 3.4.4. Through the thermal drawing of the fiber, the quarter wave stack period of the preform is scaled down by a controllable factor. The array of six hollow-core fibers used in this study is shown in Figure 4.4. The fibers have lengths of approximately 30 cm, diameters of about 1-2 mm and hollow core diameters ranging from 300 µm to 800 µm. The photonic bandgap of the fibers can be adjusted during the drawing by controlling the fiber diameter. Fig-ure 3.7 shows the cross-section of fabricated multilayer fiber with 13 bi-layers of As2Se3 and PES which forms the dielectric mirror structure centered around 11 µm wavelength.
The six-fiber array used in chapter 4, designed to scan the wavelength range of 2 to 14 µm and target different absorption bands of the chemicals were tunes in this step. The transmission spectra of the fibers were measured by taking transmission measurements with a Fourier transform infrared spectrometer (FTIR Bruker, Tensor 37). Each fiber has a photonic bandgap centered at a different spectral position of the midinfrared. For this measurement, the blackbody light from the FTIR source was coupled to the Bragg fibers and the transmittance was measured by aligning the fiber end to the externally used detector of the FTIR. The FTIR was used for specifying the transmission bands, and not the analyte quenching measurements.
Figure 3.6: A contact-angle device (DataPhysics OCA)used in measuring the wettability of polymer surfaces before thermal evaporation.
Figure 3.7: (a) Scanning Electron Microscopy (SEM) Cross section of hollow core Bragg fiber. (b,c) PES/Chalcogenide multilayer (d) Image of Fabricated fibers
Chapter 4
Binary Coded Identification of
Industrial Chemical Vapors
4.1
Optofluidic Nose Setup
An optofluidic nose concept which combines the sensor array approach of artificial noses and the advantages of light absorption-based methods in the midinfrared. [28] has been shown, achieved through the cross response of an array of hollow core Bragg fibers [29,86,91], i.e. wavelength scalable infrared photonic bandgap fibers. Bragg fibers have dielectric mirrors (high refractive index contrast multilayered structures) surrounding their hollow cores and therefore their transmission is at a specific band of the electromagnetic spectrum. The spectral location and bandwidth of the photonic bandgap can be tuned during the fiber drawing in the whole midinfrared range. [91,92] In this optofluidic nose concept, the array of Bragg fibers, each transmitting at a different band in the midinfrared, function as an infrared filter array and hollow waveguides simultaneously to ensure long path lengths and wavelength selectivity. The cross response of the array is a unique signature of the analytes infrared absorption and allows the selective identification of virtually any target molecule. [86, 93, 94]
In this chapter, I will demonstrate an artificial nose system for the recognition and classification of gas phase analytes and its application in identifying common industrial gases. We reported the first prototype of the optofluidic nose and used it for the identification of 7 common industrial VOC vapors. At the core of the device is an array of six Bragg fibers that scan the region of 2-14 µm. The device used a simple blackbody source, an HgCdTe (MCT) infrared detector coupled to the fiber array and additional simple, low-cost optical and electrical elements. Each chemical can be tagged with a unique binary code by addressing the fibers separately and by assigning a threshold value to each, allowing a simple data analysis. An excellent selectivity that recognized the tested VOC vapors in repeated measurements and classified them with unique six-digit binary codes was demonstrated
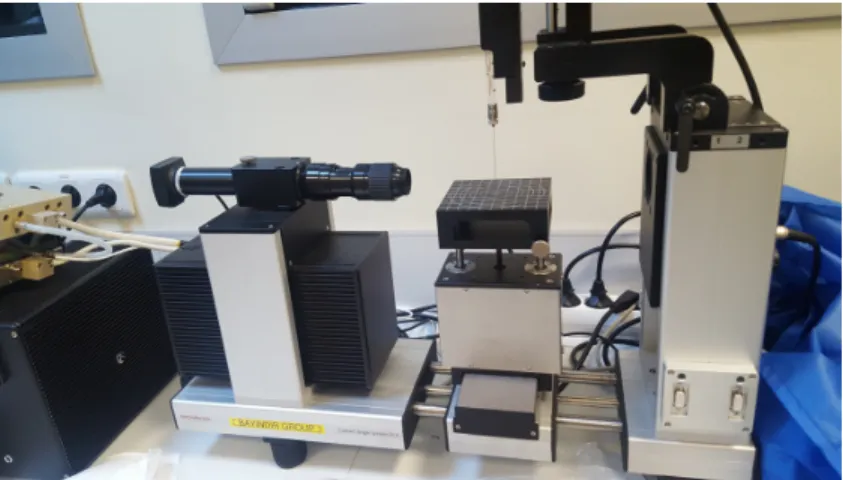
Figure 4.1: (a), (b) The optofluidic nose measurement setup. OAPM: Off Axis parabolic gold mirror, SS: Shutter stage, FH: Fiber holder, ZnSe: Zinc Selenide infrared lens, MCT: Mercury Cadmium Telluride infrared detector, MFC: Mass flow controller. FH1 is used to hold the tips of the fibers at equal intervals. Industrial chemical vapors are introduced to the fiber array through FH2, which is sealed against leaks and that allows the coupling of the infrared light to the MCT detector.
Figure 4.1 shows the experimental setup of the optofluidic nose system and the photograph of the setup is given in Figure 4.1b. The method relies on taking the cross response of the six fibers in the array to recognize the chemical vapors. The response of each fiber is the quenching in its transmitted intensity due to the infrared absorption of analyte molecules at the hollow fiber cores. Accordingly, the measurements comprise the measurement of the transmitted intensity of each fiber before and after analyte introduction. The developed optofluidic nose device employed a single blackbody source (silicon nitride heating element from Crystal-Technica (UK)) to ensure a broadband emission covering the whole 2-12 µm range. The light from the blackbody source was focused to a beam of a few cm in diameter with an off-axis parabolic gold mirror (OAPM). The tips of the fibers were aligned to the beam. An electric motor was employed as a chopper to modulate the radiation for the HgCdTe (MCT) infrared detector (InfraRed Associates Inc., MCT-13-2.00 (MSL-8)). A shutter stage (SS) was employed at the fiber tips to allow the coupling of the broadband radiation to only a single fiber at a time, and by moving the shutter slit to fiber end the transmission of each fiber was measured separately. The fibers were aligned with equal intervals with a custom design 3D printed fiber holder (FH1). A second fiber holder (FH2) was employed for the introduction of analyte gas into the fibers and for the coupling of the transmitted light to the MCT. FH2 allows the flow of analyte vapor and carrier gas through the hollow core of the fiber, and the coupling of the broadband IR light to the fiber simultaneously. It comprise aluminum parts that are sealed against gas leakage and a ZnSe infrared lens at one end. The ZnSe end is aligned with the MCT to allow maximum coupling of the transmitted light from the ends of the fibers to the MCT. The MCT is operated with a commercial preamplifier (Infrared Systems Development, MCT-1000 Current Mode Preamplifier) and the detector response is read out with an oscilloscope (LeCroy, WaveAce 112). For the analyte introduction, two mass flow controllers (MKS, multi gas controller 647) were connected in parallel, to provide a controlled gas flow into fiber cores. The mass flow controllers (MFC) were attached to a Nitrogen gas canister, for the supply of Nitrogen as the carrier gas. The analyte vapors at room temperature were taken from bubblers with one of the MFCs and flowed through the hollow cores of all fibers in the array simultaneously. Nitrogen was saturated with the
analyte vapors at the analyte bubblers under constant flow which was adjusted by the MFC. The second MFC was used to purge the fiber cores before and after each analyte measurement.
4.2
Measurements and Data Analysis
All measurements were taken at room temperature (varying between 15 to 22 degrees Celsius) and under ambient humidity. For the measurements, the back-ground signal of each fiber in the array (the transmitted intensity of the fiber without the presence of analyte molecules in the hollow core) was taken after the fiber cores were purged with carrier Nitrogen gas. The shutter stage was employed for rapidly taking the background measurements of each fiber, without any other adjustments in the setup. After the background measurements, the analyte gas was flowed through the fiber array and the measurements were repeated with the presence of analyte molecules in the hollow cores of the fibers. The MCT readout for each of the fibers were recorded in electrical potential units from the oscillo-scope. Three measurements were taken for each analyte-fiber combination. The detector readout was converted to the fiber response by ((S-S0)/S0)*100), where S0 is the background signal read from the MCT before the analyte introduction and S is the signal after the analyte introduction. The averages and standard deviations of the fiber responses were used to determine threshold values of each fiber to register the response of the fiber in binary logic, the table for all the result of the responses is presented in 4.1. The threshold values were determined considering the reliability of the recognition in repeated measurements. For this purpose, threshold values that ensure a unique binary code to each analyte were chosen outside the standard deviation in the fiber responses. The fiber responses to each of the 7 tested chemical vapors and the corresponding binary codes were converted to color scale with a commercial software. Figure 4.3 shows absorption of two analytes through a fiber and the threshold identification.
.
Table 4.1: The measurement data taken with the optofluidic nose. The averages and standard deviations of the three measurements taken for each fiber-chemical combination, the digital codes of the chemicals and the thresholds for each fiber are listed
4.3
Chemicals
Acetic acid and Ethyl acetate were purchased from Sigma-Aldrich, Acetone from Carlo Erba, Benzene and Formaldehyde from Panreac, Hexane from Emplura, and Toluene from Emsure. All chemicals were used as received. The chemicals are put in bubbler tubes (shown in Figure 4.2) to be able to pass gas through the liquid and collect the vapour above the gas
4.4
Fiber Array Responses to Chemical vapors
Six hollow core Bragg fibers with transmission bandwidths ranging from 1 to 3 µm at different spectral positions in the midinfrared, were employed for the optofluidic nose. The photonic bandgaps (transmission bands) of the fibers were arranged to scan the range of 2-14 µm, where most chemicals have specific absorption bands.
Figure 4.2: (a) Enclosed compartment where bubbler flask are filled with liquid toxic chemicals (b) Pair of bubbler tubes used for injecting gas to purge our the vapour pressure. (c) A Thermobath filled with blubbers tubes of toxic chemicals to maintain a steady temperature during measurements
The transmission spectra of the six fibers are shown in Figure 4.4b. The photonic bandgap Fiber 1 is centered at 12 µm, Fiber 2 at 10.5 µm, Fiber 3 at 8.5 µm, Fiber 4 at 7.5 µm, Fiber 5 at 6 µm and Fiber 6 at 3.3 µm. Most chemicals have several narrow and dense absorption peaks (often narrower than the transmission bandwidth of the fiber) in this region, as it is related to the vibrational and rotational modes of the molecules. The response of the fibers are the percentage of quenching in their transmitted intensity when the analytes are introduced to the hollow fiber cores.
Figure 4.3: The response of Fiber 2 to industrial chemical vapors. (a) There is no significant overlap of the transmission band of Fiber 2 and the absorption bands of Toluene vapor, resulting in only a slight quenching (4 percent) in transmission with the presence of Toluene molecules in the fiber core. (b) The transmission of the Fiber 2 is quenched 45 percent from the initial value in Ethyl acetate measurement due to the absorption bands at 9 and 11 m. (c) The response of Fiber 2 to the 7 different common industrial chemical vapors. (d) Binary coded representation of Fiber 2 response. Blue scale representation of the Fiber 2 response to the chemicals. The determined threshold value of 35 percent tags Acetic acid and Ethyl acetate with a 1 whereas the remaining chemical vapors are tagged with a 0. (Aa: Acetic acid, Ea: Ethyl acetate, He: Hexane, Fo: Formaldehyde, Ac: Acetone, Be: Benzene, To: Toluene).
The transmission band of a single fiber is often overlapping with the absorp-tion bands of several different analytes, which results in a quenching of fiber transmission when these analytes are introduced to the fiber core. Therefore, each fiber in the array is not specific to a single, but to several different analytes. The magnitude of the response of the fiber is directly related with the extent of overlap between the absorption bands of the analyte and transmission band of the fiber. This results in a selective response to multiple analytes, i.e. each fiber responds to the analytes at varying degrees. For instance, Figure 4.3a and Figure 4.3b shows the response of Fiber 2 to Toluene and Ethyl acetate vapors. Since the only overlapping of the transmission band of Fiber 2 (centered at 10.5 µm) is with the side band of the absorption band of Toluene centered at 9.5 µm, there is only a slight (4%) quenching of Fiber 2 transmission (Figure 4.3). In comparison, two Ethyl acetate absorption bands, centered at 9 and 11 µm, which are overlapping with the transmission of Fiber 2 (Figure 4.3b). Accordingly, the response of Fiber 2 to Ethyl acetate is about 45%. The response of Fiber 2 to all 7 chemical vapors tested in this study are shown in Figure 4.3c. Three separate measurements were taken with each analyte to calculate average and standard deviation of the fiber responses. As can be expected with a midinfrared sensor, even a single fiber is very selective, with significant difference in the responses to most of the analytes. In the case of Fiber 2, the response is not specific enough to distinguish between Acetic acid Ethyl acetate and Formaldehyde Benzene. This does not hinder the performance of the device however, as with artificial noses the purpose of each sensing element in the array is not to determine a specific analyte but to supply a broad and versatile response The selectivity of the fiber response and the versatility to respond to multiple analytes is exploited for simple classification and recognition of analytes. As each fiber is addressed separately during the measurements, it is possible to assign a threshold value to each fiber and register the response as a true (1) or false (0) in Boolean algebra. In this approach, if the fiber response is higher than a predetermined threshold value, the chemical is tagged with a 1 for the measurement with this particular fiber. If the response is lower than the threshold it is tagged as 0. The response of the six-fiber array then can be obtained as a six-digit binary code for each chemical vapor. Figure 4.3 d shows the response of Fiber 2 to each of the chemical vapors
in color code. A threshold value of 35% was determined for Fiber 2, which tagged Acetic acid and Ethyl acetate as 1 and the remaining chemical vapors (Hexane, Formaldehyde, Acetone, Benzene and Toluene) as 0 (Figure 4.3d). As there are only two possible codes in binary logic, a 1 and a 0, the binary coding of the response of a single fiber is not useful for identifying the analytes. However, the possible codes that the analytes can be tagged with, increases exponentially with the total number of possible tags being; 2n where n is the total number of fibers.
Optofluidic nose comprises of a broad band light source, although only the infrared region is utilized. Therefore an infrared source is also suitable, a hollow core photonic band gap, whose fabrication processes have been discussed in detail in Chapter 3. A Hydrogen cooled MTC detector (IR detector) It should be mentioned that in place of this MTC detector, a cheap thermal camera can also be used, to analyse the intensity of the transmitted integrated infrared energy from the other side of the fiber. The length of the fibers are typically around 30 cm, their hollow core diameters are around 7000 µm, and their cell volume are about 100 µL. It is important to maintain the length of the fibers equally, because the longer the fiber, the higher the quenching and thus, the response of the fiber. Some optical elements such as IR parabolic mirrors and IR lenses are used to focus the light to the tip of the fibers. It is important to couple as much of the incident light into the fiber. Another advantage that the optofluidic nose has compared to other gas-cell sensors, is the provision of gaseous path by the photnoic fibers. Technically, the fiber does not only help in filtering the incident spectrum, but it also provide a fluidic channel to guide the analyte. This is great importance espetially when dealing with toxic or carcinogenic gases. The thickness of the periods of Bragg structure and their refractive index contrast determines their transmission spectra band. By simply changing the dielectric layer thicknesses, the transmission spectra of fibers can be tuned in the whole mid-infrared region (2-20 µm). Fibers used in this study have fundamental transmission bands shown in Figure 4.4. Also, it can be seen that second order transmission bands with much lower intensities exist, which is typical for Bragg fibers, Such higher order bands can be eliminated by adiabatically tapering the fiber, it is otherwise knows as conical fiber. The spectral positions of the fibers were decided by examining
4.5
Recognition and classification of Industrial
Toxic gases
When applied to each of the fibers in the array, the binary coding approach allows simple classification and recognition of analytes without the need of employing any pattern recognition techniques such as hierarchical cluster analysis or prin-cipal component analysis. The responses of each fiber in the six-fiber array to the chemical vapors were measured by introducing the chemical vapor to the hollow cores of the fibers in the array simultaneously and rapidly measuring the quenching in each fibers transmission. The transmitted intensity of the fibers were recorded before and after analyte introduction to the array. The scheme of the measurement setup is shown in Figure 4.1. The response time of the fibers are very fast (sub-second) as it is only limited with the response time of the infrared detector and not with the adsorption of the analyte to any recognition layer. Additionally, the signal recovers completely after the fibers are purged with the carrier gases, no analyte residue remains in the hollow fiber cores. The response of each fiber was calculated by comparing the quenching in the fiber transmission with analyte introduction, as explained in the example of Fiber 2 in the previous section. The color coded average response of the array to all 7 tested industrial chemical vapors are shown in Figure 4.11. The responses and the standard devi-ations of the responses of each fiber to the chemical vapors are given in column Figures 4.5, 4.6, 4.7, 4.8 4.10 ,4.10 . A unique set of responses to each of the industrial chemical vapors is demonstrated with the developed straightforward optofluidic nose system demonstrating the robust selectivity. It should be noted that there is potential for further miniaturization of this device for the develop-ment of portable midinfrared optofluidic noses. The mass flow controllers can be replaced with a simple fan, and the oscilloscope with a readout circuit in a portable design. The MCT, which is the most expensive element in the device can be replaced with more compact and low-cost broadband infrared detectors such as pyroelectric DLATGS detectors. Using the full potential of midinfrared hollow waveguide sensing techniques and the sensor array approach of the artifi-cial noses, reduces the need for expensive instrumentation and design complexity.
To register the fiber response data as a binary code, a separate threshold value was determined for each fiber. Since the responses of the fibers vary greatly from analyte to analyte, there is a significant flexibility during the determination of threshold values. Proper threshold values that will produce a unique binary code to each chemical vapor in repeated measurements were determined considering the standard deviations of each of the measurements. Once the threshold values have been determined for each of the six fibers in the array and each chemical is tagged with a unique six-digit binary code, there is no need to make any further adjustments for a repeatable and reliable recognition. The threshold values were determined as 10% for Fiber 1, 35% for Fiber 2, 30% for Fiber 2, 7% for Fiber 4, 20% for Fiber 5 and 25% for Fiber 6 and are shown in color code in Figure 4.11a. The binary codes of the tested chemicals as registered by the optofluidic nose with these thresholds shown in 4.11b. Each chemical vapor was classified with a unique binary code. It is interesting to note that chemicals with similar molecu-lar structures have simimolecu-lar binary codes with the optofluidic nose. For instance, Acetic acid and Ethyl acetate differ only in their functional groups bonded to the Oxygen atom in the carboxylic acid. Accordingly, Acetic acid is tagged with 110111 with the optofluidic nose, whereas the binary code of Ethyl acetate dif-fer only in the 3rd fiber with 111111. Similarly, Toluene 000101 is distinguished from Benzene 000100 only with the methyl group (-CH3) attached to a phenyl group (-C6H5). This effective classification is a benefit of directly measuring the midinfrared absorption of molecules. The spectral location and strength of the absorption bands of chemically similar species are alike as the infrared absorption bands are originated from molecular bonds and vibrational or rotational modes of molecules. With the developed optofluidic nose, the 7 tested common indus-trial chemical vapors were accurately catalogued and classified simply with digital codes. The averages and standard deviations of the fiber responses were used to determine threshold values of each fiber to register the response of the fiber in binary logic. The threshold values were selected considering the reliability of the recognition in repeated measurements. For this purpose, threshold values that ensure a unique binary code to each analyte were chosen outside the standard de-viation in the fiber responses. Accordingly, the threshold is determined after the
responses of the whole array have been calculated, by considering which chemi-cals each fiber can differentiate with the selected threshold value. For example, since Benzene and Toluene are chemically similar species, the responses of the fibers are similar for these analytes. Therefore, care is taken when determining the threshold of 25 % for Fiber 6 to ensure that the fiber can distinguish these two chemicals in binary codes
It is clear from Figure 4.4 that the transmission spectra of some fibers do not have single peak (e.g. Fiber 3 has several peaks spanning 7.5 µm to 9.5 µm) due to the fact that PES polymer itself has high absorption at the mid infrared range, and this interferes with the transmission profile of the fiber. To circumvent this problem, an all-chalcogenide multilayer fiber can be used, since chalcogenides have no absorption at these wavelength ranges [92]. Furthermore, a sharper peak can be attained by tapering the fiber during thermal drawing, these conical fibers have been shown to eliminate higher order transmission bands and also narrow the fundamental photonic band spectrum.
Figure 4.4: Wavelength scalable hollow core Bragg fibers with photonic bandgaps at different parts of the midinfrared wavelengths. (a) Thermal fiber drawing al-lows scaling down the diameter, and the quarter wave stack period of the dielectric mirrors (polymer/chalcogenide multilayers) along with it simultaneously. This al-lows tuning the bandgap of the fiber during drawing. (b) The array of Bragg fibers used in this study. (c) The SEM image of Fiber 1, showing the multilayer stack (dielectric mirror), and hollow core where volatile chemical molecules are intro-duced and the infrared light is coupled to the fiber simultaneously to measure the change in transmission with the presence of the analyte. (d) The transmission spectra of the six fabricated fibers which covers the fingerprint region.
Figure 4.5: The response of Fiber 1 to the 7 different common industrial chem-ical vapors. With Binary coded representation of Fiber 1 response. Blue scale representation of the Fiber 1 response to the chemicals. The determined thresh-old value of 10 percent was tagged. (Aa: Acetic acid, Ea: Ethyl acetate, He: Hexane, Fo: Formaldehyde, Ac: Acetone, Be: Benzene, To: Toluene).
Figure 4.6: The response of Fiber 2 to the 7 different common industrial chemical vapors. With Binary coded representation of Fiber 2 response. Blue scale rep-resentation of the Fiber 2 response to the chemicals. The determined threshold value of 35 percent tags Acetic acid and Ethyl acetate with a 1 whereas the re-maining chemical vapors are tagged with a 0. (Aa: Acetic acid, Ea: Ethyl acetate, He: Hexane, Fo: Formaldehyde, Ac: Acetone, Be: Benzene, To: Toluene).