Functional Electrospun Polystyrene
Nanofibers Incorporating
␣-, -, and
␥-Cyclodextrins: Comparison of Molecular
Filter Performance
Tamer Uyar,†,‡,* Rasmus Havelund,†Jale Hacaloglu,⬜ Flemming Besenbacher,†,§and Peter Kingshott† †Interdisciplinary Nanoscience Center (iNANO), Aarhus University, DK-8000 Aarhus C, Denmark,‡UNAM-Institute of Materials Science & Nanotechnology, Bilkent University, Ankara 06800, Turkey,§Department of Physics and Astronomy, Aarhus University, DK-8000 Aarhus C, Denmark, and⬜Department of Chemistry, Middle East Technical University, 06531 Ankara, Turkey
E
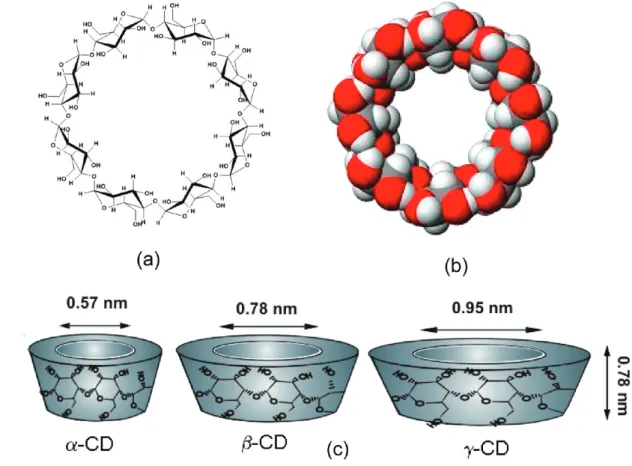
lectrospinning of functional poly-meric nanofibers has attracted con-siderable attention in the past de-cade due to the simplicity of the process and the enhanced properties associated with the size of the fibers.1⫺4One potential application for electrospun nanofibers is in the field of filtration and separation science where the so-called nanowebs can provide separation of tiny particles and have signifi-cantly higher adsorptive capacity in filtration.5⫺8In filtration of organic mol-ecules from complex solutions, the capac-ity to selectively remove the target mol-ecule(s) with high efficiency is highly desirable. One approach that we employ is to exploit the properties of cyclodextrins (CDs) that can form inclusion complexes with hazardous chemicals and polluting substances.9⫺13Hence, the functionaliza-tion of electrospun nanofibers/nanowebs with CDs incorporated is very appealing since these nanowebs can potentially act as highly selective molecular filters for the removal of different types of organic mol-ecules from solution.14,15In addition, the high surface area of the nanofibers signifi-cantly enhances the uptake efficiency as more CDs are present.Cyclodextrins (CDs) are cyclic oligosac-charides having a toroid-shaped molecular structure that are able to form noncovalent host⫺guest complexes with various molecules.16⫺19The most common CDs can have 6, 7, or 8 glucopyranose units in the cy-clic and are referred to as␣-, -, and ␥-cyclodextrins (␣-CD, -CD, ␥-CD), respec-tively (Figure 1). The depth of the cavities for the three CDs is the same (⬃7.8 Å), while
the cavity diameters of␣-CD, -CD, and ␥-CD are ⬃6, 8, and 10 Å, respectively.20 The formation of cyclodextrin inclusion complex (CD-IC) and its strength/stability mainly depend on the size/shape match and binding forces (hydrophobic interac-tions, van der Waals attracinterac-tions, hydrogen bonding, electrostatic interactions, etc.) be-tween the host CD cavity and guest molecules.21,22Therefore, different types of CDs (␣-CD, -CD, ␥-CDs, and chemically modified CD derivatives) show different ca-pabilities and stabilities when forming in-clusion complexes with the same host molecule.
*Address correspondence to [email protected]. Received for review May 3, 2010 and accepted August 11, 2010.
Published online August 18, 2010.
10.1021/nn100954z
© 2010 American Chemical Society
ABSTRACT Electrospinning has been used to successfully create polystyrene (PS) nanofibers containing either of three different types of cyclodextrin (CD);␣-CD, -CD, and ␥-CD. These three CDs are chosen because they have different sized cavities that potentially allow for selective inclusion complex (IC) formation with molecules of different size or differences in affinity of IC formation with one type of molecule. The CD containing electrospun PS nanofibers (PS/CD) were initially characterized by scanning electron microscopy (SEM) to determine the uniformity of the fibers and their fiber diameter distributions. X-ray photoelectron spectroscopy (XPS) was used to quantitatively determine the concentration of each CD on the different fiber surfaces. Static time-of-flight secondary ion mass spectrometry (static-ToF-SIMS) showed the presence of each type of CD on the PS nanofibers by the detection of both the CD sodium adduct molecular ions (Mⴙ Naⴙ) and lower molecular weight oxygen containing fragment ions. The comparative efficiency of the PS/CD nanofibers/nanoweb for removing phenolphthalein, a model organic compound, from solution was determined by UVⴚvis spectrometry, and the kinetics of phenolphthalein capture was shown to follow the trend PS/␣-CD > PS/-CD > PS/␥-CD. Direct pyrolysis mass spectrometry (DP-MS) was also performed to ascertain the relative binding strengths of the phenolphthalein for the CD cavities, and the results showed the trend in the interaction strength was-CD > ␥-CD > ␣-CD. Our results demonstrate that nanofibers produced by electrospinning that incorporate cyclodextrins with different sized cavities can indeed filter organic molecules and can potentially be used for filtration, purification, and/or separation processes.
KEYWORDS:cyclodextrin · electrospinning · polystyrene · nanofiber · molecular filter · nanoweb
In our very recent studies, we have shown that func-tional electrospun nanofibers can be obtained by incorporating cyclodextrins (CDs) and cyclodextrin in-clusion complexes (CD-ICs) into nanofibers by
electrospinning.14,23⫺28In one of these studies, we have shown that electrospun polystyrene (PS) fibers incorpo-rating-CD have the potential to be used as molecu-lar filters.14Here we extend on this work by electro-spinning polystyrene (PS) with three types of CDs ( ␣-CD,-CD, and ␥-CDs) separately, aimed at investigating their relative efficiency at filtering organic molecules from solution. Paramount to the success of the PS/CD nanofibers functioning as molecular filters is the pres-ence of the CD molecules at the fiber surface. We have utilized X-ray photoelectron spectroscopy (XPS) and static time-of-flight secondary ion mass spectrometry (static-ToF-SIMS) to detect the CD molecules in the outer molecular layers of the fiber surfaces. The ability of the PS/CD nanofibers to filter molecules from solu-tion was determined by using phenolphthalein as a
model compound, and the removal from solution was detected using UV⫺vis spectrophotometry. Finally, the relative affinity of the phenolphthalein for the different CD molecules was determined using direct pyrolysis mass spectrometry (DP-MS), and the results indicate that the cavities of the CDs have different binding strengths for phenolphthalein. Thus, electrospun nanofibers functionalized with different CD molecules may have tunable properties that can be exploited to manufacture molecular filters for highly selective and efficient removal of organic molecules from solution. RESULTS AND DISCUSSION
SEM Characterization.The optimization of the electro-spinning conditions for producing bead-free uniform PS fibers incorporating cyclodextrins (PS/-CD) and the bulk chemical characterization of these electrospun PS and PS/-CD fibers was reported elsewhere.26The com-position and the properties of the PS and PS/CD solu-tions and the resulting electrospun fibers are
summa-Figure 1. (a) Chemical structure of␥-CD, (b) 3-D structure of ␥-CD, and (c) approximate dimensions of ␣-CD, -CD, and ␥-CD.20
TABLE 1.Properties of PS and PS/CD Solutions and the Average Fiber Diameter of the Resulting Electrospun Fibers
materials % PS (w/v)a CD type, % (w/w)b viscosity (cP) conductivity (S/cm) fiber diameter range (nm) average fiber diameter (nm)
PS 25 240.4⫾ 1.5 1.1 1690⫺2530 1959⫾ 162
PS/␣-CD 15 ␣-CD,21.3% 66.9⫾ 0.3 2.2 200⫺2280 940⫾ 490
PS/-CD 15 -CD, 25% 60.6⫾ 0.2 3.8 474⫺2840 1350⫾ 480
PS/␥-CD 15 ␥-CD,28.5% 67.9⫾ 0.4 1.7 310⫺1830 967⫾ 380
aWith respect to solvent (DMF).bWith respect to the polymer (PS).
rized in Table 1. The representative scanning electron microscopy (SEM) images of the electrospun PS and PS/CD fibers and the fiber diameter distributions are shown in Figure 2. It was observed that the diameter of the resulting electrospun PS/CD fibers is more or
less close to each other without showing any consider-able differences except the PS/-CD fibers are slightly thicker compared to PS/␣-CD and PS/␥-CD fibers. In the case of PS fibers without CD, the fibers were thicker compared to PS/CD fibers since higher polymer
concen-Figure 2. Representative SEM images of (a) PS, (b) PS/␣-CD, (c) PS/-CD, and (d) PS/␥-CD electrospun fibers. The fiber diam-eter distributions are shown on the right side.
tration was used in order to obtain bead-free fibers.26 In brief, the variations in fiber diameters are due to dif-ferences in conductivity and viscosity of the polymer solutions.26
XPS and ToF-SIMS Characterization.The presence of CD molecules at the surface of the fibers has a large in-fluence on the molecular filtration capability. XPS was used to quantitatively obtain information of the surface composition of the PS/CD nanofibers, and ToF-SIMS was used to provide molecular and spatial distribution information on individual fiber sur-faces. Table 2 shows elemental compositions based on wide energy survey spectra of the surface of PS, pure CDs, and the three different electrospun PS/CD nanoweb samples. The presence of low percent-ages of oxygen on the electrospun PS/CD nanofi-bers thus confirms the localization of the CD within the outer surface layers.
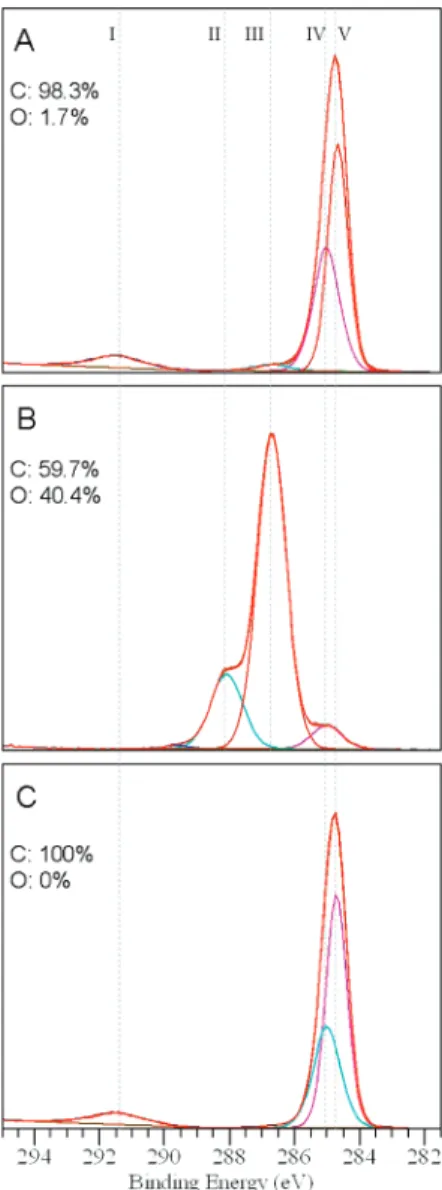
To provide more chemical state information of the surface chemistry, high-resolution C 1s spectra were re-corded for each sample. Figure 3 shows C 1s spectra of PS,␣-CD, and PS/␣-CD. The spectra are identical to those acquired for PS/-CD and PS/␥-CD samples (data not shown). The C 1s spectrum of pure PS (Figure 3C) can be fitted with two peaks at binding energies at 284.7 and 285.0 eV and a smaller peak at 291.4 eV (marked I). The latter is the shakeup satellite arising from¡* transitions in the aromatic rings of the PS molecule. The two components for the main peak are assigned to the aromatic carbon CAC⫺CAC at 284.7 eV (marked V) and the aliphatic carbon at 285.0 eV (marked IV). The spectrum of pure CD (Figure 3B) is fit-ted with three main components: the aliphatic carbon at 285.0 eV (small hydrocarbon contamination marked IV), C⫺O⫺C/C⫺OH at 286.8 eV (marked III), and O⫺C⫺O/CAO at 288.1 eV (marked II). The PS/␣-CD fi-ber surface can be successfully described as a combina-tion of the spectra for the pure materials where the presence of CD is seen as a small shoulder (marked III) on the higher binding energy side of the main, PS car-bon peak (Figure 3A). Thus, it is assumed that the elemental compositions generated from wide energy survey spectra are linear combinations of the elemen-tal compositions of the materials. On the basis of this as-sumption, it is estimated that the approximately 5% of the probed surface consists of CD molecules for all three
different PS/CD samples. A slight increase in surface content (from 4.2 to 5.3%) is observed when going from ␣-CD through -CD to ␥-CD. The increase is correlated with the mass of CD used since samples were prepared from solutions with the same molar concentration of CD, which corresponds to a higher mass content of ␥-CD compared to ␣-CD. On the other hand, the sur-face content of CD for all three PS/CD samples is lower than the CD content of the solutions they were pre-pared from. This indicates that the CD molecules are not homogeneously mixed throughout the fiber ma-trix, and some CD molecules are buried in the bulk of the fibers. CD molecules could phase separate from PS matrix and formed heterogeneous dispersion during solvent evaporation in the electrospinning process. In fact, we prepared film from PS/CD solutions by spin coating and solvent casting method, but CD molecules were phase separated and formed aggregates immedi-ately during the solvent evaporation. This is likely be-cause CD has a hydrophilic characteristic and PS is a hydrophobic polymer.
TABLE 2.Atomic Concentrations Generated from XPS Wide Energy Survey Scans
Sample C/% O/% PS 100 0 ␣-CD 59.6 40.4 -CD 58.7 41.3 ␥-CD 58.4 41.6 PS/␣-CD nanoweb 98.3 1.7 PS/-CD nanowebs 98.0 2.0 PS/␥-CD nanoweb 97.8 2.2
Figure 3. C 1s XPS spectra of (A) PS/␣-CD, (B) ␣-CD, and (C) PS.
ToF-SIMS was used to corroborate the XPS results and to obtain information about the lateral distribu-tion of CD in the outer molecular layer of fibers by chemical imaging. In addition, the probe depth of ToF-SIMS is 1⫺2 nm compared to 10 nm of XPS and thus is more surface-sensitive. Figure 4 shows positive ion ToF-SIMS mass spectra in th m/z range from 900 to 1400 units for each of the three PS/CD fiber samples. The
presence of CD is clearly established by peaks that can be assigned because of the high mass resolution achievable. In this case, the assignments can be attrib-uted to the Na adduct ions of intact molecules of each of the CDs at atomic mass unit values of 995.24, 1157.46, and 1319.51 for␣-CD, -CD, and ␥-CD, respectively.
High spatial resolution chemical imaging was per-formed on the fiber surfaces for PS/CD fiber samples. Since␣-CD, -CD, and ␥-CD are found to have similar fragmentation patterns, the same peaks can be used for imaging of each sample. In order to enhance the chemi-cal contrast of the images, the intensities of a number of fragment ions from either PS or CD are summed (C6H5⫹, C7H7⫹, C9H9⫹, and C15H13⫹for PS; and C2H5O2⫹, C4H5O⫹, and C3H5O2⫹for CD). Thus two separate chemi-cal images are created: one showing the location of PS and one showing CD, on the PS/CD fiber surface. Unfor-tunately, it was not possible to get sufficient contrast for the individual [M⫹ Na]⫹peaks for each CD since the ion intensities were too low at the chosen raster size, which was necessary to see individual fibers and remain below the static limit (below the damage threshold).
Figure 4. Positive ion static-ToF-SIMS spectra from PS/CD fi-ber samples in the mass range of 900ⴚ1400 units showing molecular CD peaks of (A)␣-CD, (B) -CD, and (C) ␥-CD.
Figure 5. ToF-SIMS chemical images of the PS/CD fibers showing PS and CD. (A) PS fragment ion image of PS/␣-CD, (A=) CD fragment ion image of PS/␣-CD. (A==) Overlay of the CD image (A=, green) on the PS image (A, red) visualizing the location of CD on the PS fibers. B, B=, and B== show equivalent images for PS/-CD. C, C=, and C== show equivalent images for PS/␥-CD.
All images are 200ⴛ 200 m2.
Figure 5 shows PS and CD chemical images for the three PS/CD fiber samples. By comparing the CD im-age with the PS imim-age for each sample and overlaying the images, the distribution of CD on the surface of the fibers can be visualized. It is seen that small adjacent re-gions of single fibers that look similar in the PS images appear with different contrasts in the CD images. The uneven distribution of the CD signal suggests that the CD molecules form clusters on the PS fiber surfaces. Fur-thermore, there are larger areas of individual fibers that are clearly enriched in PS but deficient in CD frag-ment ions. This uneven distribution of CD on the fibers is independent of CD type. As discussed previously, CD molecules have a heterogeneous dispersion through-out the PS fiber matrix due to its hydrophilic nature and phase separation from the hydrophobic matrix during the solvent evaporation in the electrospinning process.
The surface analysis results clearly indicate that there is a surface enrichment or segregation of CD mol-ecules on the fibers. This effect has been observed be-fore for electrospun fibers made from blends, where the low molecular weight (MWt) additive is surface-concentrated.29In addition, mixtures of polymer blends of different MWt have been shown to demix at the sur-face where the low MWt weight component enriches the surface due to energetic and entropy effects.30,31In such systems, it is proposed that the lower energy com-ponents migrate to the surface and minimize the sur-face tension, and the process is enhanced when the low MWt component is branched or immiscible with the higher Mwcomponent.30⫺32
It is also noteworthy saying that CDs are physically incorporated in the fiber matrix; the chemical reaction between CD and PS is not expected. In addition, no evi-dence of chemical bonding of CD to PS matrix was ob-served from XPS, ToF-SIMS, and DP-MS analyses. More-over, the inclusion complexation between CD and PS chains is excluded since the cavity of all three CDs ( ␣-CD,-CD, and ␥-CD) is too narrow to encapsulate amor-phous PS chains.33,34So, the physically bounded CD molecules on the fiber surface are empty and available to perform their filtration function by capturing mol-ecules from the surroundings. This is indeed one of the reasons for choosing PS as the fiber matrix because the matrix would not interfere in the complexation of CD with the target molecules to be trapped.
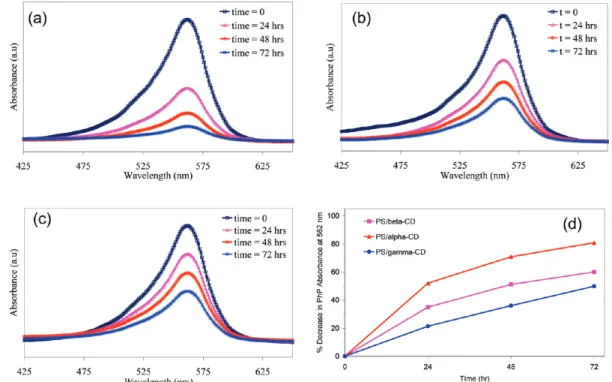
UVⴚVis Measurements: Uptake of Phenolphthalein. The mo-lecular filtration capability of PS/CD fibrous nanowebs was tested using phenolphthalein (Php) solutions as a model system because Php is known to form inclusion complexes with CDs and it is easy to follow its uptake by UV⫺vis measurements.35⫺38The PS/CD fibrous webs were immersed into PhP solution, and the change in ab-sorbance of Php was recorded as a function of time by UV⫺vis spectrophotometry (Figure 6). It was observed that the absorbance of Php solution decreased signifi-cantly over time in the presence of PS/CD nanowebs due to the removal of Php from solution by the com-plexation with the CDs present on the fiber surface. When the CD types were compared (Figure 6a⫺c), the percentage removal of Php with respect to time was on the order of PS/␣-CD ⬎ PS/-CD ⬎ PS/␥-CD. The ToF-SIMS chemical mapping of PS/CD nanowebs shows that
Figure 6. UVⴚvis spectra of phenolphthalein (Php) solution as a function of time after immersion of the nanowebs in (a) PS/␣-CD, (b) PS/-CD, (c) PS/␥-CD. (d) Cumulative % decrease of Php absorbance over time at 562 nm.
␣-CD molecules have a more homogeneous distribu-tion on the nanoweb surface compared to-CD and ␥-CD (Figure 5), and this may lead to the removal of Php more rapidly in the case of PS/␣-CD nanoweb. Figure 6d summarizes the cumulative % decrease of Php
ab-sorbance over time. All three PS/CD nanowebs demon-strate the ability to function as a molecular filter through complexation of the Php molecules with the CD molecules. In our previous study, we have shown that the electrospun PS nanowebs without having CDs
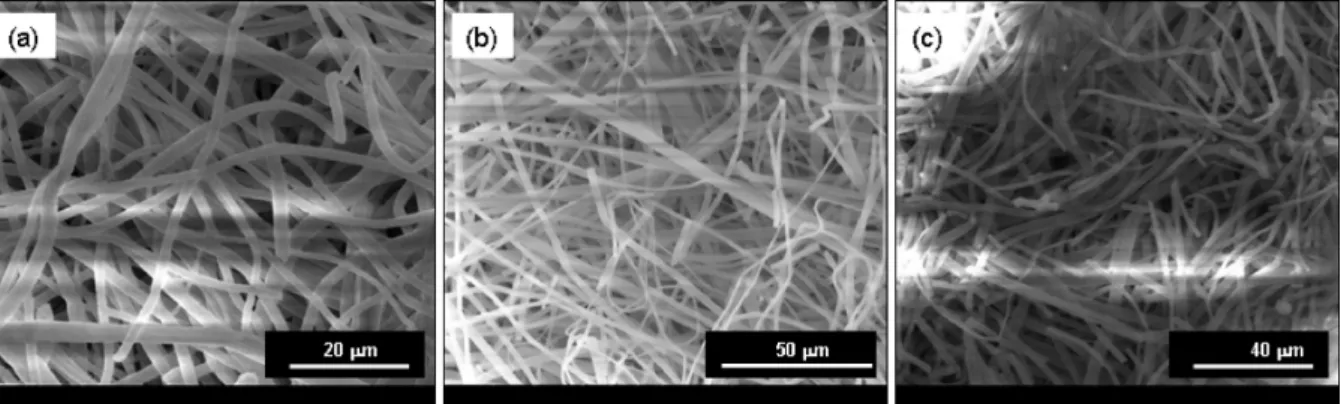
Figure 7. Representative SEM images of (a) PS/␣-CD, (b) PS/-CD, and (c) PS/␥-CD nanowebs after 3 days of immersion in phenol-phthalein (Php) solution.
Figure 8. DP-MS evolution profiles of PS-based product; monomer (m/zⴝ 104 Da), CD-based product; C2H4O2(m/zⴝ 60
Da) and phenolphthalein (Php) (m/zⴝ 318 Da), detected during the pyrolysis of (a) pure phenolphthalein, (b) PS/␣-CD, (c) PS/
-CD, (d) PS/␥-CD. (Note: The fibers were analyzed after the exposure to PhP solution at the end of the UVⴚvis
experiments.)
were ineffective at trapping the Php from the solu-tion.14On the other hand, for the PS/CD nanowebs, the trapping of the Php was very significant, suggest-ing that these electrospun nanowebs would be very ef-fective for filtering the molecules from the solutions. We have also examined the dimension stability of these PS/CD nanowebs, and we observed that the nanowebs kept their fibrous structure after the filtration process (Figure 7).
Direct Pyrolysis Mass Spectrometry.Direct pyrolysis mass spectrometry (DP-MS) studies were performed on the PS/CD nanowebs exposed to phenolphthalein (Php) so-lution to confirm the complexation of CDs with Php molecules. The thermal evaporation of the guest mol-ecules shifts to higher temperatures due to the interac-tions with the CD cavity, thus, DP-MS is a useful tech-nique to characterize the CD host⫺guest inclusion complexes.39In general, for a multicomponent system, DP-MS allows separation of components as a function of their volatilities and/or thermal stabilities.40⫺42Thus, in pyrolysis MS analysis, not only the detection of a peak but also the variation of its intensity as a function of temperature and the evolution profile is important.39⫺42
In Figure 8, evolution profiles of PS-, CD-, and phenolphthalein (Php)-based products, namely, the sty-rene monomer (m/z⫽ 104 Da) of PS, C2H4O2(m/z⫽ 60) for␣-CD, -CD, and ␥-CD, and Php (molecular peak at m/z⫽ 318 Da) recorded during the DP-MS analyses are given. For all of the samples, PS- and CD-based products showed identical behaviors with those of the corresponding pure forms (Figure 8). On the other hand, the trends observed in the evolution profiles of Php-based products showed noticeable differences for PS/CD samples. For the PS/␣-CD, the evolution profile of Php was almost identical to that of the pure Php with a maximum at 260 °C, except the presence of a second and a weak peak at around 350 °C (Figure 8b). In the case of the sample containing-CD, two peaks with maxima at around 295 and 350 °C, the first being weaker, were observed (Figure 8c). For the sample con-taining␥-CD, a broad peak with a maximum at around 295 °C and a shoulder at around 350 °C were recorded (Figure 8d). It is clear that the weakest interaction was the one between Php and␣-CD; for this sample, the
evolution of most of the Php occurred independently as in case of the pure form. On the other hand, for both of the samples involving-CD or ␥-CD, the evolution of Php shifted to higher temperatures and the trends in the evolution profiles indicated the presence of two different environment/interactions of Php with CD cavi-ties. When the trends in the evolution profiles are com-pared, it can be concluded that the interaction be-tween Php molecule and CD cavity is on the order␣-CD ⬍ ␥-CD ⬍ -CD, indicating that the size of the CD cav-ity and the size of the host molecule were critical for the strength of an inclusion complex.21,22This finding sug-gests that the binding between the CD cavity and the phenolphthalein is the strongest for-CD, and the rea-son for that is the proper size/shape match between -CD and phenolphthalein, which correlates with the literature findings.35⫺37
CONCLUSION
A comparative study has been carried out on the molecular filtration capabilities of electrospun polysty-rene nanofibers functionalized with␣-CD, -CD, and ␥-CD molecules. The capability of the PS/CD nanofibers/ nanowebs to filter molecules from solution was deter-mined by using phenolphthalein as a model com-pound. Chemical surface analysis using XPS and static-ToF-SIMS demonstrated that the CD molecules were present at the surface of the PS fibers. The relative bind-ing strengths of the different CDs for phenolphthalein within the PS fiber matrix were determined using direct pyrolysis mass spectrometry (DP-MS). The results indi-cate that there is a trend depending on the CD cavity size, and the strength of interaction between phenol-phthalein and the CD cavity is on the order of␣-CD ⬍ ␥-CD ⬍ -CD. Such information is invaluable for design-ing cyclodextrin functionalized electrospun nanowebs where the properties of the fiber surfaces and inclusion complex formation are crucial for optimizing the effi-ciency of the filtration performance. In conclusion, our findings are very promising and show the potential ap-plication for cyclodextrin containing electrospun nanofibers/nanowebs to be used as molecular filters for removal of organic molecules from solutions.
METHODS
Materials.Polystyrene (PS) (Mw⬃ 280 000), N,N-dimethylformamide (DMF) (99%), phenolphthalein (ACS re-agent), and ethanol (absolute, HPLC grade,ⱖ99.8%) were pur-chased from Sigma-Aldrich. The␣-, -, and ␥-cyclodextrins (␣-CD,-CD, and ␥-CD) were obtained from Wacker Chemie AG (Germany). The materials were used as received.
Electrospinning.PS/CD solutions were prepared by dissolv-ing PS and CDs (␣-CD, -CD, and ␥-CD) in DMF. The poly-mer concentration was 15% w/v (with respect to solvent), and the CD content was 21.3, 25, and 28.5% (w/w) (with re-spect to polymer) for␣-CD, -CD, and ␥-CD, respectively. Dif-ferent weight ratios were used for CDs in order to keep the
molar ratio the same in the polymer matrix. In the case of PS without CD, 25% w/v polymer solution was used in order to get bead-free uniform fibers. The PS and PS/CD solutions were placed in a syringe fitted with a metallic needle (0.4 mm in-ner diameter). The syringe was fixed horizontally on the syringe pump (model KDS 101, KD Scientific), and the high voltage power supply (Spellman, MP Series) was used. The applied elec-trospinning parameters were as follows: applied voltage⫽ 15 kV, feed rate⫽ 1 mL/h, and tip-to-collector distance ⫽ 10 cm. A grounded stationary rectangular metal collector plate covered by a piece of aluminum foil was used for the fiber deposition. The collected fibers were dried at 40 °C under vacuum oven for 24 h to remove the residual solvent if present.
Characterization.The viscosity of the solutions was measured at 24 °C using the Brookfield DV-III Ultra rheometer, which is equipped with a cone/plate accessory of spindle type CPE-41. The viscosity measurements were repeated three times to check the reproducibility and the consistency of the viscosity reading. The conductivity of the solutions was measured with multipa-rameter meter InoLabMulti 720 (WTW) at room temperature.
The morphologies of the cyclodextrin functionalized electro-spun polystyrene (PS/CD) fibers were investigated by scanning electron microscopy (SEM) (FEI, Nova 600 NanoSEM and Quanta 200 FEG). The fiber diameter distribution was determined from the SEM images, and around 100 fibers were analyzed.
X-ray photoelectron spectroscopy (XPS) measurements were carried out using a Kratos Axis UltraDLD. Samples for XPS were prepared by electrospinning a covering mat of fibers onto Al foil, and the samples were analyzed on the foil. A monochromated Al K␣ X-ray source was used (h ⫽ 1486.6 eV) and operated at 10 mA and 15 kV. A hybrid lens mode was employed during analy-sis (electrostatic and magnetic), with an analyanaly-sis area of approxi-mately 300m ⫻ 700 m. The analysis takeoff angle (TOA) was 0° (with respect to the Al foil surface), allowing a maximum probe depth (10 nm). Wide energy survey scans were obtained over the range of 0⫺1200 eV binding energy (BE) at a pass energy of 160 eV and used to determine the surface elemental composi-tion. High-resolution spectra were recorded for carbon 1s at a de-tector pass energy of 20 eV. The Kratos charge neutralizer sys-tem was used on all samples with a filament current between 1.8 and 2.1 A and a charge balance of 3.6 V.
ToF-SIMS was performed using an ION-TOF TOF.SIMS V in-strument equipped with a Bi primary ion cluster source operat-ing at 25 kV. Bi32⫹primary ions were used during analysis using the high current bunched mode for maximum mass resolution. Samples for ToF-SIMS were prepared by electrospinning a few layers of fibers directly onto pieces of Si wafers. Chemical imag-ing was performed with the burst alignment mode, which offers a high spatial resolution but low mass resolution. Chemical im-aging over an area of 200⫻ 200 m2was based only on peaks unambiguously identified in previous high mass resolution mea-surements.14A low energy electron flood gun was used for charge compensation, and the primary ion dose was kept be-low 1012ions/cm2to stay below the static limit.
The molecular filtration capability of the PS/CD electrospun fibrous nanowebs was tested by using phenolphthalein (Php) as a model organic molecule. The uptake of Php by PS/CD nanowebs was determined by measuring the reductions in ab-sorbance from solution using UV⫺vis spectrophotometry (Helios-). In brief, 4 ⫻ 10⫺4M of Php solution was prepared in absolute ethanol, and the pH of the solution was adjusted to pH 11 by addition of buffer solution. About 16 mg of PS/CD fibers was placed separately in the bottom of the UV⫺vis cuvettes filled with purple color Php solution. The UV cuvettes were cov-ered tightly with a Teflon lid to prevent the evaporation of solu-tion, and they were not disturbed for 3 days. The absorbance spectra of Php solution were recorded initially (time⫽ 0, right af-ter dipping the fibers in the cuvette) and afaf-ter every 24 h. The PS/ -CD nanoweb was also tested for 6 days, and it was observed that the decrease in PhP absorption was about the same after 3 days and after 6 days, indicating that the saturation point was reached after approximately 3 days; therefore, the immersion ex-periments were stopped at the end of 3 days. After 3 days, the fibrous mats were removed, rinsed with ethanol and water to re-move physically adsorbed Php molecules, and then analyzed by direct pyrolysis mass spectrometry (DP-MS). The pH of the solu-tions was also measured before and after the UV⫺vis experi-ments, and it was observed that the pH of the solution was un-changed at the end of UV⫺vis experiments.
The DP-MS system consists of Waters Quattro Micro GC tan-dem MS with an EI ion source and a mass range of 10⫺1500 Da coupled with a direct insertion probe (Tmax⫽ 650 °C); 0.01 mg of each fiber sample was pyrolyzed in flared quartz sample vials. The temperature was increased at a rate of 10 °C/min, and the scan rate was 1 scans/s, with simultaneous mass spectrometric analysis of the pyrolytic fragments.
Acknowledgment. We gratefully acknowledge the funding to the current project NanoNonwovens from The Danish Advanced Technology Foundation, the collaboration with Fibertex A/S, and the Danish Research Agency for the funding to the iNANO Center. State Planning Organization of Turkey (DPT) is acknowl-edged for the support of UNAM-Institute of Materials Science and Nanotechnology through the National Nanotechnology Re-search Center Project. We thank to Y. Nur for the help in perform-ing the DP-MS experiments. We also acknowledge Prof. K. L. Larsen from Aalborg University for his useful discussions. REFERENCES AND NOTES
1. Greiner, A.; Wendorff, J. H. Electrospinning: A Fascinating Method for the Preparation of Ultrathin Fibers. Angew. Chem., Int. Ed. 2007, 46, 5670–5703.
2. Li, D.; Xia, Y. N. Electrospinning of Nanofibers: Reinventing the Wheel. Adv. Mater. 2004, 16, 1151–1170.
3. Lu, X.; Wang, C.; Wei, Y. One-Dimensional Composite Nanomaterials: Synthesis by Electrospinning and Their Applications. Small 2009, 5, 2349–2370.
4. He, D.; Hu, B.; Yao, Q.-F.; Wang, K.; Yu, S.-H. Large-Scale Synthesis of Flexible Free-Standing SERS Substrates with High Sensitivity: Electrospun PVA Nanofibers Embedded with Controlled Alignment of Silver Nanoparticles. ACS Nano 2009, 3, 3993–4002.
5. Barhate, R. S.; Ramakrishna, S. Nanofibrous Filtering Media: Filtration Problems and Solutions from Tiny Materials. J. Membr. Sci. 2007, 296, 1–8.
6. Barhate, R. S.; Loong, C. K.; Ramakrishna, S. Preparation and Characterization of Nanofibrous Filtering Media. J. Membr. Sci. 2006, 283, 209–218.
7. Bjorge, D.; Daels, N.; De Vrieze, S.; Dejans, P.; Van Camp, T.; Audenaert, W.; Hogie, J.; Westbroek, P.; Clerck, K. D.; Hulle, S. W. H. V. Performance Assessment of Electrospun Nanofibers for Filter Applications. Desalination 2009, 249, 942–948.
8. Ramakrishna, S.; Fujihara, K.; Teo, W. E.; Yong, T.; Ma, Z.; Ramaseshan, R. Electrospun Nanofibers: Solving Global Issues. Mater. Today 2006, 9, 40–50.
9. Szejtli, J. Cyclodextrins in the Textile Industry. Starch/Staerke 2003, 55, 191–196.
10. Crini, G.; Morcellet, M. Synthesis and Applications of Adsorbents Containing Cyclodextrins. J. Sep. Sci. 2002, 25, 789–813.
11. Aoki, N.; Nishikawa, M. Synthesis of Chitosan Derivatives Bearing Cyclodextrin and Adsorption of p-Nonylphenol and Bisphenol A. Carbohydr. Polym. 2003, 52, 219–223. 12. Olah, J.; Cserhati, T.; Szejtli, J.-Cyclodextrin Enhanced
Biological Detoxification of Industrial Waste Waters. Water Res. 1988, 22, 1345–1351.
13. Uyar, T.; Hunt, M. A.; Gracz, H. S.; Tonelli, A. E. Crystalline Cyclodextrin Inclusion Compounds Formed with Aromatic Guests: Guest-Dependent Stoichiometries and
Hydration-Sensitive Crystal Structures. Cryst. Growth Des.
2006, 6, 1113–1119.
14. Uyar, T.; Havelund, R.; Nur, Y.; Hacaloglu, J.; Besenbacher, F.; Kingshott, P. Molecular Filters Based on Cyclodextrin Functionalized Electrospun Fibers. J. Membr. Sci. 2009, 332, 129–137.
15. Kaur, S.; Kotaki, M.; Ma, Z.; Gopal, R.; Ramakrishna, S. Oligosaccharide Functionalized Nanofibrous Membrane. Int. J. Nanosci. 2006, 5, 1–11.
16. Szejtli, J. Introduction and General Overview of Cyclodextrin Chemistry. Chem. Rev. 1998, 98, 1743–1753. 17. Hedges, A. R. Industrial Applications of Cyclodextrins.
Chem. Rev. 1998, 98, 2035–2044.
18. Wenz, G.; Han, B.-H.; Muller, A. Cyclodextrin Rotaxanes and Polyrotaxanes. Chem. Rev. 2006, 106, 782–817.
19. Del Valle, E. M. M. Cyclodextrins and Their Uses: A Review. Process Biochem. 2004, 39, 1033–1046.
20. Saenger, W.; Jacob, J.; Gessler, K.; Steiner, T.; Hoffmann, D.; Sanbe, H.; Koizumi, K.; Smith, S. M.; Takaha, T. Structures of the Common Cyclodextrins and Their Larger AnaloguesOBeyond the Doughnut. Chem. Rev. 1998, 98, 1787–1802.
21. Connors, K. A. The Stability of Cyclodextrin Complexes in Solution. Chem. Rev. 1997, 97, 1325–1357.
22. Rekharsky, M. V.; Inoue, Y. Complexation Thermodynamics of Cyclodextrins. Chem. Rev. 1998, 98, 1875–1917. 23. Uyar, T.; Kingshott, P.; Besenbacher, F. Electrospinning of
Cyclodextrin⫺Pseudopolyrotaxane Nanofibers. Angew. Chem., Int. Ed. 2008, 47, 9108–9111.
24. Uyar, T.; Balan, A.; Toppare, L.; Besenbacher, F. Electrospinning of Cyclodextrin Functionalized Poly(methyl methacrylate) (PMMA) Nanofibers. Polymer
2008, 50, 475–480.
25. Uyar, T.; Besenbacher, F. Electrospinning of Cyclodextrin Functionalized Polyethylene Oxide (PEO) Nanofibers. Eur. Polym. J. 2009, 45, 1032–1037.
26. Uyar, T.; Havelund, R.; Hacaloglu, J.; Zhou, X.; Besenbacher, F.; Kingshott, P. Formation and Characterization of Cyclodextrin Functionalized Polystyrene Nanofibers Produced by Electrospinning. Nanotechnology 2009, 20, 125605–125618.
27. Uyar, T.; Hacaloglu, J.; Besenbacher, F. Electrospun Polystyrene Fibers Containing High Temperature Stable Volatile Fragrance/Flavor Facilitated by Cyclodextrin Inclusion Complexes. React. Funct. Polym. 2009, 69, 145–150.
28. Uyar, T.; Nur, Y.; Hacaloglu, J.; Besenbacher, F.
Electrospinning of Functional Poly(methyl methacrylate) (PMMA) Nanofibers Containing Cyclodextrin⫺Menthol Inclusion Complexes. Nanotechnology 2009, 20, 125703– 125712.
29. Hunley, M. T.; Harber, A.; Orlicki, J. A.; Rawlett, A. M.; Long, T. E. Effect of Hyperbranched Surface-Migrating Additives on the Electrospinning Behavior of Poly(methyl methacrylate). Langmuir 2008, 24, 654–657.
30. Walton, D. G.; Soo, P. P.; Mayes, A. M.; Sofia Allgor, S. J.; Fujii, J. T.; Griffith, L. G.; Ankner, J. F.; Kaiser, H.; Johansson, J.; Smith, G. D.; Barker, J. G.; Satija, S. K. Creation of Stable Poly(ethylene oxide) Surfaces on Poly(methyl
methacrylate) Using Blends of Branched and Linear Polymers. Macromolecules 1997, 30, 6947–6956. 31. Hariharan, A.; Kumar, S. K.; Russell, T. P. A Lattice Model for
the Surface Segregation of Polymer Chains Due to Molecular Weight Effects. Macromolecules 1990, 23, 3584– 3592.
32. Walton, D. G.; Mayes, A. M. Entropically Driven Segregation in Blends of Branched and Linear Polymers. Phys. Rev. E
1996, 54, 2811–2815.
33. Hunt, M. A.; Jung, D.-W.; Shamsheer, M.; Uyar, T.; Tonelli, A. E. Polystyrenes in Channels. Polymer 2004, 45, 1345–1347.
34. Uyar, T.; Gracz, H. S.; Rusa, M.; Shin, I. D.; El-Shafei, A.; Tonelli, A. E. Polymerization of Styrene in␥-Cyclodextrin Channels: Lightly Rotaxanated Polystyrenes with Altered Stereosequences. Polymer 2006, 47, 6948–6955. 35. Taguchi, K. Transient Binding of Phenolphthalein-
-Cyclodextrin Complex: An Example of Induced
Geometrical Distortion. J. Am. Chem. Soc. 1986, 108, 2705– 2709.
36. Buva´ri, A´ .; Barcza, L.; Kajta´r, M. J. Complex Formation of Phenolphthalein and Some Related Compounds with -Cyclodextrin. J. Chem. Soc., Perkin Trans. 2 1988, 168, 7–1690.
37. Meier, M. M.; Bordignon Luiz, M. T.; Farmer, P. J.; Szpoganicz, B. The Influence of- and ␥-Cyclodextrin Cavity Size on the Association Constant with Decanoate and Octanoate Anions. J. Inclusion Phenom. 2001, 40, 291– 295.
38. Mohamed, M. H.; Wilson, L. D.; Headley, J. V. Estimation of the Surface Accessible Inclusion Sites of-Cyclodextrin Based Copolymer Materials. Carbohydr. Polym. 2010, 80, 186–196.
39. Uyar, T.; El-Shafei, A.; Wang, X.; Hacaloglu, J.; Tonelli, A. E. The Solid Channel Structure Inclusion Complex Formed between Guest Styrene and Host␥-Cyclodextrin. J. Incl. Phenom. Macrocycl. Chem. 2006, 55, 109–121.
40. Uyar, T.; Tonelli, A. E.; Hacaloglu, J. Thermal Degradation of Polycarbonate, Poly(vinyl acetate) and Their Blends. Polym. Degrad. Stab. 2006, 91, 2960–2967.
41. Uyar, T.; Rusa, C. C.; Tonelli, A. E.; Hacaloglu, J. Pyrolysis Mass Spectrometry Analysis of Polycarbonate/Poly(methyl methacrylate)/Poly(vinyl acetate) Ternary Blends. Polym. Degrad. Stab. 2007, 92, 32–43.
42. Uyar, T.; Toppare, L.; Hacaloglu, J. Thermal and Structural Characterization of Polypyrrole by Direct-Insertion Probe Pyrolysis Mass Spectrometry. Synth. Met. 2001, 119, 307–308.