[Ital J Anim Sci vol.13:2014] [page 151]
Determination of outlier
in live-weight performance
data of Japanese quails
(Coturnix coturnix japonica)
by Dfbeta and Dfbetas
techniques
Burhan Bahadir,1Hakan İnci,1
Ufuk Karadavut2 1
Zootekni Bölümü, Bingöl Üniversitesi, Turkey
2Zootekni Bölümü, Ahi Evran
Üniversitesi, Kırsehır, Turkey
Abstract
This study aimed to determine the outlier values in live-weight performance data of Japanese quails. Japanese quails were grown under the same conditions, and, after being divided according to gender, the live weight data of quails up to 56 days of age (7 weeks) was collected. For both male and females, mea-surements on 50 animals were done, and these values were measured over. For each week measurement, values were separately determi-ned. In order to determine the outlier values in each measurement, DFBETA and DFBETAS cri-teria were used. In males, females, and in all the flock a high number of outlier values was found. However, more outliers were observed especially in females. Under the same conditi-ons, in spite of the training, the potential envi-ronmental effects of the variability in females was originated to react more quickly than in males.
Introduction
In the past, the problem of outliers basically was a subjective matter inquiring which obser-vation(s) are possible outliers. Nowadays, owign to developments in computer technolo-gy, it has turned into a matter defining the algorithms to diagnose the observations or observation groups not complying with the general pattern of the relevant data in regres-sion analysis and multi-dimenregres-sional datasets. Scientific data generally show normal distribu-tion and most of the statistical analysis meth-ods were developed over the assumption that relevant data has normal distribution.
Therefore, before prospective analyses, data should be subjected to normality tests (Bek and Efe, 1987; Akdeniz, 1998). Evaluation of numerical data obtained after comprehensive scientific work often reveals that one or more of the observations are away from the others. Such observations are called as extreme, irreg-ular, discordant, suspicious observation, sur-prise, dirty, contaminated, deviate values (out-liers), etc. (Çil, 1990; Billor et al., 2000).
Non-normal distribution of datasets, expect-ed to be normally distributexpect-ed, is mostly due to the existence of outliers. In the present study, the methods used to detect outliers will be investigated. Outliers are defined as the obser-vations far away from the mean values of the dataset. Such values may either be only one or more. These values increase the standard devi-ation of data, change the pattern of distribu-tion and consequently may lead to data misin-terpretations during the statistical analyses (Alpar, 1997). Outliers may be observed because of a recording error, a disruption in production processes, human errors, or may be formed differently from the large portion of the data. They may cause wrong model formations, wrong parameter estimations or erroneous analysis results (Liu et al., 2004).
There are several statistical methods to identify or test whether an observation away from the average is an outlier. Among these methods, some are able to detect only one observation while others are able to detect more than one observation as statistically out-liers. Some questions reagarding outliers arise: is the detected observation really an out-lier? Should the outlier observation be omitted from the dataset? Should it be evaluated sepa-rately from the dataset? What are the reasons for it to differ from the general dataset? Is this a natural difference? All these questions should be identified and answered by the researchers and it is impossible to get a dis-tinct judgment because of the subjective nature of the outliers.
Goals of the present study are to use the data observed for quails by DFBETA and DFBE-TAS methods.
Materials and methods
Experiments were carried out at quail areas of the Poultry Units, Animal Science
Departments, Bingol and Ahi Evran
Universities, Bıngol and Kırsehır, Turkey. Japanese quails (Coturnix coturnix japonica) were used in the experiments. Live weights were measured twice a week from the
hatch-ing until the 10th week of age with a digital scale (±0.01 g). A total of 100 quails (except for initial weight) were used and on each of them 20 measurements were performed. All the measurements were recorded separately. Experiments were carried out in two groups with 5 replications (each replication had 10 quails, i.e., measurements were performed over 50 quails of each group. Experiments were performed in a cage poultry house. Quail grower feed [starter feed containing 23% crude protein (CP) and 3100 kcal/kg metaboli-zable energy (ME) during the 1st
week and grower feed containing 20% CP and 3250 kcal/kg ME during the following 10 weeks] for 0-10 weeks was used and ad libitum feeding was provided (Table 1). Nutrient composition of the feed ratios was prepared in accordance with the National Research Council (1994). A total of 100 quails (of which 50 males and 50 females) was selected among simultaneously hatched 150 quails after the 4th
week of hatch-ing and whatch-ing numbers were installed to chicks after hatching. All these live-weight measure-ments were used to detect possible outliers. Measurements were evaluated by considering male, female and flock total live weights.
In this study, live-weight data was used to determinate outliers by using DFBETA and
Corresponding author: Prof. Hakan İnci, Zootekni Bölümü, Bingöl Üniversitesi, Selahaddin-i Eyyubi Mh. Aydınlık Cd. 1, 12000 Bingöl, Turkey.
Tel. +90.426.216001215 - Fax: +90.426.2151016. E-mail: [email protected]
Key words: Quail, Live weight, Outlier values, DFBETA, DFBETAS.
Acknowledgments: this manuscript summarises part of the Master’s Degree unpublished Thesis Determination of live weight determination of the performance of outlier data in Japanese quails (Coturnix coturnix japonica). Thesis authors are: Burhan Bahadır (Master of Science Student); Hakan İnci-(Supervisor Assistant Professor); Ufuk Karadavut (Co-Supervisor Associate Professor).
Received for publication: 18 September 2013. Accepted for publication: 12 December 2013. This work is licensed under a Creative Commons Attribution NonCommercial 3.0 License (CC BY-NC 3.0).
©Copyright B. Bahadir et al., 2014 Licensee PAGEPress, Italy
Italian Journal of Animal Science 2014; 13:3113 doi:10.4081/ijas.2014.3113
Italian Journal of Animal Science 2014; volume 13:3113
PAPER
Non-commercial
[page 152] [Ital J Anim Sci vol.13:2014] DFBETAS methods (SPSS 16 V package
prog-ramme was used for determination of outlier values). All throughout the study, measure-ments were recorded by humans.
DFBETA is used to calculate the changes to be observed in parameters of new regression equation formed after omitting ith
observation from the dataset. DFBETA is expressed by the following equation (Belsley et al., 1980):
where, X is the explanatory variable matrix, r the residual vector, i h the ithdiagonal member
of line matrix, and i x the ith
line of matrix X. While the value with higher DFBETA is an indi-cator of an outlier, DFBETA values calculated from the observations proportionally decrease with increasing number of observations.
DFBETAS it is a statistics method named after the difference in estimated regression coefficients and indicates the change in the jth estimated regression coefficient only by omit-ting the ith
observation (Belsley et al., 1980). DFBETAS statistics is calculated by the follow-ing equation:
where, is the jth
estimated regression coef-ficient by omitting the ith observation and (j+1)th
diagonal member of (X’ X)–1
matrix of the regression model including the Cjj,b0
coef-ficient. The value with higher DFBETAS is
expressed as an outlier. A higher DFBETAS value indicates the impact of the ith
observation on the jth
parameter. DFBETAS values decrease proportionally to n, with n being the number of observations (observations with DFBETAS n
ij>2/ or DFBETAi>2/n are expressed as outlier
observations). Outliers were determined by standart deviation above 2. Analyses were done by MINITAB V14 statistical programmes. During the investigation for outlier values, genders were separately evaluated, later combined with total flock values. The aim was to find out whether there is any variation between the gen-ders in outlier values.
Results and discussion
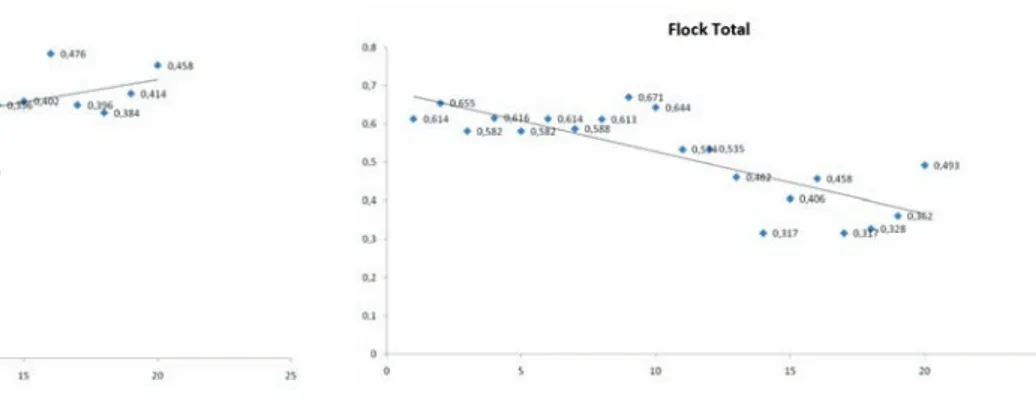
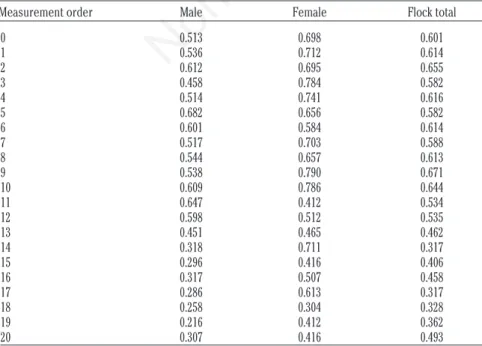
The possible detection of outliers depends on several factors, including development in computer processors, number of observations, data contamination, type of contamination and algorithm parameters (Woodruff and Rocke, 1993, 1994). In the present research, three dif-ferent evaluations were performed: males, females and flock averages. Therefore, results were presented in three groups. The data obtained by DFBETA and DFBETAS methods are provided in Tables 2 and 3. Outlier graphs of DFBETA and DFBETAS are presented in Figures 1 and 2.
Although DFBETA seems to be well masking
Bahadir et al.
Table 1. Composition of quail feeds used in the experiments.
Starter feed Grower feed Ingredients, % Corn 48.0 56.0 Wheat 6.0 6.0 Soybean meal 33.0 24.50 Vegetative oil 4.0 4.5 Fish meal 4.0 4.0 Meat-bone meal 2.5 2.5 DCP 0.5 0.5 Limestone 1.0 1.0 Methionine 0.2 0.2 Lysine 0.1 0.1 Salt 0.4 0.4 Vit+min premix 0.3 0.3 Calculated values CP, % 23 20 Metabolic energy, kcal/kg 3100 3250
DCP, dicalcium phosphate; CP, crude protein.
Figure 1. Graph of outliers obtained by DFBETA for flock total. Figure 2. Graph of outliers obtained by DFBETAS for flock total.
Non-commercial
[Ital J Anim Sci vol.13:2014] [page 153]
in some configurations, it explained much more clean observation as outliers. On the other hand, DFBETAS can be defined as suc-cessful against small contamination along direction. Such changes can clearly be seen in Tables 2 and 3. Especially with regard to mean values, variations were observed among male,
female and flock means. The mean values by DFBETA were observed as 0.3359, 0.4323 and 0.3689, respectively for males, females and flock means. The mean values by DFBETAS, on the other hand, were observed as 0.4652, 0.5938 and 0.5195.
In general, the results obtained by DFBETA
were not found to be as successful as the results obtained by DFBETAS. DFBETA detect-ed less outliers. With regard to males, the value was 0.3359 for DFBETA and 0.4652 for DFBETAS. For females, the value was 0.4323 for DFBETA and 0.5938 for DFBETAS. Again, DFBETA values were lower than DFBETAS val-ues. With regard to flock means, the value was 0.3689 for DFBETA and 0.5195 for DFBETAS, this case being again similar to the others. On the other hand, more efficient algorithms (Billor et al., 2000, 2007), not requiring to include the entire sub-datasets, may yield bet-ter results with the simulations than the other methods. Since the entire possible sub-sets are not searched through, they may be unsuc-cessful in detecting outliers of some cases. Thus, the problem here is initially a technolog-ical one. In large samplings and large dimen-sions (multiple regression), the high-speed processes able to pull all the possible sub-sets and analyse them separately may overcome such a problem. Yet, this is not sufficient to solve the technical dimension of outlier detec-tion. In such cases, the question will remain as a subjective problem. In large samplings, val-ues can reveal deviation from mean. This is a misinterpretation (Alpar, 1997), and if there is a misinterpretation, outliers will not be deter-mined (Liu et al., 2004).
The outliers obtained by DFBETA can be expressed as follows: there were no outliers detected for males. The 13th
observation was detected as outlier for females and the 11th observation was detected as an outlier for flock mean.
The outliers obtained by DFBETAS can be expressed as follows: the 5th
, 18th
and 19th observations were detected as outliers for males; the 18thobservation was detected as an outlier for females and 14th
and 17th observa-tions were detected as outliers for flock mean.
Conclusions
Outlier observations have been the subject matter of various researches for years. Initially, outliers have been tried to be detected among single-dimension data, then the detec-tion levels moved up to multi-dimensional data and computers together with efficient algo-rithms have made the detections of such out-liers easier. The methods developed to detect only a single observation may yield reliable results for datasets with more than one outlier only if they were applied for the entire sub-datasets. However, such brute-force approach-es working like Gentleman and Wilk (1975)
Outlier values in Japanese quails
Table 3. Values obtained by DFBETAS for males, females and flock totals. Measurement order Male Female Flock total
0 0.513 0.698 0.601 1 0.536 0.712 0.614 2 0.612 0.695 0.655 3 0.458 0.784 0.582 4 0.514 0.741 0.616 5 0.682 0.656 0.582 6 0.601 0.584 0.614 7 0.517 0.703 0.588 8 0.544 0.657 0.613 9 0.538 0.790 0.671 10 0.609 0.786 0.644 11 0.647 0.412 0.534 12 0.598 0.512 0.535 13 0.451 0.465 0.462 14 0.318 0.711 0.317 15 0.296 0.416 0.406 16 0.317 0.507 0.458 17 0.286 0.613 0.317 18 0.258 0.304 0.328 19 0.216 0.412 0.362 20 0.307 0.416 0.493
Fifty animals were weighed 20 times for each measurement. The average of measurements is obtained from all the animals.
Table 2. Values obtained by DFBETA for males, females and flock totals. Measurement order Male Female Flock total
0 0.304 0.310 0.306 1 0.314 0.319 0.312 2 0.321 0.421 0.296 3 0.298 0.398 0.305 4 0.286 0.418 0.344 5 0.301 0.471 0.315 6 0.375 0.308 0.358 7 0.345 0.355 0.304 8 0.312 0.392 0.371 9 0.351 0.465 0.366 10 0.327 0.408 0.335 11 0.296 0.506 0.402 12 0.315 0.471 0.455 13 0.344 0.518 0.290 14 0.386 0.415 0.396 15 0.412 0.470 0.402 16 0.395 0.396 0.476 17 0.351 0.405 0.396 18 0.296 0.508 0.384 19 0.288 0.496 0.414 20 0.405 0.507 0.458
Fifty animals were weighed 20 times for each measurement. The average of measurements is obtained from all the animals.
Non-commercial
[page 154] [Ital J Anim Sci vol.13:2014] algorithm are not able to work out with large
data masses with increasing number of obser-vations.
The observations somehow detected as out-liers should not be detected just to omit them and start the analysis over the clean data. Sometimes, outliers with their deviations may provide significant information and in some cases they may be a separate research subject matter instead of the remaining portion of the data. On the other hand, while deciding the outlying of an observation, type of analysis should also be taken into consideration. An observation, seeming to be an outlier in multi-variable datasets, may not be an outlier in regression analysis. Therefore, outlying does not necessarily mean just an absolute devia-tion from the general data. With regard to out-lier detection, DFBETAS yielded more outout-liers than DFBETA. A decision should be made between two methods based on the sensitivity of the research work. If a researcher wishes to improve the sensitivity of the works, DFBETAS may be recommended, otherwise DFBETA may be used. By the study outlier values of each gender were estimated then total flock values were estimated. Results revealed that outlier
values differed between genders. Hence, this differences should be taken into account before planning such measurement and gen-ders should be measured separately.
References
Akdeniz, F., 1998. Olasılık ve istatistik. Akademik Kitaplar Publ., Adana, Turkey. Alpar, R., 1997. Uygulamalı çok değiskenli
ista-tistiksel yöntemlere giris I. Nobel Publ., Ankara, Turkey.
Bek, Y., Efe, E., 1987. Arastırma deneme metot-ları 1. Çukurova Üniversitesi ed., Adana, Turkey.
Belsley, D., Kuh, A., Welsch, E., 1980. Regression diagnostics: identifying influ-ential data and sources of collinearity. John Wiley & Sons, New York, NY, USA. Billor, N., Chatterjee, S., Hadi, A.S., 2007. A
re-weighted least squares method for robust regression estimation. Am. J. Math.-S. 26:229-252.
Billor, N., Hadi, A., Velleman, S., 2000. BACON: blocked adaptive computationally efficient
outlier nominators. Comput. Stat. Data An. 34:279-298.
Çil, B., 1990. Regresyon analizinde tek bir sapan değerin “outlier’ın” belirlenmesine ilişkin metodların mukayesesi. PhD Diss., Ankara Üniversitesi, Ankara, Turkey. Gentleman, J., Wilk, F., 1975. Detecting
out-liers. II. Supplementing the direct analysis of residuals. Biometrics 31:387-410. Liu, H., Sirish, S., Wei, J., 2004. On-line outlier
detection and data cleaning. Comput. Chem. Eng. 28:1635-1647.
National Research Council, 1994. Nutrient requirements of poultry. 9th rev. ed. National Academy Press, Washington, DC, USA.
Woodruff, D.L., Rocke, D.M., 1993. Heuristic search algorithms for the minimum vol-ume ellipsoid. J. Comput. Graph. Stat. 2:69-95.
Woodruff, D.L., Rocke, D.M., 1994. Computable robust estimation of multivariate location and shape in high dimension using com-pound estimators. J. Am. Stat. Assoc. 89:888-896.