Noncontact Atomic Force Microscopy: An Emerging Tool for
Fundamental Catalysis Research
Published as part of the Accounts of Chemical Research special issue
“
Microscopic Insights into Surface Catalyzed
Chemical Reactions
”.
Eric I. Altman,
*
,†,‡Mehmet Z. Baykara,
∥and Udo D. Schwarz
†,‡,§†Center for Research on Interface Structures and Phenomena, ‡Department of Chemical and Environmental Engineering, and §Department of Mechanical Engineering and Materials Science, Yale University, New Haven, Connecticut 06520, United States ∥Department of Mechanical Engineering and UNAM− Institute of Materials Science and Nanotechnology, Bilkent University,
Ankara 06800, Turkey
CONSPECTUS: Although atomic force microscopy (AFM) was rapidly adopted as a routine surface imaging apparatus after its introduction in 1986, it has not been widely used in catalysis research. The reason is that common AFM operating modes do not provide the atomic resolution required to follow catalytic processes; rather the more complex noncontact (NC) mode is needed. Thus, scanning tunneling microscopy has been the principal tool for atomic scale catalysis research. In this Account, recent developments in NC-AFM will be presented that offer significant advantages for gaining a complete atomic level view of catalysis.
The main advantage of NC-AFM is that the image contrast is due to the very short-range chemical forces that are of interest in catalysis. This motivated our development of 3D-AFM, a method that yields quantitative atomic resolution images of the potential energy surfaces that govern how molecules approach, stick, diffuse, and rebound from surfaces. A variation of 3D-AFM allows the determination of forces required to push atoms and
molecules on surfaces, from which diffusion barriers and variations in adsorption strength may be obtained. Pushing molecules towards each other provides access to intermolecular interaction between reaction partners. Following reaction, NC-AFM with CO-terminated tips yields textbook images of intramolecular structure that can be used to identify reaction intermediates and products.
Because NC-AFM and STM contrast mechanisms are distinct, combining the two methods can produce unique insight. It is demonstrated for surface-oxidized Cu(100) that simultaneous 3D-AFM/STM yields resolution of both the Cu and O atoms. Moreover, atomic defects in the Cu sublattice lead to variations in the reactivity of the neighboring O atoms. It is shown that NC-AFM also allows a straightforward imaging of work function variations which has been used to identify defect charge states on catalytic surfaces and to map charge transfer within an individual molecule.
These advances highlight the potential for NC-AFM-based methods to become the cornerstone upon which a quantitative atomic scale view of each step of a catalytic process may be gained. Realizing this potential will rely on two breakthroughs: (1) development of robust methods for tip functionalization and (2) simplification of NC-AFM instrumentation and control schemes. Quartz force sensors may offer paths forward in both cases. They allow any material with an atomic asperity to be used as a tip, opening the door to a wide range of surface functionalization chemistry. In addition, they do not suffer from the instabilities that motivated the initial adoption of complex control strategies that are still used today.
1. INTRODUCTION
Since its invention, atomic force microscopy (AFM) has been extensively applied to investigate surface phenomena and thus would appear to be ideal for studying surface-catalyzed reactions. It has nevertheless lagged the application of scanning tunneling microscopy (STM) to these problems because catalysis is an atomic-scale phenomenon, rendering the resolution achieved with the commonly used “contact mode” or “tapping mode” schemes insufficient. Atomic resolution can, however, be accomplished with an oscillation-based control scheme optimized to prevent tip−sample contact1that has been termed noncontact atomic force microscopy (NC-AFM).2Still, 20 years
after its initial demonstration, challenges including the stability and complexity of the control system have restricted the widespread adoption of NC-AFM. In this contribution, it will be shown that recent advances in NC-AFM methodology provide a compelling set of tools to characterize the chemical interactions in catalysis with unprecedented spatial and energy resolution.
Compared to STM, NC-AFM has numerous advantages for studying heterogeneous catalysis. The most obvious is that
NC-Received: March 30, 2015
Published: August 24, 2015
AFM applies equally well to conductors and insulators and virtually all practical catalysts include insulators. More significantly, NC-AFM contrast directly reflects variations in the short-range chemical forces acting between the tip and sample.2Unlike STM, which depends on the integrated density of states (DOS) and the tunneling barrier height,3images may therefore be understood in terms of intuitive chemical arguments. Moreover, functionalized tips allow atomic-reso-lution mapping of how strongly the atoms at the end of the tip interact with the surface, which is key to understanding catalysis. For conductors, combining NC-AFM with tunneling current measurements can provide the positions of all atoms on compound surfaces, their chemical interactions with the tip, and how these interactions depend on the underlying electronic properties.4 Controlling the tip apex can yield textbook-like images of molecular structure that may be used to identify reactive intermediates.5−7 Finally, NC-AFM can quantify the forces required to translate atoms and molecules across surfaces,8 opening the door to measuring energy barriers between surface sites and adsorbate intermolecular interactions.
The following sections provide an overview of how NC-AFM works, descriptions of the breakthroughs outlined above, and highlights of how NC-AFM has been used to gain unique insight into catalysis. This Account concludes with an outlook on how newly developed NC-AFM capabilities can be applied to long-standing problems in catalysis.
2. NC-AFM METHODOLOGY 2.1. Operating Principle
When soft cantilevers are brought close to a surface, the gradient of the tip−surface interaction force eventually exceeds the cantilever spring constant causing a jump-to-contact and thus the loss of atomic resolution.9 This instability can be avoided by oscillating the cantilever.2 Attractive tip−surface forces slightly reduce the cantilever resonant frequency; the closer the tip approaches, the stronger the attractive force and thus the larger
the frequency drop.9,10 In NC-AFM, this resonant frequency shift is used as the feedback parameter for topographic imaging. Making this scheme work requires rapidly distinguishing small changes in resonant frequency, always driving the cantilever at resonance, and holding the oscillation amplitude constant.10The frequency measurement and amplitude control both require feedback loops; thus topographic imaging requires tuning three feedback loops. Because the oscillation amplitude, frequency, and closest tip−sample approach depend on one another, the feedback loops are coupled making proper tuning challenging. On the bright side, the energy input required to hold the amplitude constant provides insight into dissipative losses.9
Jump-to-contact can also be avoided by employing stiff sensors, typically in the form of one prong of piezoelectric quartz tuning forks.9Unfortunately, the static charge generated in the piezoelectric upon deflection by tip−surface forces is immeas-urably small and so the approach outlined above is still used, in this case to produce detectable AC currents. Still, quartz force sensors have numerous advantages over softer cantilevers, notably: (1) simplification of instrument design by eliminating the need for optical detection of the cantilever deflection; (2) the ability to easily attach tips made from any material of choice; and (3) small oscillation amplitudes that keep the tip entirely within the tip−surface force field during an oscillation cycle, thereby increasing sensitivity.5,9
2.2. Generating Quantitative Potential Energy Maps
Although shifts in cantilever resonant frequency are taken as a proxy for the tip−surface interaction strength, typical NC-AFM images representing planes of constant cantilever resonant frequency provide no quantifiable information on the tip− surface interaction strength. Recovering the interaction force requires tracking the frequency shift at all tip−sample distances back to where the cantilever is unaffected by the surface.11 Therefore, quantitatively mapping surface forces entails determining how the frequency shift evolves with distance at every point in an image. This easily takes a day or two if one
Figure 1.3D-AFM data acquisition scheme. (a) Images are recorded up to h0where atomic contrast is lost. (b) Lateral drift is corrected by comparing
contrasts in successive images. (c) Long-range interactions are accounted for by a single site-independentΔf (z) curve recorded for z > h0, which is
combined with the short-range data to generate site-specific, quantitative force or energy versus distance curves (d) for each pixel. (e) Visualization of the 3D array of force versus distance curves. Adapted from ref12.
simply acquires frequency shift versus distance curves at every point; drift and long-term stability render this approach impractical.
In 2009, Albers et al. described how these challenges could be surmounted through a layer-by-layer data acquisition approach that inherently corrects for drift and reduces the amount of data required.12,13As illustrated inFigure 1, topographic images are recorded as the mean tip−surface distance is increased until atomic resolution is lost. At this point, the tip−surface interaction may still affect the cantilever resonance; however, this long-range interaction can be described by a single frequency shift versus distance (Δf(z)) curve. After aligning the images to correct for drift, interpolating between data points, and grafting the long-range part of the curve onto the data,Δf(z) curves are generated at every pixel that can be converted to quantitative force versus distance curves. The result is a three-dimensional array of tip− sample interaction force as a function of lateral position and distance from the surface with 1 pm (0.01 Å) spatial resolution and pN force resolution; thus, the method is called 3D-AFM. Integrating the force versus distance curves yields a set of meV resolution potential energy surfaces. This method remains the only way to measure the potential energy surfaces that describe how atoms and molecules approach, collide, move across, and rebound from surfaces. Although the method was developed using a cryogenic microscope which decreases drift and improves resolution; it does not inherently require low temperatures and has even been extended to liquids.14
2.3. Measuring the Forces Required to Translate Atoms and Molecules
Over 20 years ago, it was demonstrated that a scanning probe tip could be used to create arbitrary atomic patterns.15Manipulation approaches have been perfected since and include translating adsorbates by pushing,16which relies on repulsive tip-adsorbate interactions exceeding the surface diffusion barrier. It has been demonstrated that NC-AFM can measure the lateral force required to push adsorbed atoms and molecules, from which the diffusion barrier can be recovered.8The measurement principle represents a special case of the layer-by-layer data acquisition scheme developed for 3D-AFM. As illustrated inFigure 2for CO,
the tip is repeatedly moved along a predetermined crystallo-graphic direction toward the molecule at constant, but successively lower heights, while the frequency shift and dissipation are measured. Once the tip is close enough that the lateral forces on the molecule exceed the threshold to initiate sliding, the molecule“jumps” toward the left.
The good agreement between the CO diffusion barrier on Cu(111) measured in this way and by imaging diffusion
trajectories suggests that the threshold force for translation can be tip-independent.8,17 The method offers advantages over following diffusion trajectories: it does not require varying the temperature to obtain an Arrhenius plot; and it allows paths that include rare sites that nonetheless may have a large impact on catalysis. For different initial and final sites, repeating the measurement in the reverse direction would provide the energy difference between the sites. Thus, the variations in the potential energy surface that an adsorbate experiences on a heterogeneous surface may be traced by manipulating the adsorbate across the surface; getting the absolute well depth would require a separate measurement of the adsorption energy at least at one site. These measurements inherently require low temperature to freeze out diffusive motion; on the other hand, obtaining similar information by following diffusion requires a variable temper-ature instrument.
2.4. Tip Termination
The ability to map chemical interactions with NC-AFM also means that contrast is sensitive to tip termination. As a result, NC-AFM interpretation typically includes theory to determine the tip most likely responsible for the observed contrast.4 Considering that tips are often conditioned by picking up atoms from the surface, trial tips are constructed from substrate atoms. Additional criteria for identifying tips include stability when placed close to the surface, agreement with force versus distance curves at key symmetry points, and, when available, a match with tunneling current data. The latter arises because STM imaging is often as sensitive to tip termination as NC-AFM.18Contrast in STM is only tip-independent in the Tersoff−Hamann approximation of an s-wave tip at low bias; conditions that are seldom realized.19
Reliably controlling the end of the tip would speed NC-AFM data interpretation, remove ambiguities associated with the inability to sample all possible tips with theory, and enable imaging of the specific chemical forces of interest in catalysis. Tip functionalization to probe specific interactions is well-known in the conventional AFM literature;20extending these approaches to atomic resolution imaging has been challenging. Some success with chemically selective STM imaging has been achieved at room temperature with functionalized self-assembled monolayer and nanotube tips, but the chemical resolution has not been robust.21,22
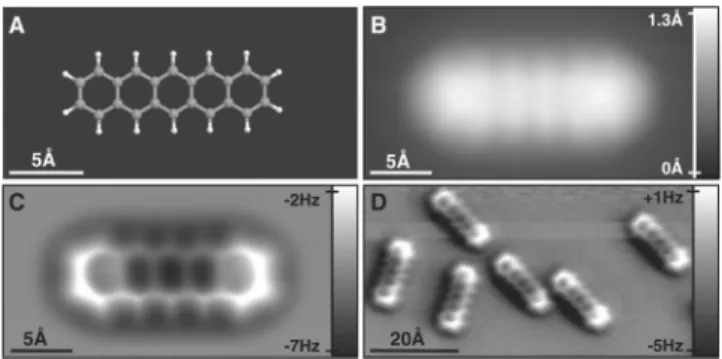
Picking up atoms and small molecules with the tip, in particular CO, has proven to be particularly useful in achieving high resolution.5Although CO is important in catalysis, the C bonds to the tip, thus presenting the wrong end of the molecule to the surface to learn about how CO interacts with surfaces. Rather the CO termination yields NC-AFM images that closely resemble textbook molecular structures;5Figure 3C showing pentacene, for example, received great attention in the popular press.23 Notably, the STM image inFigure 3B obtained with the same tip only revealsfive lobes. Using 3D-AFM, it was demonstrated that the molecular structure could only be resolved near the minimum of the force versus distance curves. Recent theoretical analysis suggested that the high resolution at these close distances is due to repulsive forces torqueing the CO away from the atoms and bonds as the tip approaches the molecule and then a sudden relaxation of the CO to an adjacent energy minimum when the tip-CO bond can no longer be distorted.24 The tip−surface force peaks abruptly just before relaxation, accounting for the sharp appearance of the molecular outline. This torqueing also accounts for the obvious elongation of the
Figure 2.Illustration of how the force required to push a CO molecule (C green, O orange) is determined. Dashed lines indicate the tip trajectory with the darker shading indicating higher forces and red the trajectory that causes translation.
molecule from bottom to top. Reliable transfer of the molecule to the tip requires cryogenic temperatures; however, recent advancements with integrating closed-loop cooling systems with high resolution scanning probe tools promise to make such capabilities more widely available.25
3. COUPLING NC-AFM WITH OTHER LOCAL MEASUREMENTS
The development of quartz force sensors with metallic tips has led to a significant advantage for NC-AFM: simultaneous acquisition of multiple data channels that provide complemen-tary information. In particular, recording the (i) tunneling current,4(ii) dissipation,12and (iii) contact potential difference (CPD)26together with the frequency shift has been the focus of multiple experiments. As catalysis is a complex function of atomic arrangement, electronic structure, and composition, combining
NC-AFM measurements of chemical interactions with the integrated DOS provided by the tunneling current can significantly impact catalysis research, as illustrated insection 3.1. Conductive tips and samples also enable work function imaging. At zero tip−sample bias, differences between the tip and sample work functions create a contact potential difference (CPD) leading to an attractive electrostatic force. The frequency shift, therefore, is minimized when the bias matches the CPD. Using feedback control to maintain the bias at the CPD during rastering forms the basis for Kelvin probe force microscopy (KPFM), which can be used to characterize charge states of defects,27 to monitor adsorption,28 and to pinpoint charge transfer in adsorbates26and between supports and metals.29A KPFM variation to characterize charging processes on insulators involves applying voltage pulses to induce single electron tunneling events tofill or deplete traps which then changes the tip−surface electrostatic interactions.30
3.1. 3D-AFM/STM Measurements on a Surface Oxide Layer: Cu(100)-O
As metal oxides are an important class of heterogeneous catalysts, their surfaces are ideal for demonstrating the capabilities of multichannel NC-AFM for understanding catalytic properties. Particularly useful areas for this approach include (i) simultaneous imaging of multiple atomic species on compound surfaces and (ii) chemical and structural identification of surface defects, including evaluating their influence on chemical interactions.
We demonstrated for surface-oxidized Cu(100) (Cu(100)-O) that combining 3D-AFM with simultaneous tunneling current measurements (3D-AFM/STM) can yield the positions of both the Cu and O atoms, the differences in chemical interactions between individual O atoms, and the identification of atomic-scale defects.4 The Cu(100)−O surface exhibits a missing row
Figure 3.(A) Ball and stick model of pentacene (C gray, H white). (B− D) Topographic STM (B) and constant height (C,D) NC-AFM images of pentacene adsorbed on two layers of NaCl on Cu(111) obtained with a CO terminated tip. Reproduced with permission from ref5. Copyright 2009 Science Magazine.
Figure 4.(a) Model of the Cu(100)-O surface: surface Cu, bright orange; subsurface Cu, dark orange; O, gray. (b) 3D map of chemical interaction forces on the Cu(100)-O surface. The total force contrast from red to blue is 23 pN. (c) Horizontal map of interaction forces extracted from the 3D map. (d) Simultaneously recorded, constant-height tunneling current map. The contrast is dominated by Cu atoms; nonmissing row defects are highlighted. Insets in (c) and (d) depict the tip apex responsible for the experimental force and tunneling current contrasts. (e) Structural model for the surface area covered by (c) and (d). Adapted from ref4.
reconstruction (Figure 4a), wherefilled rows of Cu and O atoms are separated by troughs of missing Cu atoms. As oxidized copper is an industrial catalyst,31,32the 3D-AFM/STM experiments on Cu(100)-O surface have implications on catalysis.
A full three-dimensional map of chemical interaction forces acquired on Cu(100)−O is provided inFigure 4b, where the individual maxima are assigned to surface O atoms based on symmetry. The magnitude of chemical interaction forces varies remarkably, which is further emphasized inFigure 4c. Moreover, the simultaneously recorded tunneling current map,Figure 4d, shows a significantly different contrast that represents the configuration of the Cu atoms. Here Cu atoms in filled rows are imaged as bright maxima and faint bridges are formed over Cu atoms adjacent to the missing rows, thereby demonstrating simultaneous multispecies imaging. Finally, several nonmissing row defects are observed. A thorough comparison of experimental data with ab initio simulations of the tip−sample interaction leads to the identification of (i) the tip apex as a (111)-oriented Cu asperity with an O atom adsorbed on the side (insets in Figure 4c,d) and (ii) the identification of the nonmissing row defects as displacements of Cu atom pairs (Figure 4e).4The variability in interaction forces observed on O atoms can then be attributed to the variation in the structural and electronic environment caused by these defects. Thus, a particular strength of the NC-AFM method is emphasized as the ability to perform real-space, quantitative evaluation of the effect of surface defects on atomic-scale chemical reactivity.
3.2. Topography-Feedback-Induced Cross-Talk in Multichannel NC-AFM Measurements
While multichannel NC-AFM has significant potential for fundamental catalysis research, an often overlooked but critical issue involves cross-talk between the data channels due to topography feedback. Although constant-height images extracted from the 3D-AFM/STM maps (Figure 4c,d) are immune to this problem, many multichannel NC-AFM measurements involve feedback on a primary channel while monitoring secondary channels. This leads to an artificial modulation of the secondary data as the feedback causes the tip to move up and down during scanning.
To evaluate the impact of topography-feedback-induced cross-talk in such experiments, a detailed study involving combined NC-AFM/STM performed in the dynamic STM mode (where the tunneling current is the feedback parameter) was carried out on the Cu(100)−O surface.33Results reveal that the frequency shift is strongly influenced by the topography feedback, leading to an erroneous assignment of the highest attractive interaction locations to the hollow sites between the O atoms (Figure 5). On the other hand, the 3D-AFM measurements inFigure 4correctly assign the highest chemical attraction to the O atoms, as predicted by DFT calculations.
4. APPLICATIONS TO CATALYSIS RESEARCH
The use of NC-AFM for fundamental catalysis research has been steadily increasing over the past decade and has accelerated in the past few years due to the breakthroughs highlighted above. This section will review exemplary results for (i) bare catalytic surfaces, (ii) imaging and spectroscopy of adsorbed molecules and atoms, (iii) identifying reaction pathways, and (iv) the determination of defect charge states and intramolecular charge transfer.
4.1. NC-AFM Analysis of Catalytic Surfaces
NC-AFM’s unique ability to atomically resolve insulating surfaces has motivated the study of catalytically important insulators. Although it can be difficult to prepare clean insulator surfaces, sputtering often irreversibly changes the material, and forces due to trapped charges can dominate atomic-scale surface forces, progress has been made on a number of materials including Al2O3, CeO2, TiO2, and ZnO.
34−37
A surface where NC-AFM has contributed to fundamental understanding of catalysis is ceria (CeO2(111)). Ceria is
particularly important for applications involving oxygen storage and release, including catalytic converters, solid oxide fuel cells, and the water gas shift reaction.38This ability has been ascribed to atomic-scale defects including oxygen vacancies and step edges; characterizing these features is an ideal problem for NC-AFM. Specifically, NC-AFM studies have identified individual surface and subsurface oxygen vacancies (Figure 6).35Moreover, oxygen surface diffusion on ceria surface was observed,39
and it was determined that water molecules dissociate on oxygen vacancies therebyfilling the vacancies with hydroxyls.40Finally, high-resolution images of the step edges revealed predominant (110) and (001) facets, which, with theory, lead to the conclusion that CO oxidation on CeO2(111) mainly occurs at
step edges due to enhanced chemical interaction with CO molecules.41
4.2. Imaging and Spectroscopy of Adsorbates
The next step toward a full understanding of catalysis involves imaging and force spectroscopy measurements on adsorbed molecules and atoms. Consequently, several NC-AFM experi-ments have focused on unraveling the structure and chemical reactivity of individual molecules, molecular layers, and metal atoms. Molecules that have been investigated via NC-AFM include formate ions, perylene derivatives, C60, and water.42−45
Additionally, individual metal atoms have been recently imaged and characterized on supports such as TiO2(110).46
The main advantage provided by NC-AFM over STM is the ability to clearly distinguish different adsorbates and surface atoms via force spectroscopy. Imaging and spectroscopy experiments performed on rutile TiO2(110) are particularly
illustrative in this case, where it was demonstrated via a combination of site-specific force spectroscopy experiments
Figure 5.Topography map recorded in the dynamic STM mode (a) and the simultaneously recorded frequency shift (b) on Cu(100)-O. Insets in (a) are DFT-calculated STM maps for the tip apex ofFigure 4c,d. (c) Topography-feedback-induced cross-talk results in the erroneous assignment of the highest chemical interactions (brightest spots) to the hollow sites between individual O atoms, highlighted by the black ellipses. Reprinted with permission from ref 33. Copyright 2015 American Chemical Society.
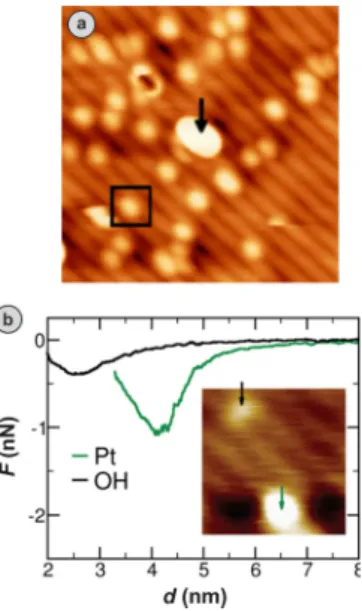
and ab initio calculations that characteristic force−distance relationships for adsorbed OH groups and Ti as well as O atoms on the surface can be reliably determined for different tip apex models.47Furthermore, well-known size and support effects in transition metal catalysis have motivated NC-AFM experiments on Pt atoms on TiO2(110).46Results have revealed that isolated
Pt atoms exhibit the highest chemical interaction with the probing tip for all tip apexes under consideration, thereby illustrating the high chemical reactivity of metal atoms on metal oxide substrates compared with other sites (Figure 7).
4.3. Identifying Reaction Pathways
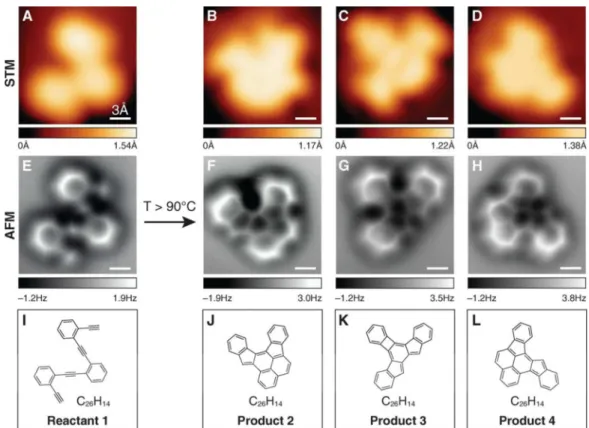
As indicated insection 2.4, functionalizing NC-AFM tips with CO has resulted in the ability to image the intramolecular structure of adsorbed molecules.5This approach is particularly useful for determining the structure of complex molecules whose exact structure eluded experimental determination6and naturally extends to following the progress from reactants to products in catalytic reactions. Recent work has impressively demonstrated that intramolecular restructuring of single 1,2-bis((2-ethynylphenyl)ethynyl)benzene molecules in response to thermally induced cyclization reactions can be observed with CO-functionalized NC-AFM and the different reaction products can be identified (Figure 8).7Moreover, by taking the activation barriers and energies associated with metastable intermediates into account, the authors were able to determine the reaction pathways that yield the observed products. At present, the method works best for determining the C backbone of nearly planar species, though specificity to different atoms and bonds (e.g., the bright triple bonds inFigure 8) have been detected.6,7 Generalizing the approach will require benchmarking
experi-ment and theory to establish rules for the appearance of different functional groups and how they may be affected by tilting.
4.4. Mapping Charge States and Charge Transfer
Considering that catalytic activity can be dominated by the structural and electronic properties of defects, a local technique that provides direct access to these characteristics would provide crucial results for understanding catalysis. As mentioned earlier, NC-AFM is capable of measuring work function variations by detecting the CPD either as the minimum in individual frequency shift vs bias curves or by applying KPFM to deliver CPD maps. As electron transfer processes play an important role in catalytic reactions on metal oxide surfaces, determining the charge states associated with electron trapping sites (e.g., oxygen vacancies) is of fundamental importance. Utilizing combined NC-AFM/STM measurements together with frequency shift vs bias voltage curves and ab initio calculations, König et al. have identified the charge states associated with the three variants of oxygen vacancies on the MgO/Ag(001) surface (the color centers F0, F+, and F2+).27
Moreover, a quantitative analysis of the chemical interaction forces acting between the metallic tip apex and individual color centers has resulted in the determination that metal adsorbates (as mimicked by the tip apex) exhibit a strong attractive interaction with the defects, which act as preferred adsorption sites and ultimately nucleation sites for catalytic nanoparticle growth.48 Further, Au clusters at the charged sites become charged themselves, leading to changes in how they adsorb CO that may account for the low-temperature CO oxidation activity of Au clusters.49
The charge distribution inside individual adsorbates can also be studied using NC-AFM.26Specifically, combined NC-AFM/ KPFM measurements performed on a single naphthalocyanine molecule with a CO-tip show that an asymmetric charge distribution inside the molecule can be detected and quantified (Figure 9). This proof-of-concept experiment establishes that NC-AFM in conjunction with KPFM is capable of detecting and visualizing changes in the intramolecular charge distribution of
Figure 6.NC-AFM images of CeO2(111) including surface (a) and
subsurface (b) oxygen vacancies. The line profile in (c) confirms theoretical expectations regarding the appearance of a surface O vacancy as a hole surrounded by six slightly protruding O atoms. On the other hand, the line profile in (d) confirms theoretical expectations that a subsurface O vacancy would appear as a triangular arrangement of protruding O atoms. Corresponding structural models are provided in (e) and (f). Reproduced with permission from ref35. Copyright 2007 American Physical Society.
Figure 7.(a) NC-AFM image of rutile TiO2(110) with adsorbates
including OH groups (black square) and Pt atoms (black arrow). (b) Experimental force (F) versus tip−sample distance d curves for the Pt atom and the OH group depicted in the inset. The difference in measured chemical interaction forces provides a robustfingerprint for atomic/molecular identification. Reproduced with permission from ref 46. Copyright 2015 American Physical Society.
individual molecules as a result of adsorption and reaction, thereby providing essential information on how surface interactions weaken specific chemical bonds and reduce reaction barriers.
5. OUTLOOK
The above demonstrates how NC-AFM methods can provide unique insights into catalytic materials and adsorbed molecules. Integrating these methods can make it possible to evaluate a catalytic cycle on the atomic scale. Starting with 3D-AFM with a tip exposing the functional group of interest, the potential energy surface that describes the adsorption and diffusion of individual reactants can be obtained. Next, the potential energy surfaces that describe intermolecular interactions can be elucidated by measuring the threshold forces required to push a molecule
toward and away from another molecule along different crystallographic directions. Once reaction partners are brought together, reaction may be induced by excitation with the tip,50or thermally as in Figure 8.7 The structure of the resulting intermediate can then be imaged with a CO-terminated tip and the process repeated until the product is formed. In addition to the chemical structure, we may be interested in the role charge transfer plays in surface bonding, how bonding to the surface affects the chemical bonds thereby preparing the molecule to further react, and why reactions take place at some surface sites and not others. Combining 3D-AFM/STM and KPFM has begun to answer some of these questions; integrating these measurements with tunneling spectroscopy to obtain the local DOS and inelastic tunneling spectroscopy to characterize molecular vibrations would ultimately reveal the nature of the molecule−surface bonds, how the adsorbed species is distinct from the isolated molecule, and how these features may be influenced by the local surface structure. Thus, an NC-AFM-based approach has the promise to address the key questions at each step of a catalytic reaction.
While the promise is great, currently each of the experiments outlined above takes an expert team months to years to accomplish. There are two major impediments to progress: (1) the inability to reproducibly create robust tips that can be readily functionalized and (2) the complexity of the NC-AFM control system. Theflexibility to use any material that forms an atomic asperity as a tip as well as the development of methods to functionalize materials ranging from oxides to semiconductors provides hope that thefirst obstacle may be solved.51,52Already it has been shown that unconventional tip materials may yield improved NC-AFM resolution.53Thus, the solution may rely on working backward from materials known for forming robust
Figure 8.STM (A−D) and NC-AFM (E−H) images of the reactant molecule 1 (1,2-bis((2-ethynylphenyl)ethynyl)benzene) and the reaction products 2−4 that are formed via thermally induced cyclization at elevated temperatures, obtained with a CO-functionalized tip. While STM images are diffuse, NC-AFM images reveal intramolecular details, allowing the determination of chemical structure as in (I−L). Reproduced with permission from ref7. Copyright 2013 Science Magazine.
Figure 9.(a) Map of the local CPD of a naphthalocyanine molecule delivered by KPFM. (b) DFT-calculated map of electrical field magnitude 0.3 nm above the molecule. The different appearance of the upper-right and lower-left lobes of the molecule in the KPFM image is attributed to a tip effect or substrate-induced background. Reproduced with permission from ref26. Copyright 2012 Macmillan Publishers Ltd. Accounts of Chemical Research
functional layers to forming atomic asperities rather than vice versa. The second issue has left NC-AFM in the purview of a small group of experts. In the 20 years since its development, there has been no fundamental change in NC-AFM operation; making NC-AFM as routine as STM requires rethinking the control and detection scheme. Quartz force sensors may provide a solution since they are not subject to jump-to-contact instabilities and thus do not inherently require frequency modulation to detect surface forces with atomic resolution.
■
AUTHOR INFORMATIONCorresponding Author
*Telephone: 203-432-4375. E-mail:[email protected].
Funding
National Science Foundation Grant DMR-1119826. Outstand-ing Young Scientist Program of the Turkish Academy of Sciences (TÜBA-GEBİP).
Notes
The authors declare no competingfinancial interest.
Biographies
Eric I. Altmanreceived his B.S. degree from Cornell University in 1983 and his Ph.D. from the University of Pennsylvania in 1988, both in Chemical Engineering. Following a stint at the U.S. Naval Research Laboratory, he started at Yale University as Assistant Professor of Chemical Engineering in 1994, rising to the rank of Professor in 2002. His research centers on understanding elementary chemical processes at solid surfaces on the atomic scale.
Mehmet Z. Baykarareceived his B.S. degree in Mechanical Engineering from Boğaziçi University in 2006 and his Ph.D. in Mechanical Engineering & Materials Science from Yale University in 2012. He is currently Assistant Professor of Mechanical Engineering at Bilkent University in Ankara, Turkey, where he leads the Scanning Probe Microscopy research group. His research focuses on nanometer- and atomic-scale investigation of surfaces to address fundamental questions in catalysis and tribology.
Udo D. Schwarzreceived his Ph.D. in physics from the University of Basel in 1993. After nine years at the University of Hamburg and the Lawrence Berkeley National Laboratory, he settled at Yale University, where he was promoted to full professor in 2009. His research concerns the local measurement of atomic-scale interactions and properties by applying scanning probe microscopy techniques to study problems in surface physics, catalysis, and friction.
■
ACKNOWLEDGMENTSE.I.A. and U.D.S. acknowledge the support of the National Science Foundation through Grant DMR-1119826. M.Z.B. acknowledges support by the Outstanding Young Scientist Program of the Turkish Academy of Sciences (TÜBA-GEBİP).
■
REFERENCES(1) Giessibl, F. J. Atomic Resolution of the Silicon (111)-(7× 7) Surface by Atomic Force Microscopy. Science 1995, 267, 68−71.
(2) Morita, S.; Wiesendanger, R.; Meyer, E. Noncontact Atomic Force Microscopy; Springer-Verlag: Berlin, 2002.
(3) Wiesendanger, R. Scanning Probe Microscopy and Spectroscopy; Cambridge University Press: Cambridge, 1994.
(4) Baykara, M. Z.; Todorovic, M.; Monig, H.; Schwendemann, T. C.; Unverdi, O.; Rodrigo, L.; Altman, E. I.; Perez, R.; Schwarz, U. D. Atom-Specific Forces and Defect Identification on Surface-Oxidized Cu(100)
with Combined 3D-AFM and STM Measurements. Phys. Rev. B: Condens. Matter Mater. Phys. 2013, 87, 155414.
(5) Gross, L.; Mohn, F.; Moll, N.; Liljeroth, P.; Meyer, G. The Chemical Structure of a Molecule Resolved by Atomic Force Microscopy. Science 2009, 325, 1110−1114.
(6) Gross, L.; Mohn, F.; Moll, N.; Meyer, G.; Ebel, R.; Abdel-Mageed, W. M.; Jaspars, M. Organic Structure Determination Using Atomic-Resolution Scanning Probe Microscopy. Nat. Chem. 2010, 2, 821−825. (7) de Oteyza, D. G.; Gorman, P.; Chen, Y.-C.; Wickenburg, S.; Riss, A.; Mowbray, D. J.; Etkin, G.; Pedramrazi, Z.; Tsai, H.-Z.; Rubio, A.; Crommie, M. F.; Fischer, F. R. Direct Imaging of Covalent Bond Structure in Single-Molecule Chemical Reactions. Science 2013, 340, 1434−1437.
(8) Ternes, M.; Lutz, C. P.; Hirjibehedin, C. F.; Giessibl, F. J.; Heinrich, A. J. The Force Needed to Move an Atom on a Surface. Science 2008, 319, 1066−1069.
(9) Giessibl, F. J. Advances in Atomic Force Microscopy. Rev. Mod. Phys. 2003, 75, 949−983.
(10) Albrecht, T. R.; Grutter, P.; Horne, D.; Rugar, D. Frequency Modulation Detection Using High-Q Cantilevers for Enhanced Force Microscope Sensitivity. J. Appl. Phys. 1991, 69, 668−673.
(11) Sader, J. E.; Jarvis, S. P. Accurate Formulas for Interaction Force and Energy in Frequency Modulation Force Spectroscopy. Appl. Phys. Lett. 2004, 84, 1801−1803.
(12) Albers, B. J.; Schwendemann, T. C.; Baykara, M. Z.; Pilet, N.; Liebmann, M.; Altman, E. I.; Schwarz, U. D. Three-Dimensional Imaging of Short-Range Chemical Forces with Picometre Resolution. Nat. Nanotechnol. 2009, 4, 307−310.
(13) Albers, B. J.; Schwendemann, T. C.; Baykara, M. Z.; Pilet, N.; Liebmann, M.; Altman, E. I.; Schwarz, U. D. Data Acquisition and Analysis Procedures for High-Resolution Atomic Force Microscopy in Three Dimensions. Nanotechnology 2009, 20, 264002.
(14) Fukuma, T. Water Distribution at Solid/Liquid Interfaces Visualized by Frequency Modulation Atomic Force Microscopy. Sci. Technol. Adv. Mater. 2010, 11, 033003.
(15) Eigler, D. M.; Schweizer, E. K. Positioning Single Atoms with a Scanning Tunnelling Microscope. Nature 1990, 344, 524−526.
(16) Custance, O.; Perez, R.; Morita, S. Atomic Force Microscopy as a Tool for Atom Manipulation. Nat. Nanotechnol. 2009, 4, 803−810.
(17) Wong, K. L.; Rao, B. V.; Pawin, G.; Ulin-Avila, E.; Bartels, L. Coverage and Nearest-Neighbor Dependence of Adsorbate Diffusion. J. Chem. Phys. 2005, 123, 201102.
(18) Mönig, H.; Todorović, M.; Baykara, M. Z.; Schwendemann, T. C.; Rodrigo, L.; Altman, E. I.; Pérez, R.; Schwarz, U. D. Understanding Scanning Tunneling Microscopy Contrast Mechanisms on Metal Oxides: A Case Study. ACS Nano 2013, 7, 10233−10244.
(19) Blanco, J. M.; Flores, F.; Perez, R. STM-Theory: Image Potential, Chemistry and Surface Relaxation. Prog. Surf. Sci. 2006, 81, 403−443.
(20) Noy, A.; Frisbie, C. D.; Rozsnyai, L. F.; Wrighton, M. S.; Lieber, C. M. Chemical Force Microscopy: Exploiting Chemically-Modified Tips to Quantify Adhesion, Friction, and Functional Group Distributions in Molecular Assemblies. J. Am. Chem. Soc. 1995, 117, 7943.
(21) Nishino, T.; Buhlmann, P.; Ito, T.; Umezawa, Y. Discrimination of Functional Groups with Scanning Tunneling Microscopy Using Chemically Modified Tips: Recognition of Ether Oxygens through Hydrogen Bond Interactions. Phys. Chem. Chem. Phys. 2001, 3, 1867.
(22) Nishino, T.; Ito, T.; Umezawa, Y. Carbon Nanotube Scanning Tunneling Microscopy Tips for Chemically Selective Imaging. Anal. Chem. 2002, 74, 4275.
(23) Palmer, J. Single Molecule’s Stunning Image. BBC News [Online], August 28, 2009;http://news.bbc.co.uk/2/hi/8225491.stm(accessed June 23, 1015).
(24) Hapala, P.; Kichin, G.; Wagner, C.; Tautz, F. S.; Temirov, R.; Jelínek, P. Mechanism of High-Resolution STM/AFM Imaging with Functionalized Tips. Phys. Rev. B: Condens. Matter Mater. Phys. 2014, 90, 085421.
(25) Hackley, J. D.; Kislitsyn, D. A.; Beaman, D. K.; Ulrich, S.; Nazin, G. V. High-Stability Cryogenic Scanning Tunneling Microscope Based on a Closed-Cycle Cryostat. Rev. Sci. Instrum. 2014, 85, 103704. Accounts of Chemical Research
(26) Mohn, F.; Gross, L.; Moll, N.; Meyer, G. Imaging the Charge Distribution within a Single Molecule. Nat. Nanotechnol. 2012, 7, 227− 231.
(27) König, T.; Simon, G. H.; Rust, H. P.; Pacchioni, G.; Heyde, M.; Freund, H. J. Measuring the Charge State of Point Defects on Mgo/ Ag(001). J. Am. Chem. Soc. 2009, 131, 17544−17545.
(28) Palacios-Lidón, E.; Henry, C. R.; Barth, C. Kelvin Probe Force Microscopy in Surface Chemistry: Reactivity of Pd Nanoparticles on Highly Oriented Pirolytic Graphite. ACS Catal. 2014, 4, 1838−1844.
(29) Sasahara, A.; Pang, C. L.; Onishi, H. Probe Microscope Observation of Platinum Atoms Deposited on the TiO2(110)-(1× 1)
Surface. J. Phys. Chem. B 2006, 110, 13453−13457.
(30) Bussmann, E. B.; Zheng, N.; Williams, C. C. Imaging of Localized Electronic States at a Nonconducting Surface by Single-Electron Tunneling Force Microscopy. Nano Lett. 2006, 6, 2577−2580.
(31) Ciston, J.; Si, R.; Rodriguez, J. A.; Hanson, J. C.; Martinez-Arias, A.; Fernandez-Garcia, M.; Zhu, Y. Morphological and Structural Changes During the Reduction and Reoxidation of Cuo/CeO2 and
Ce1‑XCuxO2Nanocatalysts: In Situ Studies with Environmental Tem,
Xrd, and Xas. J. Phys. Chem. C 2011, 115, 13851−13859.
(32) Wang, Y.; Wu, G.; Yang, M.; Wang, J. Competition between Eley-Rideal and Langmuir-Hinshelwood Pathways of Co Oxidation on Cun
and CunO (N = 6, 7) Clusters. J. Phys. Chem. C 2013, 117, 8767−8773.
(33) Baykara, M. Z.; Todorović, M.; Mönig, H.; Schwendemann, T. C.; Rodrigo, L.; Altman, E. I.; Pérez, R.; Schwarz, U. D. Simultaneous Measurement of Multiple Independent Atomic-Scale Interactions Using Scanning Probe Microscopy: Data Interpretation and the Effect of Cross-Talk. J. Phys. Chem. C 2015, 119, 6670−6677.
(34) Barth, C.; Reichling, M. Imaging the Atomic Arrangements on the High-Temperature Reconstructed α-Al2O3(0001) Surface. Nature
2001, 414, 54−57.
(35) Torbrugge, S.; Reichling, M.; Ishiyama, A.; Morita, S.; Custance, O. Evidence of Subsurface Oxygen Vacancy Ordering on Reduced CeO2(111). Phys. Rev. Lett. 2007, 99, 056101.
(36) Enevoldsen, G. H.; Foster, A. S.; Christensen, M. C.; Lauritsen, J. V.; Besenbacher, F. Noncontact Atomic Force Microscopy Studies of Vacancies and Hydroxyls of TiO2(110): Experiments and Atomistic
Simulations. Phys. Rev. B: Condens. Matter Mater. Phys. 2007, 76, 205415. (37) Torbrugge, S.; Ostendorf, F.; Reichling, M. Stabilization of Zinc-Terminated ZnO(0001) by a Modified Surface Stoichiometry. J. Phys. Chem. C 2009, 113, 4909−4914.
(38) Trovarelli, A. Catalytic Properties of Ceria and CeO2-Containing
Materials. Catal. Rev.: Sci. Eng. 1996, 38, 439−520.
(39) Namai, Y.; Fukui, K. I.; Iwasawa, Y. Atom-Resolved Noncontact Atomic Force Microscopic and Scanning Tunneling Microscopic Observations of the Structure and Dynamic Behavior of CeO2(111)
Surfaces. Catal. Today 2003, 85, 79−91.
(40) Gritschneder, S.; Reichling, M. Structural Elements of CeO2(111)
Surfaces. Nanotechnology 2007, 18, 044024.
(41) Torbrugge, S.; Cranney, M.; Reichling, M. Morphology of Step Structures on CeO2(111). Appl. Phys. Lett. 2008, 93, 073112.
(42) Fukui, K.; Onishi, H.; Iwasawa, Y. Imaging of Individual Formate Ions Adsorbed on TiO2(110) Surface by Non-Contact Atomic Force
Microscopy. Chem. Phys. Lett. 1997, 280, 296−301.
(43) Schutte, J.; Bechstein, R.; Rahe, P.; Rohlfing, M.; Kuhnle, A.; Langhals, H. Imaging Perylene Derivatives on Rutile TiO2(110) by
Noncontact Atomic Force Microscopy. Phys. Rev. B: Condens. Matter Mater. Phys. 2009, 79, 045428.
(44) Loske, F.; Bechstein, R.; Schutte, J.; Ostendorf, F.; Reichling, M.; Kuhnle, A. Growth of Ordered C60 Islands on TiO2(110).
Nano-technology 2009, 20, 065606.
(45) Gritschneder, S.; Iwasawa, Y.; Reichling, M. Strong Adhesion of Water to CeO2(111). Nanotechnology 2007, 18, 044025.
(46) Fernandez-Torre, D.; Yurtsever, A.; Onoda, J.; Abe, M.; Morita, S.; Sugimoto, Y.; Perez, R. Pt Atoms Adsorbed on TiO2(110)-(1× 1)
Studied with Noncontact Atomic Force Microscopy and First-Principles Simulations. Phys. Rev. B: Condens. Matter Mater. Phys. 2015, 91, 075401. (47) Yurtsever, A.; Fernandez-Torre, D.; Gonzalez, C.; Jelinek, P.; Pou, P.; Sugimoto, Y.; Abe, M.; Perez, R.; Morita, S. Understanding Image
Contrast Formation in TiO2with Force Spectroscopy. Phys. Rev. B:
Condens. Matter Mater. Phys. 2012, 85, 125416.
(48) Konig, T.; Simon, G. H.; Martinez, U.; Giordano, L.; Pacchioni, G.; Heyde, M.; Freund, H. J. Direct Measurement of the Attractive Interaction Forces on F0Color Centers on MgO(001) by Dynamic
Force Microscopy. ACS Nano 2010, 4, 2510−2514.
(49) Sterrer, M.; Yulikov, M.; Fischbach, E.; Heyde, M.; Rust, H.-P.; Pacchioni, G.; Risse, T.; Freund, H.-J. Interaction of Gold Clusters with Color Centers on MgO(001) Films. Angew. Chem., Int. Ed. 2006, 45, 2630−2632.
(50) Jiang, Y.; Huan, Q.; Fabris, L.; Bazan, G. C.; Ho, W. Submolecular Control, Spectroscopy and Imaging of Bond-Selective Chemistry in Single Functionalized Molecules. Nat. Chem. 2013, 5, 36−41.
(51) Tao, F.; Bernasek, S. L. Functionalization of Semiconductor Surfaces; John Wiley & Sons: Hoboken, NJ, 2012; p 434.
(52) Tekiel, A.; Prauzner-Bechcicki, J. S.; Godlewski, S.; Budzioch, J.; Szymonski, M. Self-Assembly of Terephthalic Acid on Rutile TiO2(110): Toward Chemically Functionalized Metal Oxide Surfaces.
J. Phys. Chem. C 2008, 112, 12606−12609.
(53) Hofmann, T.; Welker, J.; Giessibl, F. J. Preparation of Light-Atom Tips for Scanning Probe Microscopy by Explosive Delamination. J. Vac. Sci. Technol., B 2010, 28, C4E28.