Smart Home Security with the use of WSNs on
Future Intelligent Cities
Gozde Dinc
Istanbul Kultur University Computer Engineering DepartmentIstanbul, Turkey 34158 [email protected]
Ozgur Koray Sahingoz
Istanbul Kultur University Computer Engineering DepartmentIstanbul, Turkey 34158 [email protected]
Abstract—In recent years, smart cities use some advanced technologies such as Cyber-Physical Systems and Internet of Things for improving the quality of human life by enabling extra security and communication abilities. In a recent survey of ICMA which is the world’s leading association of professional city and county managers, ICMA emphasizes the importance of the safety and security benefits of smart cities by categorizing it as one of the five important motivating factors. Therefore, in this paper, we proposed a new security model for smart buildings and smart homes by using a hot topic research area of Cyber-Physical Systems: WSNs. With the use of this system, it is aimed to construct a smart security system by using a minimum number of sensor nodes with the increased coverage rate for smart buildings and homes.
Keywords — Smart Cities, Smart Homes, Cyber-Physical Systems, WSNs, Sensor Coverage
I. INTRODUCTION
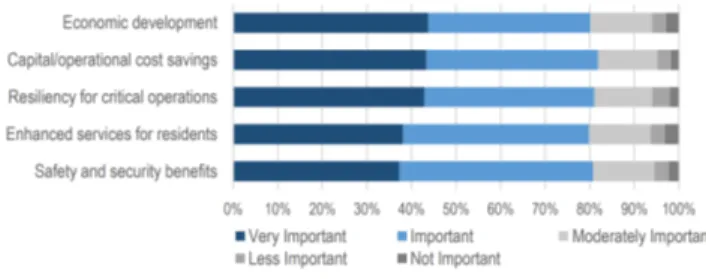
In a recent survey [1] of ICMA, which is the world’s leading association of professional city and county managers, they have listed five important benefits for the motivation of the governments to expand smart cities as depicted in Figure 1. As can be seen from this survey/figure, security is very important in smart city communities. The importance of smart home security is increasing day by day. As people grow older, they may forget to lock their doors, and if they forget to turn off the stove, the gas leak can cause various incidents. For this reason, we suggest smart home security that makes people’s lives easier. Intelligent home security sensors are used to provide tracking. It has been concluded that the sensors that are distributed using the genetic algorithm provide a better coverage rate. The success rate of the smart home security system has increased with the application we developed with the genetic algorithm which has a high success rate compared to other methods. Thanks to this application, a system has been created that can eliminate the energy losses and make people’s lives easier. To increase the security of a building/home WSNs (WSNs) which are a combination of many sensor nodes, are preferred as a good alternative. Due to its low cost of construction/maintenance and easy accessibility, this technology is increasingly used in lots of application areas. The network structure is generated by distributing these sensor nodes to different locations to collect accurate sensed data according to its application type
as depicted in Fig. 2. Nodes can communicate with each other in order to monitor environmental conditions, and the important information can be transmitted to the sink node which is connected to the global network that can be triggered any security action like sending a multimedia message to the homeowner or triggering a security mechanism of the building or sending an alert message to the nearest police station.
Fig. 1. Advantages of Smart Cities
In WSN systems, the distribution of the sensor nodes is a very trivial issue. Due to the communication constraints of the nodes, it is really hard to locate these nodes in appropriate position. There are lots of different distribution of the nodes in the control area. Therefore, to increase the efficiency of the system by enhancing the coverage area of the WSN with the minimum number of nodes, some enhanced distribution algorithms should be used. In this optimization problem, evolutionary algorithms have emerged as a good solution approach. Especially, Genetic Algorithms is mostly preferred due to its simplicity and good efficiency either in execution time or in coverage rate. In this paper, a smart home security system is proposed to check a specific area with the use of WSN in which sensor nodes’ locations are determined with Genetic Algorithms for increasing the effectiveness and the coverage area of the system.
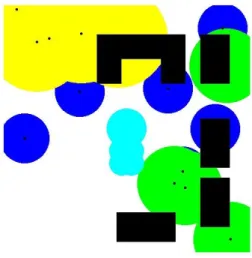
In this paper, it is aimed to get the security of a smart home/building is set up with the use of WSN systems. Therefore, in the proposal the secure area of a smart home, whose shape is something such as in Figure 2, is enabled by the distribution of a sensor nodes in the area. The locations of nodes are determined with the use of an evolutionary algorithm named as a genetic algorithm. The experimental results showed that the proposed architecture is applicable and generates acceptable solutions.
Fig. 2. View of the Land.
II. BACKGROUND A. Wireless Sensor Networks (WSNs)
Besides, when looking at the sensor nodes in the WSNs, each node has its own five main units. These are power supply, memory unit, sensing unit, processing unit and communication unit. One of the most important challenges of WSNs is power consumption. When the battery life of the sensors is over, the sensor cannot cover the area in which it is located and starts searching for an alternative route for communication. In WSNs, the aim in networks is to decide on a network architecture that minimizes energy consumption, provides high coverage and minimizes the loss of sensor sensors. WSNs are used in various areas such as intelligent house architectures, border security, agriculture and forest fires detection.
A WSN may be either in a flat architecture or hierarchical architecture which can result to a simple topology by using minimum load and less message collisions. Mobility of a node is an important factor in the WSN coverage. It refers to the ability to relocate nodes after initial deployment. Unwanted mobility can result in holes. On the other hand, it can be used to increase the scope, the connection, or increase the network life. Unwanted mobility can result some coverage holes. Intentional mobility; scope can be used to increase connectivity or increase network life. Detection affects both energy consumption and connectivity and coverage. Detection can be classified by detection model, function, or results. Detection from the functional view can be local or remote. Local sensing involves measuring a property of the environment (e.g., humidity). At the same time remote sensing uses some features such as use of a laser to identify an intruder. The detection results for both local and remote species can be deterministic or probabilistic. Finally, the detection models can be classified as disc or irregular model. The former one assumes a circle with a fixed radius.
WSNs can be used in lots of application areas, living space monitoring, health monitoring, military surveillance, and weather detection. This wide range of applications offers a variety of design, operation and management challenges for the WSN. One critical challenge is the coverage of WSNs. Coverage issue is directly related with how each point in the target area is sensed by using a number of sensor nodes. This is also accepted as service quality for WSN systems. Sensors
can be located either in predetermined positions to increase the coverage; or randomly scaterred. In most of the application areas, the theatre of the operation is dangerous/remote and the sensors are randomly distributed. In this case, coverage is not always in a acceptable rate. Apart from this, due to the the failure of a sensor nodes a battery depletion or a hardware problem may occur. Coverage is divided into two categories: full and semi-coverage area. Semi-coverage covers certain areas. Partial coverage includes different varieties. These include directional coverage, barrier, focus and target scopes. In some cases, a point needs to be monitored by more than one sensor.
B. Coverage of WSNs
Coverage is one of the biggest problems of WSNs. The coverage area is an important criterion for measuring the quality of the detection function. The coverage area has been classified as point coverage, target coverage, barrier and blanket. Point coverage approaches, searching for surveillance solutions that find fixed objects within the region of interest(RoI) target coverage approaches are trying to find targets as they move through RoI. Barrier coverage means detecting movement along a sensor barrier.
C. Network Life and Energy
Another important point in WSNs is network connectivity. If any sensor can communicate with other sensors, a network connection is established. Communication is categorized as one-to-one, one-to-many, many-one. Network connections are required to enable the information collected by the sensors to be sent to the sink. If any sensor can communicate with the sink, we can conclude that the network is connected. One of the biggest problems of WSN in networks is that energy resources are quite limited. It may be difficult to charge or replace the battery of the distributed sensors. For a small number of sensors, the network life is not sufficient and the life of the network does not increase when the number of sensors is increased. As the number of sensors increases, traffic and density will increase so that energy consumption will be high. To extend network life, sensors must be located in the right places, taking into account factors such as sink position, event frequency, and any specific mechanism applied to sensors to build paths to the sink. There are two ways to protect energy. One of these is to plan the active sensor program, which allows other sensors to enter sleep mode using conflicts between detection ranges. The second approach is to adjust the sensing range of the sensors for energy saving. [10]
Due to the limited energy capacity of the sensor nodes, Message distribution mechanism is very important for increas-ing the lifetime and decreasincreas-ing the energy consumption of the WSN as a whole. Especially Publish/subscribe communi-cation mechanism can fit for this type of energy preserving mechanisms as mentioned in [7], [11].
D. Distribution Strategies of Nodes
The sensors are distributed in two ways. One of them is Deter-ministic Distribution and the other is Random Distribution. The
selection of the appropriate approach depends on factors such as sensor types, RoI quality and application requirements.[10] In deterministic distribution, network efficiency is most effective since sensors are placed at predetermined points. However, the Wireless Sensor is not practical due to the size of the Networks or the inaccessibility of RoI. It is very risky to use deterministic distribution method in a disaster zone or war environments. Therefore, random distribution can be used. The variety of techniques are used to increase the lifespan of the WSNs. One of these ancillary techniques is called Event Timing Mechanisms and it controls the sleep states of the sensors. This technique provides a longer grid life by saving energy between sensors. Another important method of distribution is the Random Distribution Method. Firstly, the sensors are randomly distributed. Then, the sensors are moved to be efficient and positioned to match the design objectives of the network. Random distribution strategies are one of the most practical ways to deploy random dispensing sensors. Sensor positions are defined by the probability function at random node placement. Depending on the deployment strategy, the coordinates of the sensor positions may follow a certain distribution. [10] Figure 3 also shows random node deployment strategies.
E. Related Work
Coverage of a WSN is a hot research area; therefore in the literature, there are many works which focused on this area. A comprehensive survey with mathematical models was prepared for the coverage problem in the types of target and barrier coverage [2] [3] [4]. Various positioning techniques and node failures have been emphasized in order to increase the coverage in on mobile WSNs [5] [6] [8]. Most of these techniques focus on the analysis in two-dimensional domains. Besides, the recommended techniques for 3D WSNs were reviewed in [5] and area, barrier and target coverage techniques are discussed. In [6], various open areas such as the use of an irregular detection model instead of disk detection, due to the unplanned movement of nodes network coverage is calculated. With the use of some mobility models the coverage rate can be enhanced, and the increasing applications of underwater and surface applications are emphasized.
With the use of mobile sensors, a dynamic coverage system can be set, and the displacement in the failures of coverage scenarios are discussed in [9]. In most of the available literature, it has been researched that focusing on the problem of coverage in the context of Mobile WSN reviews the contributions that mobile nodes remain constant after the scope expansion. The sensing classification is shown in Figure 3. In applications, the nodes send the information to the node called sink. In distributions with a single sink node, the communication occurs when the detected data is sent back to the sink node in a very single form. In distributions with more than one sink node many communication models [2] can be used. Finally, when the sink node sends instructions to distributed sensors, it needs one to one communication model.
Nodes can send a message to the sink node when an action occurs in the sensed area. In some systems a periodic reporting is preferred in which sensors monitor some features as humidity, pressure or acceleration, and forward them to the sink center [2]. This can often be classified as frequent or non-frequent actions (depending on the frequency of reporting).In contrast to periodic reporting, events triggered by the event only report that a particular event has occurred; Therefore, coverage requirements are different. Observation and intrusion detection applications require coverage (barrier) coverage, while screening coverage is more appropriate for portal control. In monitoring applications, events are usually based on action. Table 2 depicts the existing WSN applications with appropriate scope for each. It should be noted that some applications, such as habitat monitoring using sensors to monitor human physiology data or monitor animal habits, do not require coverage.
III. PROPOSEDSYSTEM
In the proposed system, it is aimed to set up a smart security system for a home or a building as depicted in Figure 2. As seen from this figure there are some parts such as home, pool, pergola, etc. and there are some empty areas which are aimed to cover by the use of sensor nodes. The sensor nodes can be distributed by different models. The most preferred model is named as random deployment model as depicted in upper parts. However, this random deployment cannot cover the sufficient area in the target place as depicted in Figure 3.
Fig. 3. Random Deployment of Sensor Nodes
In random deployment, there are too many overlapping areas. To increase the coverage area, there is a need of an effective algorithm’s usage. In this paper, we prefer the use of Genetic Algorithms (GAs) which are nonlinear optimization tool that finds the near best solution for a given problem domain. Most organisms in nature have a gene sequence with their own characteristics. Individuals differ according to the information in the chromosome structure in each individual. The child is born with the chromosomal characteristics of him which are inherently transferred from the parents by matching the formation of new children. The natural selection process allows
the selection of the highest suitability. The aim is to ensure that individuals with the highest eligibility value are selected. In the proposed system, sensors are aimed to be located according a specific algorithms. A sensor node is a component of a large sensor network. Each node in the network can gather information about the environment and send it to other nodes (or sinks) in the network. Some sensors can collect data by using a signal detection, some others are used for transferring the produced data to the other sensor nodes as a relay. In the developed application, the sensors are plotted in the free space with Matlab and it is aimed to increase the coverage ratio by distributing the sensors by genetic algorithm.
Some definitions for genetic algorithm components are given below; Individual: They are formed by a combination of one or more genes. Population: GA algorithm starts with random generation of possible solutions. Each solution with its parameters produces a special point of conformity function in the search space (chromosome or generation space). This set of different generations in each iteration is called a population. As a result, children (a new generation) are produced from a part (or half of a quarter) of the best solution of a population. This new generation is expected to be better than the old ones (proportional to the previous ones).
Elitism: After elitism, crossover and mutation procedures, the individual with the best available value in the existing community may not be transferred to the new community. To prevent this, one or more of the best individuals of the previous community are transferred directly to the newly created community. This can be either set as a rate or as a number. In this project we use a number of elite individuals in the population. For the selection of parent roulette selection is preferred in which the chromosomes are grouped around a roulette according to the compliance function. The conformity function is used to select individuals who meet any criteria. A random individual is selected over this roulette. An individual with a larger area will have a greater chance of being elected. The roulette method was used in the developed application.
When the implemented program is considered, the above mentioned genetic algorithm components are applied to the application developed step by step. Our first step is to create the initial population. Although there are different generation methods, in this project we created this population randomly. A population has a number of chromosomes. The sensor node contains three information of its own. a) x coordinate, b) y coordinate, and c) radius (r) value. The x and y coordinates found here have a value between 0 and 500, while the radius has a fixed 3 different radius values. The values of the above mentioned variables on the program are as follows: If we set our node count to 15, we have determined the same radius of the 7 nodes, the same radius of 5 nodes and the same radius as the remaining 3 nodes. As shown in figure, 7 nodes are seen as green, 5 nodes are blue and 3 nodes are yellow and it has the same radius. Assuming the population is 50, each of these individuals has 15 nodes. u and x, y and r values of each of these nodes are determined. m for each individual. Every new generation is expected to be better than before.
After the 50 populations have been generated, the best has to be selected and the sorting needs to be done. It takes the best results if it takes up the space. The other stage, the fitness values are calculated. We assumed that there were 50 individuals in a population and we calculated their success with a loop The success rate is calculated by using this array. Bubble Sort algorithm is used for this success. The success rate of coverage here is emerging. The individual who gives the best results is then directly included in the new population. And then he is randomly chosen from two ebebyn populations.
At this stage, the crossover and mutation is adapted to the developed application. Two chromosomes are selected from the matching pool where the chromosomes are located to obtain two new generations. One or more of the selected chromosomes in the mapping process is called crossing. Two of the most commonly used chromosomes are obtained from the new generation. Crossover process in the application of random numbers to be made according to different values are intended to be different. In the same way to prevent the emergence of different results. After changing the location of any coordinate and a random value is assigned. The ratio of the change is determined according to the percentage. Random x, y coordinates, random circle and random number can be said. After the crossover is done in the application, the children are mutated in a certain percentage. Then the children are added to the new population. This process continues until 3 people remain. the remaining population is added to the new population by creating the random. With this process, the fitness value of the population is calculated by the cycle according to the number specified in the program.
This section explains how the ratio is calculated. When we look at our example, we have a total of 15 nodes. First, the picture is translated into a black and white image. For this conversion, the command ”im2bw” is used as the function of MATLAB. This command is assigned as 1 and 0 depending on the specified number. If e is equal, the values are considered white. To find the ratio of the black area, we find the ratio of the black field by 1 out of the ratio of the white area. size, 3])) ”We used the command. After the calculation of the area, fitness success has emerged. Due to the efficient calculations on MATLAB, which provides more comfortable and easy-to-use functions, the program has been written entirely on MATLAB. Using the step-by-step genetic algorithm with successive steps, success has been achieved by increasing the coverage ratio with the help of sensor networks. The results are shown in more detail in the experimental result section.
IV. EXPERIMENTALRESULTS
The aim of the proposed application is to maximize the coverage ratio of a smart home/building. The experimental platform is set related to Figure 2 with the parameters listed in Table I Firstly the 3D picture is converted to 2D picture and the sensor nodes are located according to proposed model.
It was concluded that the rate of coverage is increasing when we increase the mutation rate. Thus, it is understood that the application gives very good results by looking at the
TABLE I EXPERIMENTALPARAMETERS Type Value Area 500m*500m # of Nodes 15 (7, 5, 3) Radius of Nodes 50m, 75m, 100m Population Size 50 Mutation Rate 10 % # of Iterations 50 Parent Selection Roulette Elitism 3 Chromosomes
previous coverage rates. The increase in the ratio is given in the graphs below. Thanks to the coverage rate developed by the genetic algorithm, a very useful approach has been obtained for smart home security as depicted in Figure 4. At the same time, it has seen that the ratio of coverage is increased by increasing the radius sizes according to the obtained results, but the coverage rate obtained by increasing the radius is not very realistic because as the radius increases, the coverage is inevitable. And therefore, the application of radiuses should not be considered as a positive phenomenon.
Fig. 4. Sensed Coverage of Control area with 15 nodes. The effect of the use of iterative approach can be seen in Figure 5. As can be seen from this the convergence of acceptable best solution can easily be seen. Additionally, if iteration number is increased, better solutions can be reached.
V. CONCLUSIONS ANDFUTUREWORKS
In recent years, smart city concept gains a high importance either in social or in corporate life in modern urbanization efforts of the governments. Smart cities are expected to enhance the quality of humans’ daily life by increasing the functionality of urban systems. Many smart technologies have been conducted and security issues have become a major challenge in this urbanization efforts. In this paper a security system for smart buildings/homes is proposed. In this system the security is constructed with the use of Wireless Sensor Networks. To increase the efficiency of the system a smart deployment of the nodes is proposed with the use of Genetic
Fig. 5. Coverage Rate of the Proposed System with 15 nodes
Algorithms by using a minimum number of sensor nodes. It is an easy task to increase the coverage area by simply increasing the number of sensor nodes. However, trivial thing is the covering the maximum are by using a minimum number of nodes. In this paper it is trying to reach this. The experimental results showed that the proposed system results a good and acceptable coverage rate with the minimum number of sensor nodes.
REFERENCES
[1] ICMA Intranets: ICMA Survey Research: 2016 Smart Cities Survey Summary Report,” unpublished. [Online]. Available:https://icma.org/documents/icma-survey-research-2016-smart-citiessurvey-summary-report
[2] S. M. Mohamed, H. S. Hamza and I. A. Saroit, “Coverage in Mobile Wire-less Sensor Networks (M-WSN): A Survey,” Computer Communications, vol. 110, pp. 133-150, 2017.
[3] O. Zorlu and O. K. Sahingoz, ”Increasing the coverage of homogeneous wireless sensor network by genetic algorithm based deployment,” 2016 Sixth International Conference on Digital Information and Communication Technology and its Applications (DICTAP), 2016, pp. 109-114. [4] Y. -C. Wang , C.-C. Hu , Y.-C. Tseng, ”Efficient deployment algorithms
for ensuring coverage and connectivity of wireless sensor networks,” in Proc. 2005 1st International Conference on Wireless Internet, pp. 1-550. [5] R. Mulligan, “Coverage in wireless sensor networks: a survey”, Network
Protocols and Algorithms , vol. 2, pp. 27-53 , 2010.
[6] G. Fan and S. Jin, “Coverage Problem in Wireless Sensor Network: A Survey,” Journal of Networks ,vol. 5, pp. 1033-1040.
[7] H. Cam, O. K. Sahingoz, and A. C. Sonmez, “Wireless sensor networks-based on publish/subscribe messaging paradigms,” in Advances in Grid and Pervasive Computing, 2011, pp. 233–242.
[8] M. Younis, K. Akkaya, “Strategies and techniques for node placement in wireless sensor networks: a survey,” Ad Hoc Networks, vol. 6, pp. 621–655,2008.
[9] Z. Fei,B. Li, S. Yang,C. Xing, H. Chen and L. Hanzo, “A survey of multi-objective deployment in wireless sensor networks: Metrics, Algorithms and Open Problems,” IEEE Communications Surveys Tutorials, vol. 19 (1) pp. 1–38 , 2017.
[10] M. S. A. Mellouk, “Deploying Wireless SensorNetworks”, 1st ed.,ISTE Press - Elsevier 2016, pp. 1-120.
[11] Y. Tekin and O. K. Sahingoz, ” A publish/subscribe messaging systemfor wireless sensor networks,” in 2016 Sixth International Conference on Digital Information and Communication Technology and its Applications (DICTAP), pp. 114-121.