Şekil 4: Yıllara Göre Çelik Hatları Gösterir Tematik Harita
5. SONUÇ
İGDAŞ sahip olduğu altyapısı ile büyük bir varlık oluşturmakta ve bu varlığın doğru ve güvenli yönetilmesi önem arz etmektedir. CBS bu doğalgaz varlıklarının yönetilmesinde önemli rol almaktadır.
Varlık yönetiminde elde edilen konumsal verilerin ve bu verilerle ilişkili sözel verilerin toplanması, saklanması, işlenmesi, sorgulanması, analiz edilmesi, akıllı kararlar verilebilmesi ve kullanıcıya bir bütünlük içerisinde sunulması etkin bir şekilde CBS kullanılmasıyla mümkündür. Yönetimlerin karar alma sürecinde veri(bilgi) önemlidir. CBS veriye(bilgiye) dayalı yönetim anlayışı oluşturan bir karar-destek sürecidir.
Proje, yapım, devreye alma, işletme ve bakım gibi bütün birim ve süreçlerin içerisinde verilerin işlenildiği ve kullanıldığı ilişkisel bir CBS’nin temellerini atıp, uygulamaya geçirmek varlık yönetimi için gereklidir. Böylece CBS’de iş emirlerini takip etmek ve acil müdahaleleri izlemek için kurumsal farkındalık sağlayarak, varlık verileri ve diğer önemli bilgiler arasında bağlantı kolaylaşmış olur.
İGABİS doğalgaz varlıklarının yönetiminde mevcut yazılım ve donanımlarla, 15 yılı aşkın tecrübesi ve geliştirdiği uygulamalarla İGDAŞ’a birçok kolaylık sağlamıştır. Sektöre sağladığı bu kolaylıkların sürdürülebilir olması için teknolojinin getirdiği yenilikleri CBS’ye etkin bir şekilde uyarlaması gerekmektedir.
6. KAYNAKLAR
[1] Fortune Dergisi, (2010) Temmuz, Türkiyenin En Büyük Şirketleri, Türkiye.
[2] Yıldız, G, Aydınoğlu (2011), AÇ “Altyapı Bilgi Sisteminde Adresin Önemi ve İstanbul Örneği. [3] Resmi Gazete (2006), “Adres Ve Numaralamaya İlişkin Yönetmelik”, Sayı:26245, 31.07.2006. [4] İGDAŞ, WEB Sitesi, www.igdas.com.tr(gisweb.igdas.com.tr)
[5] IGRAS Teknik Şartnamesi
GETTING SMARTER ABOUT MITIGATING ENERGY LOSSES Yvon Fichen1
1. Marketing Department
Itron Yvon Fichen
Senior Product Manager, C&I Electricity Metering [email protected]
SUMMARY
The merits of using smart metering and analytics to identify and remediate major energy losses.
ABSTRACT
Energy loss is a real issue that can have significant financial and environmental impacts for utilities and their customers. It is easier and more cost-effective to directly tackle the problem of losses rather than investing in new production methods. According to the World Bank, it is three times cheaper to save 1 kWh of electricity by improving the efficiency of the distribution network than investing in a new way of producing this kWh. In addition, the World Energy Council identifies non-technical losses and high non-recovery rates as one of the most important factors contributing to financial losses.
In Turkey, utilities are also facing these types of challenges and have put in place actions in order to address these concerns. Nevertheless, there is still more to be done.
Investment in smart metering solutions can help address the issue of both technical and non-technical losses. For instance, smart metering solutions can help:
Locate and analyse energy losses on the network
Analyse and optimise network
infrastructure
Detect tampering conditions Ensure proper billing
Identify consumption anomalies and discrepancies
This paper will highlight new ways to address energy losses, such as energy diversion detection and energy balance assessment. It will also demonstrate how utilities can experience significant cost-savings. It will detail specific examples of their energy losses in action and discuss how to identify and remediate operational problems based on Itron’s insight and experience, combined with our smart metering solutions and consulting services.
ÖZETÇE
Enerji kaybı; idareler ve abonelerine ciddi finansal ve çevresel etki yapabilecek reel bir sorundur. Yeni üretim metotlarına yatırım yapmaktansa kayıp sorunu ile direkt olarak mücadele etmek daha kolay ve uygun maliyetlidir. Dünya Bankasına göre, dağıtım şebekesinin verimliliğini geliştirerek 1 kWh elektrik tasarrufu sağlamak, aynı miktar elektriği yeni üretim metotları ile üretmekten üç kat daha ekonomiktir. Ek olarak, Dünya Enerji Konseyi teknik olmayan kayıplar ve geri kazanımı olmayan oranların finansal kayıplarda payı olan en önemli etkenler olarak tanımlar.
Türkiye’de, idareler de bu tip zorluklar ile karşılaşmaktadır ve bu sorunların üzerine eğilmek için eylemler gerçekleştirmiştir. Yine de daha fazla yapılacaklar vardır.
Akıllı ölçüm çözümlerine yatırım yapmak hem teknik hem de teknik olmayan kayıp sorununun irdelenmesinde yardımcı olabilir. Örneğin, akıllı ölçüm çözümleri şu durumlara yardımcı olabilir:
Şebekedeki enerji kayıplarının yerini saptamak ve analiz etmek
193 ICSG ISTANBUL 2014 8/9 May, 2014 ICSG İSTANBUL 2014 8/9 Mayıs, 2014
PROCEEDING BOOK
Şebeke altyapısını analiz edip iyileştirmek Müdahale durumlarını tespit etmek Doğru faturalandırmayı sağlamak Tüketim anormallikleri ve uyuşmazlıklarını
tespit etmek
Bu bildiri, enerji kayıplarının üzerine gitmede enerji sapma tespiti ve enerji balans değerlendirmesi gibi yeni metotlara vurgu yapacaktır. Aynı zamanda idarelerin nasıl belirgin maliyet tasarrufu yapabileceklerini gösterecektir. İdarelerin enerji kayıplarını spesifik örnekler ile detaylandırıp, Itron’un anlayış ve deneyiminin akıllı ölçüm çözümlerimiz ve danışmanlık hizmetlerimiz ile birleştirerek operasyonel sorunları nasıl tanımlayıp iyileştirebileceğini ele alacaktır.
1. INTRODUCTION
Energy loss is a real issue that can have significant financial impacts on utilities and their customers. The International Energy Agency estimates global energy losses close to 0.3 billion gigatonne of oil equivalent (Gtoe) per year [1] representing approximately 17 percent of global energy production. This translates into huge revenue losses for utilities worldwide.
Directly tackling the problem of losses is much easier and cost-effective than investing in new production methods. According to the World Bank, it is three times cheaper to save 1 kWh of electricity by improving the efficiency of the distribution network than investing in a new way of producing 1 kWh of energy[2]. In addition, the World Energy Council identifies non-technical losses and high non-recovery rates among the most important factors contributing to financial losses. Two components make up total revenue losses: technical and non-technical losses. Non-technical losses include mainly theft or diversion, but also losses due to poor equipment maintenance, calculation errors, accounting mistakes and losses caused by metering systems. Technical losses relate to how the system works and mainly consist of power dissipation that occur naturally in
electricity system such as line losses and heating losses at the transformer.
In most countries, energy losses are a major concern. With energy rates expected to rise, this concern will only continue to grow. In developing regions, huge losses are often reported up to 30 percent. Therefore, mitigating energy losses is vital for all utilities.
In Turkey, the Energy Market Regulatory Authority (EPDK) reports that in 2012 total losses were at an average of 14 to 15 percent with non-technical losses around seven to eight percent. Despite having put in place actions to address these losses, there is still more to be done especially in certain areas of Turkey where losses amount to over 50 percent.
2. USING ANALYTICS TO UNCOVER LOSSES
In general, utilities lack information on where losses occur. With smart metering technology and data analytics1, utilities can discover sources of energy losses and take action. By using data analytics and optimization tools, utilities can discover behavioral patterns and find innovative approaches to uncover theft and energy diversion,
and reveal malfunctioning meters that generate revenue losses. Analytics can also help utilities discover those segments of their networks with the lowest efficiency.
1 Analytics is commonly used for Data Analysis and Optimization Tools.
That said, analytics are only as good as the quality of the data being used. Detailed, quality data from smart meters, collected by reliable software systems and managed by powerful data systems, is key. Having a richer data set enables more robust data filters and algorithms, which in turn improves the chances of finding true cause and effects. In addition to consumption and event data from smart meters, other important data sources include, but are not limited to, CIS (Customer Information Systems), work order management and inventory management systems, and weather and real estate information.
Utilities can use these various data sources to get a better picture of their system and identify and prevent losses. When it comes to mitigating energy loss, analytics are particularly helpful for energy diversion detection and energy balance assessment. 2.1. Energy diversion detection
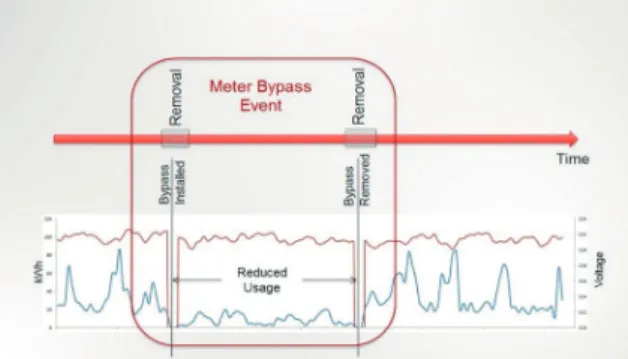
Energy diversion, the actual criminal interference with the energy grid, comes in many different forms. It can include tampering with the meter, removing the meter from the base, bypassing the meter partly or altogether, or tapping directly into the distribution lines. Aside from loss of revenue, these potentially dangerous energy diversion practices can threaten not only the perpetrator’s lives, but also those of people working or living close to such a site.
Diversion can originate at the meter or along the distribution or transmission lines at substations, transformers and banks. This situation might require a broader analytics solution that pulls information from more data sources to identify energy losses from electricity generation to consumption. This could go beyond the standard data sources such as smart meter readings and tamper alerts (Figure 1).
Figure 1: Combine analytic events and smart meter readings for more insight
Analytics play an important role in combatting energy diversion, replacing previous methods of theft detection. Utilities that move from a manual meter reading system to a smart meter system lose their eyes and ears in the field to discover
diversion. In a manually read meter system, the majority of leads come from the meter readers in the field. This information gets lost when moving to smart meters, which don’t require direct contact with the meter after installation. The lack of utility representatives in the field increases the gap between the utility and the customer and reduces firsthand knowledge of what is occurring in the system. In many countries, field inspections are dangerous for the utility workers, hence the desire to deploy solutions that reduce and better target the number of field inspections. What better way than by using information from existing data sources to investigate accounts on a regular basis? This is where analytics come in. With analytics, utilities can discover behavioral patterns and identify energy diversion and losses remotely. Nevertheless, confirmation requires a field visit. While energy losses can be caused by illegal action, approximately half of lost revenues actually come from malfunctioning meters. Electromechanical meters begin to slow down over time and no longer measure consumption correctly. Malfunctioning equipment can also be identified with analytics.
Figure 2: GIS (Geographic Information System) representation is key for efficient targeting and corrective actions.
2.2. Energy balance assessment
An energy balance assessment is another way for utilities to identify energy losses. In electricity distribution networks, energy flows are often metered at residential and commercial and industrial (C&I) end-user delivery points as well as at medium-voltage feeders that are outgoing from high/medium voltage (HV/MV) substations. The difference of energy levels between these two
ICSG İSTANBUL 2014 8/9 Mayıs, 2014 ICSG ISTANBUL 2014 8/9 May, 2014 194
BİLDİRİ KİTABI
Şebeke altyapısını analiz edip iyileştirmek Müdahale durumlarını tespit etmek Doğru faturalandırmayı sağlamak Tüketim anormallikleri ve uyuşmazlıklarını
tespit etmek
Bu bildiri, enerji kayıplarının üzerine gitmede enerji sapma tespiti ve enerji balans değerlendirmesi gibi yeni metotlara vurgu yapacaktır. Aynı zamanda idarelerin nasıl belirgin maliyet tasarrufu yapabileceklerini gösterecektir. İdarelerin enerji kayıplarını spesifik örnekler ile detaylandırıp, Itron’un anlayış ve deneyiminin akıllı ölçüm çözümlerimiz ve danışmanlık hizmetlerimiz ile birleştirerek operasyonel sorunları nasıl tanımlayıp iyileştirebileceğini ele alacaktır.
1. INTRODUCTION
Energy loss is a real issue that can have significant financial impacts on utilities and their customers. The International Energy Agency estimates global energy losses close to 0.3 billion gigatonne of oil equivalent (Gtoe) per year [1] representing approximately 17 percent of global energy production. This translates into huge revenue losses for utilities worldwide.
Directly tackling the problem of losses is much easier and cost-effective than investing in new production methods. According to the World Bank, it is three times cheaper to save 1 kWh of electricity by improving the efficiency of the distribution network than investing in a new way of producing 1 kWh of energy[2]. In addition, the World Energy Council identifies non-technical losses and high non-recovery rates among the most important factors contributing to financial losses. Two components make up total revenue losses: technical and non-technical losses. Non-technical losses include mainly theft or diversion, but also losses due to poor equipment maintenance, calculation errors, accounting mistakes and losses caused by metering systems. Technical losses relate to how the system works and mainly consist of power dissipation that occur naturally in
electricity system such as line losses and heating losses at the transformer.
In most countries, energy losses are a major concern. With energy rates expected to rise, this concern will only continue to grow. In developing regions, huge losses are often reported up to 30 percent. Therefore, mitigating energy losses is vital for all utilities.
In Turkey, the Energy Market Regulatory Authority (EPDK) reports that in 2012 total losses were at an average of 14 to 15 percent with non-technical losses around seven to eight percent. Despite having put in place actions to address these losses, there is still more to be done especially in certain areas of Turkey where losses amount to over 50 percent.
2. USING ANALYTICS TO UNCOVER LOSSES
In general, utilities lack information on where losses occur. With smart metering technology and data analytics1, utilities can discover sources of energy losses and take action. By using data analytics and optimization tools, utilities can discover behavioral patterns and find innovative approaches to uncover theft and energy diversion,
and reveal malfunctioning meters that generate revenue losses. Analytics can also help utilities discover those segments of their networks with the lowest efficiency.
1 Analytics is commonly used for Data Analysis and Optimization Tools.
That said, analytics are only as good as the quality of the data being used. Detailed, quality data from smart meters, collected by reliable software systems and managed by powerful data systems, is key. Having a richer data set enables more robust data filters and algorithms, which in turn improves the chances of finding true cause and effects. In addition to consumption and event data from smart meters, other important data sources include, but are not limited to, CIS (Customer Information Systems), work order management and inventory management systems, and weather and real estate information.
Utilities can use these various data sources to get a better picture of their system and identify and prevent losses. When it comes to mitigating energy loss, analytics are particularly helpful for energy diversion detection and energy balance assessment. 2.1. Energy diversion detection
Energy diversion, the actual criminal interference with the energy grid, comes in many different forms. It can include tampering with the meter, removing the meter from the base, bypassing the meter partly or altogether, or tapping directly into the distribution lines. Aside from loss of revenue, these potentially dangerous energy diversion practices can threaten not only the perpetrator’s lives, but also those of people working or living close to such a site.
Diversion can originate at the meter or along the distribution or transmission lines at substations, transformers and banks. This situation might require a broader analytics solution that pulls information from more data sources to identify energy losses from electricity generation to consumption. This could go beyond the standard data sources such as smart meter readings and tamper alerts (Figure 1).
Figure 1: Combine analytic events and smart meter readings for more insight
Analytics play an important role in combatting energy diversion, replacing previous methods of theft detection. Utilities that move from a manual meter reading system to a smart meter system lose their eyes and ears in the field to discover
diversion. In a manually read meter system, the majority of leads come from the meter readers in the field. This information gets lost when moving to smart meters, which don’t require direct contact with the meter after installation. The lack of utility representatives in the field increases the gap between the utility and the customer and reduces firsthand knowledge of what is occurring in the system. In many countries, field inspections are dangerous for the utility workers, hence the desire to deploy solutions that reduce and better target the number of field inspections. What better way than by using information from existing data sources to investigate accounts on a regular basis? This is where analytics come in. With analytics, utilities can discover behavioral patterns and identify energy diversion and losses remotely. Nevertheless, confirmation requires a field visit. While energy losses can be caused by illegal action, approximately half of lost revenues actually come from malfunctioning meters. Electromechanical meters begin to slow down over time and no longer measure consumption correctly. Malfunctioning equipment can also be identified with analytics.
Figure 2: GIS (Geographic Information System) representation is key for efficient targeting and corrective actions.
2.2. Energy balance assessment
An energy balance assessment is another way for utilities to identify energy losses. In electricity distribution networks, energy flows are often metered at residential and commercial and industrial (C&I) end-user delivery points as well as at medium-voltage feeders that are outgoing from high/medium voltage (HV/MV) substations. The difference of energy levels between these two
195 ICSG ISTANBUL 2014 8/9 May, 2014 ICSG İSTANBUL 2014 8/9 Mayıs, 2014
PROCEEDING BOOK
points provides the efficiency – or total losses – over the area distributed from every HV/MV substation. The results show average losses over tens of thousands of customers and hundreds of distribution transformers, mapping the system efficiency.
In order to increase the visibility of the efficiency map, the intermediate level of the distribution transformer (MV/LV) station should be monitored by a C&I meter, also known as a check meter. This meter is usually a smart industrial meter designed for quick and easy installation without disrupting the power supply. A periodic reading will provide very accurate daily, weekly or monthly active energy delivered from the distribution transformer. Utilities should also build, verify and maintain a database linking a distribution transformer with its low voltage customers connected downstream. On the low voltage customer side, three main types of meters are in use: smart meters usually featuring time-of-use and automatic billing capabilities; conventional meters read manually; and prepayment meters where kilowatt-hours are time-stamped at purchase and not at consumption. These customer consumptions, while not entirely synchronous, may still be normalized, for instance, by daily average consumption. The total metered consumption of the entire population downstream from a transformer can be aggregated and cumulated monthly or quarterly.
Once delivered and metered figures are available, analytics reports show the total loss for each distribution sub-segment, down to the low voltage distribution transformer. With known technical losses documented for every sub-segment, non-technical losses may be extracted. As a result, utilities have a powerful tool to identify, localize and benchmark the low voltage losses, set up improvement programs and measure their results.
Figure 3: Daily usage analysis
In addition, when aggregated with the metering data from the medium voltage industrial customers, check meters enable the narrowing down of total losses estimated on the medium voltage level.
Finally, the meter can provide valuable information about the loading of the distribution transformer, thus contributing to technical losses reduction program and also preserving the lifetime of the assets.
3. REDUCING ENERGY LOSSES TODAY AND INTO THE FUTURE Revenue losses cannot be solved by one measure alone. They require a comprehensive solution. Smart meters or prepaid metering help in reducing technical losses and should be an integral part of a revenue protection system, but are not all encompassing. A comprehensive approach should include hardening of the distribution network and smart meters, understanding the impact of tariffs, providing education and cultural awareness, and integrating with the back office systems such as billing and collection. At the very core of such a system lies analytics, and it should link all the information from these various sources to provide answers and insights, reducing non-technical losses in an effective and meaningful way. The financial benefits of such an application can often pay for itself within one or two years. Analytics, customized to the specific regional and commodity loss situation, in combination with other loss measures such as smart meters, can be the first step toward arriving at a place where non-technical and financial losses are effectively identified and eliminated.
4. BIBLIOGRAPHY
[1] International Energy Agency, Key World Energy Statistics 2009
[2] The World Bank, Energy Efficiency: Optimization of Electric Power Distribution
System Losses
ALTYAPI BİLGİ SİSTEMLERİ VE CBS ENTEGRASYONLARI UTILITY INFORMATION SYSTEMS AND GIS INTEGRATION
Tuncay KÜÇÜKPEHLİVAN Başarsoft Bilgi Teknolojileri A.Ş.
[email protected] ÖZETÇE
Coğrafi Bilgi Sistemleri, Elektrik, Su, Gaz dağıtım ve Telekom gibi Altyapı organizasyonlarının planlama ve işletme sırasında kullanılan haritaların sayısal olarak kullanılması ile bu organizasyonlarda yerini almış ancak zaman içinde organizasyon içindeki diğer bilgi sistemleri ile entegre olup sistemin kalbi olabilecek bir pozisyona gelmiştir. Bu bildiride kurum içinde Coğrafi Bilgi Sistemlerinin konumu, hangi fonksiyonel ihtiyaçları nasıl karşıladığı ve diğer sistemlerle arasındaki entegrasyonun nasıl olduğu ve Türkiye’deki pratik örnekleri incelenmiştir.
ABSTRACT
Geographic Information Systems, has been positioned as a replacement of old paper maps that are used in planning and operation with digital maps in Electricity, Water, Gas Distribution and Telecom Companies, meanwhile it became heart of the systems also integrating to the other IT systems in the organizations. In this paper, the position of in-house Geographic Information Systems, what functional needs that they serve and how they are integrated with other systems have been studied with practical examples in Turkey. 1. GİRİŞ
Altyapı Organizasyonlarının tamamında haritalar her zaman önemli bir araç olmuştur. Altyapı yatırımlarının planlanması, yatırımlarının gerçekleştirilmesi, yatırımların işletilmesi ve bakımı gibi tüm aşamalarda çeşitli ölçekte, formatta ve içerikte haritalar kullanılmaktadır. Dolayısı ile Coğrafi Bilgi Sisteminden(CBS) ilk beklenti öncelikle kâğıt ortamında bulunan bu verilerin sayısal ortama aktarılması olmuştur. Planlamacılar ise bu sayısal haritalar üzerinde yaptıkları mühendislik hesaplamaları dâhil birçok iş yükünün CBS tarafından karşılanmasını talep etmişlerdir. Ancak kâğıt ortamındaki verilerden sayısal ortama geçiş bile yıllar sürmüştür. CBS nin kurumlar içinde kabul görmesi ve başka birçok amaca hizmet edeceğinin düşünülmesi ise ancak tüm bu verilerin CBS ortamına aktarılması sonrasında gündeme gelebilmiştir.
2. SAYISAL DEVRİM: KAĞITDAN TABLETE Bilgisayarların iş hayatına girişinden sonra defterlerde ve dosyalarda yürüyen her işin sayısal ortama aktarılması süreci Altyapı organizasyonlarında da kâğıt ortamdaki paftaların sayısal ortama aktarılması ihtiyacı olarak ortaya çıkmıştır. Özellikle A0 boyutundaki 1/1000 imar planları üzerinde planlama yapılması süreci ile kullanılmaya başlanan paftaların imalat sonrasında işletmeye devredilmesi ve altyapı sistemindeki değişikliklerin bu paftalar üzerinde güncellenmesi sonucunda arşivlerde binlerce paftanın
saklanması, farklı versiyonlarının oluşması ve hatta zaman içinde aynı yere ait farklı kişiler tarafından farklı zamanlarda üretilmiş paftaların kullanımı ile arşivlerde hangisi güncel belli olmayan binlerce Kâğıt paftanın birikmesine yol açmıştır. Bu haritaların yönetilmesi bile başlı başına bir problemdir. Sayısal ortamdaki paftaların güncellenmesi ve paylaşımı daha kolay olduğu için CAD yazılımları bu organizasyonlarda bireysel gayretler ile kullanılmaya başlanmış ancak bu yazılımlardan üretilen paftaların kullanımı hala devam ettiğinden bütüncül bir çözüm ancak CBS ’nin kullanımı ile mümkün hale geldiği görülmüştür.
2.1. Sayısallaştırma
Sahadaki envanterini güncel tutma konusunda başarılı olan organizasyonlar için CBS oluşturmadaki ilk seçenek ellerinde mevcut bulunan paftaların sayısallaştırması olmuştur. Örneğin Türk Telekom sahada yapılan tüm işlemleri harita üzerinde güncel bir şekilde kaydettiğinden kurumun elinde tüm bölgelere ait yeterli sayıda pafta bulunduğu için bu veriler doğrudan
CBS altlığı oluşturmak için kullanılmıştır.
Sayısallaştırma aşamaları ise; tüm Türkiye il merkezleri için pafta anahtarının temin edilmesi, pafta anahtarının ülke koordinat sistemine dönüştürülmesi ve geliştirilen sayısallaştırma programı ile tüm verilerin çizilmesi şeklinde olmuştur. Planlama çalışmaları imar planları üzerinde yapılmakta olduğundan imar planlarının hâlihazır haritalar ile çakıştırılması ve gerekmiştir. Son yıllarda neredeyse tüm şehirlerde hâlihazır haritanın yapılmış olması, diğer taraftan da Google gibi uydu görüntülerini ücretsiz sağlayan kaynakların kullanılmaya başlanması ile birlikte artık tüm verilerin tek bir koordinat sisteminde üretilmesi ve kontrol edilmesi mümkün hale gelmiştir. Verilerin sayısal ortama taşınması ile birlikte elde edilen kazanımlar.
Herhangi bir yere ait altyapı verisine ulaşmak için saatler bazen günler süren pafta arama bulma süresi saniyelere inmiştir.
Bir yere ait birden fazla mükerrer pafta üretiminin önüne geçilmiştir.
Envanter sayımı için harcanan aylarca süre yine saniyeler mertebesine inmiştir.
ICSG İSTANBUL 2014 8/9 Mayıs, 2014 ICSG ISTANBUL 2014 8/9 May, 2014 196
BİLDİRİ KİTABI