• Sonuç bulunamadı

Indoor Surveyıng Wıth Terrestrıal Photogrammetry: A Case Study For Sırcalı Masjıd

N/A
N/A
Protected

Academic year: 2021

Share "Indoor Surveyıng Wıth Terrestrıal Photogrammetry: A Case Study For Sırcalı Masjıd"

Copied!
7
0
0

Yükleniyor.... (view fulltext now)

Tam metin

(1)

DEVELOPMENT OF 3D WEB GIS APPLICATION WITH OPEN SOURCE LIBRARY

1Muhammed Oguzhan METE, 2Dogus GULER, 3Tahsin YOMRALIOGLU

1,2,3Department of Geomatics Engineering, Istanbul Technical University, 34469, Istanbul, Turkey 1metemu@itu.edu.tr, 2gulerdo@itu.edu.tr, 3tahsin@itu.edu.tr

(Geliş/Received: 08.11.2018; Kabul/Accepted in Revised Form: 21.12.2018)

ABSTRACT: Today, thanks to the internet connection, the borders are disappearing and accessing information is more comfortable. Besides desktop applications, number of web-based applications which instant changes can be seen by all users are increasing day by day. The diversity of web-based applications that are currently used in presenting spatial information to users is also progressing. Using open source libraries, developers can develop web applications for their own purposes. Three dimensional (3D) visualization on the web is a commonly used approach in geographic information systems (GIS) applications. In this article, a 3D web application is developed using Cesium open source javascript library. Vector data layers containing attribute data on global, country and city scales are visualized on the web application. Moreover, raster data layers which produced in other projects like GIS-based land valuation application is also visualized in three dimension. It is pointed out that the output products obtained from different studies can be accessed and visualized through the web browser without installing an additional program or add-ons on the users' computers.

Key Words: Cesium, Geographic information systems, GIS, Javascript, Open source library, WebGL, 3D

Açık Kaynak Kodlu Kütüphane İle 3B Web CBS Uygulaması Geliştirilmesi

ÖZ: Günümüzde internet sayesinde sınırlar ve engeller ortadan kalkmış ve bilgiye erişim kolay hale gelmiştir. Masaüstü uygulamalarnın yanısıra, tüm kullanıcılar tarafından anlık değişikliklerin görülebildiği web tabanlı uygulamaların sayısı gün geçtikçe artmaktadır. Mekânsal bilgilerin kullanıcılara sunulduğu çeşitli web tabanlı uygulamalar da yaygınlaşmaktadır. Açık kaynak kütüphanelerini kullanarak geliştiriciler amaca göre web uygulamaları geliştirebilmektedirler. Web tabanlı üç boyutlu (3B) görselleştirme, coğrafi bilgi sistemleri (CBS) uygulamalarında yaygın olarak kullanılan bir yöntemdir. Bu makalede, açık kaynaklı javascript kütüphanesi Cesium kullanılarak 3B web CBS uygulaması geliştirilmiştir. Web uygulamasında global, ülke ve şehir ölçeklerinde öznitelik bilgileri içeren vektör veri katmanları görselleştirilmiştir. Ayrıca en uygun yer seçimi ve CBS ile taşınmaz değerleme gibi farklı projeler sonucunda üretilen raster veri katmanları da üç boyutlu olarak görselleştirilmiştir. Kullanıcıların, farklı çalışmalardan elde edilen çıktı ürünlerine bilgisayarına ek bir yazılım veya eklenti kurmadan, web tarayıcısı üzerinden erişilebileceği vurgulanmaktadır.

Anahtar Kelimeler: Cesium, Coğrafi bilgi sistemleri, CBS, Javascript, Açık kaynaklı kütüphane, WebGL, 3D

INTRODUCTION

Although the Internet was developed for military purposes, it has globalized and evolved into many other areas like trade, academia, information sharing in public institutions (Yomralıoğlu, 2000). Widespread internet usage has led to sharing data and information easily all over the world. This technological development has made possible to visualize, create, store and share spatial data on the

(2)

web and has emerged Web GIS notion. Web GIS has many advantages when compared to desktop GIS. The applications that have been made for various purposes on the internet which can be used easily without a GIS software. The users can access the current database 24 hours a day, 7 days a week at a low cost with a computer connected to the internet and a web browser. Moreover, users on different platforms can use the data concurrently. Spatial queries and analysis like the nearest distance, an optimum transportation route can be made easily on the web.

The third dimension on maps gives the opportunity to get some details, increase the readability of the map, and provide reality. We need 3D data to manage cities more sustainable. It is significant to create, visualize, store, analyze and share the 3D data for better decision making, planning or solving problems. Lately, the 3D representations of data on the web increasingly have gained importance. Since it does not require any additional software or plugin to visualize and analyze the data, 3D Web GIS has become very popular and integral part of the geospatial community. Several industries such as real estate, tourism, geo-advertising, smart cities take advantage of 3D web maps.

Javascript is a programming language that enables creating interactive and dynamic web pages supported by popular web browsers like Chrome, Firefox, Edge, Opera, Safari. It can be operated on the web without using any plug-in since almost every browser support javascript. Furthermore, JavaScript Application Programming Interfaces (APIs) widely used for creating Web GIS applications. A new approach has seen for 3D Web GIS applications with the development of HTML5 and Web Graphics Library (WebGL) technologies. WebGL allows GPU-accelerated usage of physics and image processing and it is integrated into all the web standards of the browser (Miao et al.,, 2017). In order to render interactive 2D and 3D graphics within any web browser, WebGL JavaScript API can be used.

Visualization of 3D data on the web has been intriguing topic recently (Kahkonen et al., 1999; Huang et al., 2001; Huang and Lin, 2002; Billen et al., 2008). With the emergence of WebGL, open source javascript libraries and frameworks, compatible web browsers have enabled more complicated visualizations of 3D geospatial data visualization, increased performance and it has become widespread on web applications. (Christen et al., 2012; Gesquiere and Manin, 2012, Resch et al., 2014; Rumor et al., 2014; Krooks et al., 2014; Kramer and Gutbell, 2015).

There are many map libraries for rendering 3D graphics on the web like Cesium JS, WebGL Earth JS API, ArcGIS API for JS, OSM Buildings GL, Vizicities, Tangram, Nasa Java World Wind, wrld3d. In this paper, Cesium JS 3D Map Library is used for creating 3D Web GIS application. Cesium was developed by an open-source community with the Cesium Consortium. Cesium JS uses WebGL for creating 3D globes and 2D maps in a web browser without using a plugin. Since it provides virtual globes with time dynamic 3D visualization of geospatial data, Cesium is functional 3D map library in terms of performance and features when compared with other libraries and frameworks (Chaturvedi et al., 2015).

In this study, it is aimed to visualize different vector and raster geospatial data types on the web in 3D. Besides 3D data, city model tour flight is created and visualized with time information in 4D. Visualizing various applications in different scales has made possible to measure performance and efficiency of Cesium open source javascript library.

MATERIAL AND METHODS

3D web mapping library Cesium is based on WebGL. Hence, it is independent of browsers and platforms. 2D, 3D, and 4D spatiotemporal data can be visualized efficiently by means of WebGL with Three.js framework implementation. WebGL can display many data points since it has direct access to the computing unit of the graphics card. Cameras, shaders, and lights to draw lines, spheres, particles, or a plane and some other tools for the representation of the data is provided for developers and many distinct features such as appearance, field of view for the scene, color, texture or size of objects can be easily managed with Three.js (Resch et al., 2014).

(3)

Cesium supports many open data formats for 3D rendering. To provide interoperability, Cesium visualizes geospatial data through OGC standards (Prandi et al., 2015).. Using standard data formats like TopoJSON, GeoJSON, and KML, Cesium provides building 3D map applications by supplying expressive tools. Moreover, an open-source community with the support of Cesium Consortium developed data formats which they weren’t available for 3D rendering like CZML, 3D Tiles, glTF, and quantized-mesh. CZML is a JSON schema that provides temporal 3D scenes, such as of satellites, and aircraft. 3D Tiles is a description for visualizing huge 3D geo-datasets like photogrammetry, CAD, and 3D building models. 3D Tiles describe a spatial data structure and a set of tile formats designed for 3D and optimized for streaming and rendering. glTF is an open standard 3D runtime asset format. It can be described as JPEG for 3D. Quantized-mesh provides efficient 3D terrain streaming and rendering. In this paper GeoJSON and glTF data formats used to create 3D web map application. Gross Domestic Product (GDP) Per Capita and population statistics of countries have gathered for 2000, 2010 and 2017 years from World Bank Open Data to visualize on Cesium 3D globe. Figure 1 shows Turkey’s GDP Per Capita in 2016.

Figure 1. Turkey’s Gross Domestic Product (GDP) Per Capita

In addition, the population of Turkey’s provinces and a population of Istanbul’s districts were visualized on the 3D globe to test the performance of the application in different data scales (Figure 2-3).

GDP Per Capita and Population data can be visualized according to different years using pop-up buttons at the top of the application page. It is also possible to create CZML data for 4D temporal data to analyze the change in ten year periods for both statistics. Furthermore, nominal land values of Istanbul province were visualized as 3D model in glTF data format on Cesium globe. Figure 4 presents the nominal land values of Istanbul city. In order to convert raster data to glTF format, a three.js library, the Qgis2Threejs plugin was used. It is a python plugin that provides the capability of exporting terrain data, map canvas images and vector data to the browsers benefitting from WebGL (Evangelidis et al., 2018).

(4)

Figure 2. The population of Turkey provinces in 2010

Figure 3. The population of Istanbul province in 2017

Since Cesium provides data interoperability, the projects which are created with using other platforms can be integrated easily. 3D Nominal Land Values of Istanbul City Project is visualized with Cesium JS. The model is created as pixel-based raster data. In order to visualize it on 3D Cesium globe, raster data converted to glTF format using a three.js library, Qgis2Threejs. glTF data format provides visualization of raster data but users cannot query on the data.

It is possible to create aircraft and drone tour models, animations with Cesium JS. In order to scout sample geocache locations in New York, 3D city model is visualized in Cesium. The model has 1.1 million OSM buildings. In figure 5, New York 3D City Model tour is shown in drone view.

(5)

Figure 4. 3D Nominal Land Values of Istanbul province

Figure 5. 3D Model of New York City in Drone View RESULTS AND DISCUSSIONS

Visualization 3D data on the web has become very popular nowadays. There are many libraries and frameworks provide 3D data visualization on the web. Cesium JS is an open source javascript package supporting WebGL which is an extension of HTML5. Cesium provides effective and coherent 3D data visualization without any plugin. It is possible to visualize point clouds, photogrammetry models, CAD/BIM models, KML + COLLADA, CityGML, OpenStreetMap, shapefiles data on Cesium. Cesium is one of the most used 3D web mapping library. It has manual, code examples, very active help forum and

(6)

a wide user community. In 3D web GIS application, visualizing various geospatial data in different scales made possible to measure performance and efficiency of Cesium open source javascript library. Cesium suffers from javascript limitations and performance issues. Performance of Cesium can vary on different browsers because of different javascript engines implementation. Therefore, it can fail to render big 3D city models. However, it shows good performance in GeoJSON data visualization. It provides fluent visualization and quick attribute query of GeoJSON data format. Since it is open source, it does not require additional software or plugin, it has a wide community, active help forum, and clear manual, Cesium JS is a good alternative for 3D data visualization on the web.

CONCLUSIONS

Third-dimensional data is widely used in many areas such as smart cities, real estate, tourism, planning etc. It is beneficial to visualize it on the web without any additional software or plugin. Thanks to WebGL, 3D geospatial data can be visualized on the web using javascript mapping libraries. Cesium supports many open formats to visualize 2D, 3D and 4D data. In this paper, in order to test GeoJSON and glTF data formats, GDP Per Capita of countries, population, and nominal land value model data are used for 3D visualization on Cesium globe. Further, Cesium JS library provides efficient 4D temporal data, creating animations and mobile 3D scenes. To conclude, Cesium is consistent 3D javascript web mapping library. Using WebGL, it makes possible to visualize 3D data on the globe on a browser without any plugin.

REFERENCES

ArcGIS API for JS. Available online: https://developers.arcgis.com/javascript/, accessed on 14 September 2018.

Billen, M.I., Kreylos, O., Hamann, B., Jadamec, M.A., Kellogg, L.H., Staadt, O., Sumner, D.Y., 2008, “A Geoscience Perspective on Immersive 3D Gridded Data Visualization”, Computers & Geosciences, Vol. 34 (9), pp. 1056–1072.

Cesium.js. Available online: https://cesiumjs.org , accessed on 14 September 2018.

Chaturvedi, K., Yao, Z., Kolbe, T. H., 2015, “Web-based Exploration of and Interaction with Large and Deeply Structured Semantic 3D City Models using HTML5 and WebGL”, In Bridging Scales-Skalenübergreifende Nah-und Fernerkundungsmethoden, 35. Wissenschaftlich-Technische Jahrestagung der DGPF.

Christen, M., Nebiker, S., Loesch, B., 2012, “Web-Based Large-Scale 3D-Geovisualisation using WebGL: The OpenWebGlobe Project”, International Journal of 3-D Information Modeling (IJ3DIM), Vol. 1(3), pp. 16–25.

Evangelidis, K. Papadopoulos, T. Papatheodorou, K. Mastorokostas, P., Hilas, C., 2018, “3D Geospatial Gesquiere, G., Manin, A., 2012, “3D Visualization of Urban Data based on CityGML with WebGL”,

International Journal of 3-D Information Modeling (IJ3DIM), Vol. 1 (3), pp. 1–15. HTML5. Available online: https://www.w3.org/TR/html5/ (accessed on 14 September 2018).

Huang, B., Jiang, B., Li, H., 2001, “An Integration of GIS, Virtual Reality and The Internet for Visualization, Analysis and Exploration of Spatial Data”, International Journal of Geographical Information Science, Vol. 15 (5), pp. 439–456.

Huang, B., Lin, H., 2002, “A Java/CGI Approach to Developing a Geographic Virtual Reality Toolkit on The Internet”, Computers & Geosciences, Vol. 28 (1), pp. 13–19.

Kahkonen, J., Lehto, L., Kilpelainen, T., Sarjakoski, T., 1999, “Interactive Visualisation of Geographical Objects on The Internet, International Journal of Geographical Information Science, Vol. 13 (4), pp. 429–438.

(7)

Kramer, M., Gutbell, R., 2015, “A Case Study on 3D Geospatial Applications in The Web using state-of-the-art WebGL Frameworks”, In: Proceedings of the 20th International Conference on 3D Web Technology. ACM, Heraklion, Greece. New York, pp. 189–197, 18–21 June 2015.

Krooks, A., Kahkonen, J., Lehto, L., Latvala, P., Karjalainen, M., Honkavaara, E., 2014, “WebGL Visualisation of 3D Environmental Models based on Finnish Open Geospatial Data Sets”, ISPRS Int. Arch. Photogrammetry Remote Sens. Spatial Inf. Sci., Vol. 1, pp. 163–169.

Miao, R., Song, J., Zhu, Y., 2017, “3D Geographic Scenes Visualization based on WebGL”, In Agro-Geoinformatics, 2017 6th International Conference on IEEE, Fairfax, VA, USA, pp. 1-6, 7-10 Aug. 2017

Nasa Java World Wind. Available online: http://worldwind.arc.nasa.gov/java/ (accessed on 14 September 2018).

OSM Buildings GL. Available online: https://osmbuildings.org/developer/ (accessed on 14 September 2018).

Prandi, F., Devigili, F., Soave, M., Di Staso, U., De Amicis, R., 2015, “3D Web Visualization of Huge CityGML Models”, Int. Arch. Photogramm. Remote Sens. Spatial Inf. Sci., XL-3/W3, pp. 601-605. doi:10.5194/isprsarchives-XL-3-W3-601-2015

Resch, B., Wohlfahrt, R., Wosniok, C., 2014, “Web-based 4D Visualization of Marine Geo-Data using WebGL”, Cartography and Geographic Information Science, Vol. 41, pp. 235–247.

Rumor, M., Roccatello, E., Scottà, A., 2014, “A Standard-Based Framework for Real-Time 3D Large-Scale Geospatial Data Generation and Visualisation over The Web, In Geodesign by Integrating Design and Geospatial Sciences, pp. 259-269, Springer, Cham.

Structured Semantic 3D City Models using HTML5 and WebGL. In Bridging Scales-Skalenübergreifende Nah-und Fernerkundungsmethoden; 35. Wissenschaftlich-Technische Jahrestagung der DGPF; Deutsche Gesellschaft für Photogrammetrie, Fernerkundung und Geoinformation (DGPF) e.V: Köln, Germany, 2015.

Tangram. Available online: https://tangrams.github.io/tangram (accessed on 14 September 2018). Three.js. Available online: https://threejs.org/ (accessed on 14 September 2018).

Visualizations: Animation and Motion Effects on Spatial Objects”, Computers & Geosciences, Vol. 111, pp. 200–212.

Vizicities, Available online: http://ww.vizicities.com/ , accessed on 14 September 2018.

WebGL Overview, Available online: https://www.khronos.org/webgl/ , accessed on 14 September 2018. WebGLEarth, Available online: https://www.webglearth.com, accessed on 14 September 2018.

wrld3d Available online: https://www.wrld3d.com/, accessed on 14 September 2018.

Yomralıoğlu, T., 2000, Geographical Information Systems, Basic Concepts and Applications, Istanbul (In Turkish).

Şekil

Figure 1. Turkey’s Gross Domestic Product (GDP) Per Capita
Figure 2. The population of Turkey provinces in 2010
Figure 5. 3D Model of New York City in Drone View  RESULTS AND DISCUSSIONS

Referanslar

Benzer Belgeler

Ali’nin ruhu teslim almaya gelme sebebi olarak “Kadın olduğu için (ululama)” ya da “kadın olmasına rağmen (değersizleştirme)” gibi belirleyici cinsi- yet unsurları

Yapılan tespit ve değerlendirmelerin sonunda Kerbela Olayı’nı anlatan pek çok hikâyenin özellikle Muharrem aylarında okunduğu veya anlatıldığı, Türkiye dışındaki

Horasânî Elifî Tâc, lengeri yani başa gelen alt kısmı dört, üst kısmı iki dilimli bir tâc olup yeşil çuhadan yapılır (Şekil 3).. Dilimlerinde, birbirine karşı yetmiş iki

Bulgular: Adenoid hipertrofisi olan ve olmayan çocuklar arasında Toplam Nazal Semptom Skoru ve Vizüel Analog Skor arasında istatiksel olarak anlamlı farklılık saptandı (p

Türlerin potansiyel dağılım alanları ve ekolojik koşulları içeren mekânsal bilgiler, tehdit altındaki habitatların korunmasına ve restorasyonuna yardımcı

Kitle iletişim araçları (KİA) ve söylen kavramları arasındaki epistemolojik bağ bu bakımdan değerlendirildiğinde; KİA ve söylenlerin tarihten günümüze

Çelik’s 18 statements regarding civil- military relations provide a clear indication that the political authority is also considering making changes not only in professional

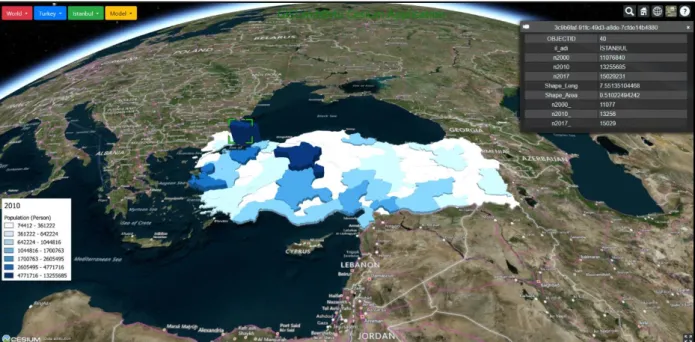
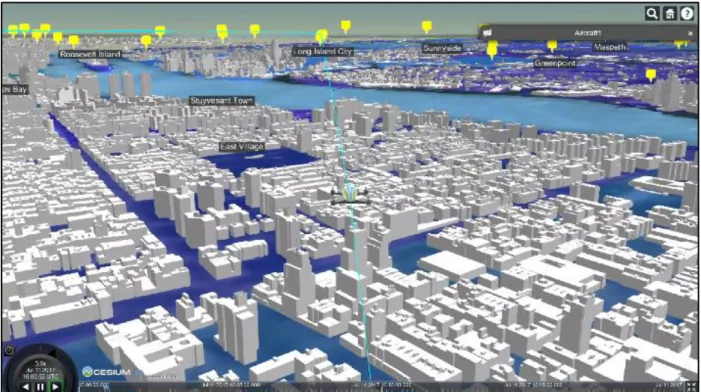
ABSTRACT: In this study, indoor 3D modeling study of Sırçalı Masjid in located in the Karatay district of Konya province was carried out by using the terrestrial