ANALYSIS OF ROAD TRAFFIC ACCIDENTS IN ANTALYA PROVINCE (TURKEY) USING GEOGRAPHICAL INFORMATION SYSTEMS
1Ela Ertunç, 1Tayfun Çay, 2Ömer Mutluoğlu
1Selcuk University, Engineering Faculty, Department of Geomatics Engineering, Konya, Turkey, 2Selcuk University, Vocational School of Technical Sciences, Departmant of Architecture and Urban Plannig,
Konya, Turkey
1[email protected] , 1[email protected], 2[email protected] (Geliş/Received: 01.08.2016; Kabul/Accepted in Revised Form: 05.11.2016)
ABSTRACT: In Turkey, about 4000 people each year die in traffic accidents and about 200,000 people each year are injured. For this reason, this problem of road traffic in Turkey is found a solution to an urgent. In this study, in ensuring of security of road traffic has been intended to introduce of the importance of Geographic Information Systems (GIS).
Antalya Province where is one of Turkey's major metropolises have the problem of heavy traffic. In this study has been made general statistical analysis in a GIS environment of road traffic accidents occurred in 2009 and 2010 years in Antalya Province Center. Also, traffic accidents has been analyzed by correlating environmental factors with parameters situated in a traffic accident data set.
In the beginning of this study, by using ArcMap-10 software, the satellite map of Antalya Province has been digitized. A database has been created with Arcmap-10 software using fatal-injury traffic accident data occurred in Antalya City Center between 2009 and 2010 years. Fatal-injury traffic accidents on "Intersection" and "boulevard-highroad-street" have separated of each other and by using accident data (accident day, time interval of accident, occurrence type of accident, accident character, the number of dead, the number of injured) belonging to accidents occurring in each one, on a satellite map in the ArcMap-10 software of accidents were conducted the statistical evaluations in both visual and graphics. In GIS, the regions where have intensive of intersection accidents have been determined. As a result, at the intersections in Antalya Province Center, it was identified 41 accident hot spots for the year 2009, and was identified 57 accident hot spots for the year 2010. A total of 23 intersections were defined as accident hot spot in both years. Also, on boulevards-highroads-streets on the satellite map in Arc-Map-10 software has been determined 29 accident-prone regions as the years.
Key Words: Traffic accident analyzing, Geographic information system, Accident hot spots, Antalya,
Accident-prone regions
Antalya (Türkiye) İl’in deki Karayolu Trafik Kazalarının Coğrafi Bilgi Sistemleri (CBS) Yardımıyla İncelenmesi
ÖZ: Türkiye’de her yıl yaklaşık 4000 kişi trafik kazalarında ölmekte, yaklaşık 200000 kişi de yaralanmaktadır. Bu nedenle Türkiye’de trafik sorununa acil olarak bir çözüm bulunması gerekir. Bu çalışmada, karayolu trafik güvenliğinin sağlanmasında Coğrafi Bilgi Sistemleri’nin (CBS) öneminin ortaya konması amaçlanmıştır.
Türkiye’nin önemli metropollerinden biri olan Antalya kenti yoğun trafik sorununa sahiptir. Bu çalışmada, Antalya İl Merkezi’nde 2009 ve 2010 yıllarında meydana gelen karayolu trafik kazalarının CBS ortamında genel istatistiksel değerlendirmeleri yapılmış ve trafik kaza veri setinde yer alan parametreler çevresel faktörler ile de ilişkilendirilerek trafik kazaları analiz edilmiştir.
Bu çalışmada başlangıçta Antalya İl’ine ait uydu haritası ArcMap-10 programı kullanılarak sayısallaştırılmıştır. Antalya İl Merkezi’nde 2009 ve 2010 yıllarında meydana gelen ölümlü-yaralanmalı trafik kaza verileri kullanılarak ArcMap-10 programında bir veri tabanı oluşturulmuştur. “Kavşak” ve “bulvar-cadde-sokaklardaki ölümlü-yaralanmalı trafik kazaları birbirinden ayrılmış ve her birinde meydana gelen kazalara ait kaza verileri (kaza günü, kaza saat aralığı, kaza oluş türü, kaza karakteri, ölü sayısı, yaralı sayısı gibi) kullanılarak, kazaların ArcMap-10 programındaki uydu haritası üzerinde hem görsel hem de grafikler halinde istatistiksel değerlendirmeleri yapılmıştır. CBS ortamında kavşaklarda meydana gelen kazaların yoğun olduğu bölgeler tespit edilmiştir. Antalya İl Merkezi’ndeki kavşaklarda 2009 yılında 41, 2010 yılında 57 kavşak kaza kara noktası belirlenmiştir. Toplam 23 kavşak ise her iki yılda da kara nokta olarak tanımlanmıştır. Ayrıca, Arc-Map-10 programındaki uydu haritası üzerinde bulvar-cadde-sokaklarda yıllar itibariyle 29 kazaya meyilli bölge tespit edilmiştir.
Anahtar Kelimeler: Karayolu trafik kaza analizi, Coğrafi bilgi sistemi, Antalya, Kaza kara noktaları, Kazaya
meyilli bölgeler. INTRODUCTION
According to Road Traffic Law in Turkey (date: 13 October 1983, number: 2918); “traffic is status and movements of pedestrians, animals, and vehicles on the highway”. International Labour Organization (ILO) has defined traffic accident as "previously unplanned unexpected events causing a specific damage or injury”. Road traffic accidents rank first among accidents which cause injury all over the world.
In Turkey, nearly 4000 people die and nearly 200000 people are injured every year in road traffic accidents. For this reason, traffic problem should be examined scientifically. Aim of this study is to reveal the importance of the use of Geographic Information Systems (GIS) in assuring the safety of road traffic, and to determine the properties of traffic accidents, in terms of measures to be taken investigates the benefits.
Erdoğan et al (2008) studied the analysis of accidents in the province of Afyonkarahisar using GIS, between 1996-2006. Gündoğdu (2010) determined traffic accident hot spot and the highest potential accident hot spots using GIS-based lineer analysis methods. Nizam et al. (2011) made the analysis of the traffic accidents occurring at the state roads remaining within Erzurum province by using Arc-GIS. Kabakuş et al. (2012) have made the analysis of traffic accidents occurring in the districts of Erzurum province by taking advantage of GIS technology. Reshma and Shrarif (2012) have identified important accident hot spots in Karnataka (South Bangalore-India) by using Arcmap-10 software. Geymen and Dedeoğlu (2016) investigated the traffic accidents in Kahramanmaraş city center according to the topography of the land and occurrence time of the accident occurrence time, and demonstrated the reasons which cause the formation of these factors by the spatial analysis in the GIS.
Antalya Province which is one of the important cities of Turkey has heavy traffic problem, as in other major metropolitan cities. In this study, fatal-injury highway traffic accidents occurring in 2009 and 2010 in Antalya Province Center were performed statistical evaluations with the help of GIS, and determined factors affecting the traffic accidents. Also, identified accident hot spots at intersections and identified accident-prone regions at boulevard-street-street were demonstrated.
THE USE OF GIS FOR ANALYSIS OF ROAD TRAFFIC ACCIDENTS
GIS have been defined as transactions provided input, storage, questioning, mapping and analysis of spatial and nonspatial data in order to support the activities of enterprises by Grimshaw (1994). Many countries in the world analyze traffic accidents occurring on highways using GIS. They determine the causes of road traffic accidents by depending on road, vehicle, road conditions or weather conditions
and take safety measures where there is a traffic accident by examining the results of these analyzes (Ertunç, 2013).
In order to identify the causes of traffic accidents, accident data need to be examined in detail. For this reason, all the data for accidents are indicated in traffic accident reports. For example, date of accident and time of accident, type of accident occurrence, the status of the road where the accident occurred, etc. GIS provides a detailed examination of this information and as soon as possible. GIS can be used effectively in order to identify road accident hot spots. Also, GIS can provide a link between two or more data previously unrelated. The most beneficial aspect of GIS is the ability to establish a relationship between the attribute information (day of accident, month of accident, hour and accident, etc.) and spatial objects (street names, route numbers, etc.) (Reshma and Sharif, 2012). GIS can collect non-graphical features as geo-reference data and connect them with the geographical map features. For this reason, GIS gives useful results in studies of accident analysis.
MATERIAL AND METHOD
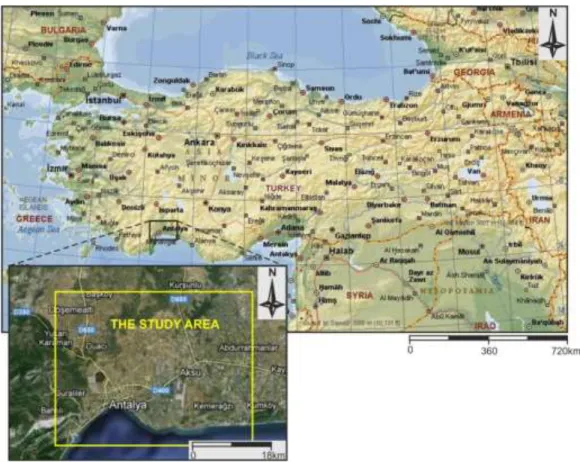
Antalya is geographically situated between 36° 07' - 37° 29' north latitudes and 29° 20' - 32° 35' east longitudes. Surface area of the city is 20815 km2 and the population of the city is approximately 2
million. Study area includes the Antalya Province Center (Figure 1). Antalya Province Center consists of Aksu, Döşemealtı, Kepez, Konyaaltı and Muratpaşa counties.
Figure 1. Showing on the map of the study area
The data of fatal and injury traffic accidents were collected from Traffic Accident Detection Proceedings via Antalya Police Department and Ankara Police Headquarters Traffic Education and Research Department. These information are recorded by using the WGS-1984 UTM coordinate system.
These data were tabulated into Microsoft Excel software. As a result, the data base belonging to total 4763 fatal-injury traffic accident occurred in 2009 - 2010 years was prepared. The Excel table contains traffic accident data (year-month-day of the accident, the accident time, accident location, type of occurrence, the number of dead, the number of injured, weather, road surface condition, the geometric characteristics of the road, status of the intersection, the traffic light status, x-y coordinates of accident, vehicle type, driver age-sex-education, the character of the accident (fatal / injury) and the number of vehicles involved in the accident, etc.). Later, the information referred to as the text in data set optimized numerically significant and numerical values of all data entered into Excel.
Initially, the satellite image belong to Antalya Province were transferred to ArcMap-10 software. Coordinates at the uniformly dispersed 20 point in Antalya City Center were measured with GPS and by considering these coordinates, the satellite map into the ArcMap-10 software was made with coordinate according to “WGS 1984 (Word Geodetic System-84)” system. Later, road axis lines was quantified on the satellite map with digitizer. The data of accidents in the data set of road traffic accidents in Excel software were transferred to the ArcMap-10 software in case of different layers “according to intersection, boulevard-highroad-street and years”.
So, within a short time as a few minutes, it was reached to accident hot spots and accident-prone regions by being analyzed associated with fatal and injury accidents occurring at intersections and boulevards-highroads-streets in both 2009 year and 2010 year in Antalya Province Center. By taking advantage of the graphical and non-graphical query functions of GIS, analyses have been done, and they have been displayed on the screen.
APPLICATION
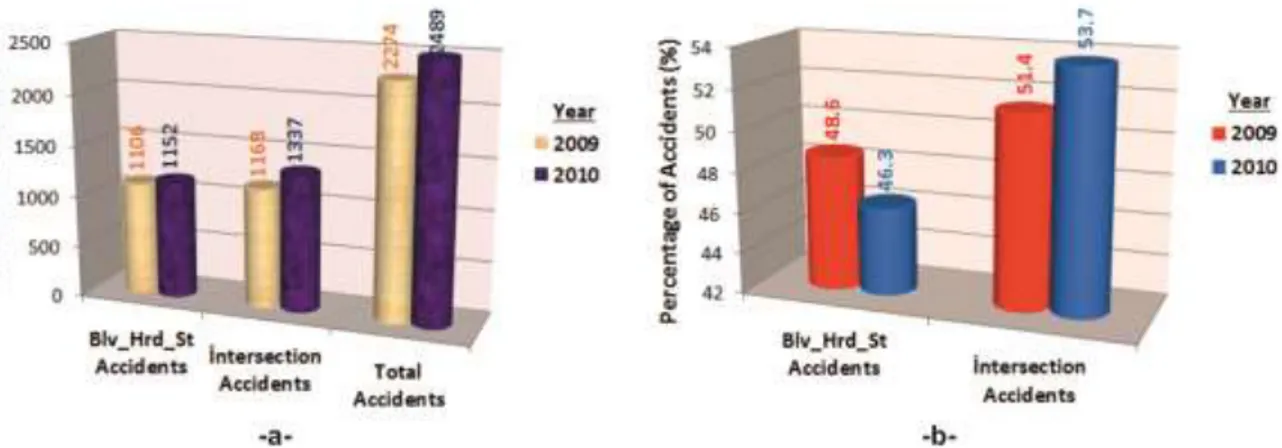
On "Intersections" and "Boulevards (Blv) – Highroads (Hrd) – Streets (St)" into 2009 and 2010 years in Antalya Province Center occurred 4763 road traffic accidents in total. The number of accidents occurred at intersections are 2505. The number of boulevards–highroads–streets occurred at intersections are 2258 (Figure 2a). The ratio the total accident of intersections accident is 51.4% in 2009 year. In 2010 the ratio was increased to 53.7% (Figure 2b). Therefore, “intersection accidents” and “boulevard–highroad–street accidents” have been discussed in different chapters below.
Figure 2. The number of accidents (a) and percentages of accidents (b) belonging to fatal and injury accidents occurring in Antalya Province Center
Investigation of Intersection Accidents
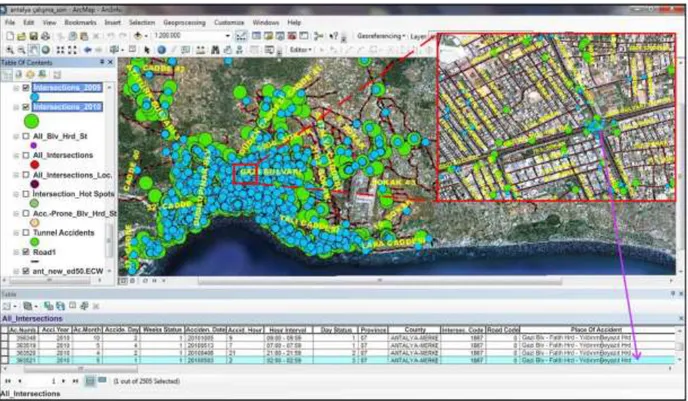
Accident locations occurring at intersections in both 2009 year and 2010 year in Antalya Province Center and attribute information of these accidents have been shown in Figure 3. The number of fatal and injury accidents were given in Figure 4.
Figure 3. Displaying into ArcMap-10 software of accident locations and accident data occurring at intersections in both 2009 year and 2010 year in Antalya Province Center
Figure 4. a) The number of fatal, injury and total accidents, and b) the number of dead and injured in fatal - injury accidents occurring at intersections in both 2009 and 2010 in Antalya Province Center
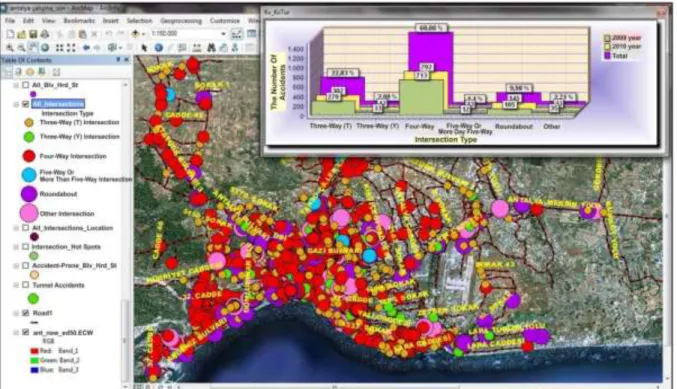
In intersection accidents, intersections with the most accidents are “four-way” intersections (Figure 5). 60.08 % of total intersection accidents have occurred at these intersections.
When we look at the general information in intersection accidents, it is seen that the more accidents occur in respectively May, October, August, June, July in both 2009 year and 2010 year. At the same time, they are the months in which tourist season is the most intense and thus the population of the province increases. In intersection accidents, most accidents have occurred between 17:00 pm and 17:59 pm. Between these hours occurred 89 accidents in 2009 year, 101 accidents in 2010 year. These hours are the times in which traffic is the most intensive. As of all years, 67.58 % of intersection accidents have occurred a result of "side impact". 795 accidents in 2009 year and 898 accident in 2010 year, have occurred a result of sideswipe. It is shown that there isn’t traffic light in 72.65 % of accidents occurring at intersections. There is traffic light solely in 27.11 % of intersections.
Figure 5. Distribution map based on the type of intersection of accidents occurring at intersections as of all years in Antalya Province Center and histogram showing the relationship of intersection type - the
number of accidents as of the years
Accident hot spots were determined at the intersections in Antalya Province Center and were
carried out analysis in these hot spots (Figure 6). In the study area, the intersections at which occurs at
Figure 6. The distribution map of all accident hot spots determined at intersections in both 2009 and 2010 in Antalya City Center, and the distribution map according to the number of accidents occurring as
least three intersection accident of the same type for each year were determined and they were identified as accident hot spots. At the intersections in Antalya Province Center, it was identified 41 accident hot spots for the year 2009, and was identified 57 accident hot spots for the year 2010. A total of 23 intersections were defined as accident hot spot in both years. Determined accident hot spots were shown in Figure 6.
Also, distribution map according to the number of accidents as of all years of accident hot spots determined at intersections in both 2009 and 2010 in Antalya City Center is shown in Figure 6. In Figure 6 is seen the histogram showing the number of accidents according to years at “Serik Highroad - Serik Highroad Side Road – Yunus Emre Street – Antalya Airport Residences Road intersection” being accident hot spot.
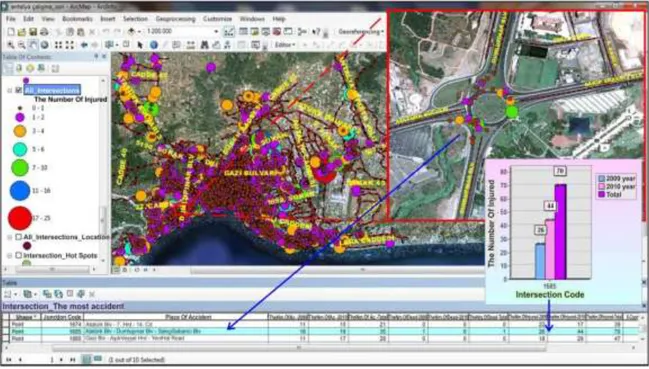
Distribution map according to the number of injured at accidents occurring at intersections as of all years in Antalya Province Center is shown in Figure 7. Also, in Figure 7 is seen distribution map according to the number of injured at accidents occurring in all years at “Atatürk Boulevard – Dumlupınar Boulevard – Sakıp Sabancı Boulevard intersection” determined as the accident hot point and is seen histogram showing the number of injured according to years.
Figure 7. Distribution map according to the number of injured at accidents occurring at intersections as of all years in Antalya Province Center, and histogram showing the number of injured according to
years at “Atatürk Boulevard – Dumlupınar Boulevard – Sakıp Sabancı Boulevard intersection” Investigation of Boulevard–Highroad–Street Accidents
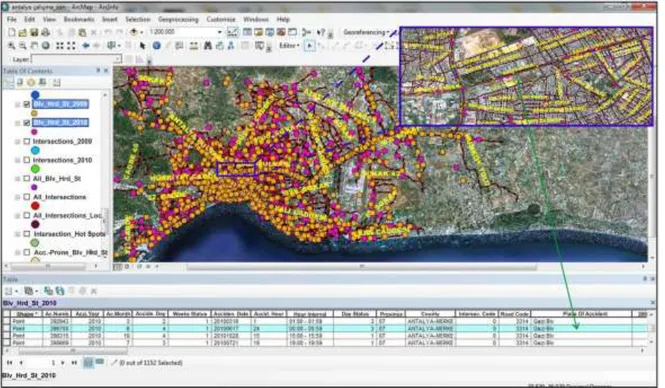
Accident locations occurring at Boulevards (Blv) – Highroads (Hrd) – Streets (St) in both 2009 year and 2010 year in Antalya Province Center and attribute information of some accidents have been shown in Figure 8.
The distribution map of fatal-injury accidents occurring in both 2009 year and 2010 year and the histogram of the number of fatal-injury accidents according to years at Boulevards (Blv) – Highroads (Hrd) – Streets (St) have been shown in Figure 9. Also, the distribution map of fatal-injury accidents occurring as all years and the histogram of the number of fatal-injury accidents according to years in
Antalya Boulevard where is one of the places observed most accidents have been seen in Figure 9. In Figure 9, it is seen that 97.83 % of accidents on boulevards–highroads–streets are injury as all years and 2.17 % of accidents on boulevards–highroads–streets are fatal as all years.
Figure 8. Displaying into ArcMap-10 software of accident locations and accident data occurring at boulevards (Blv) – highroads (Hrd) – streets (St) in both 2009 year and 2010 year in Antalya Province
Center
Figure 9. The distribution map and the histogram according to years of fatal-injury accidents occurring at boulevards (Blv) – highroads (Hrd) – streets (St) as all years in Antalya Province Center. Also, the histogram of the number of fatal-injury accidents occurring according to years in Antalya Boulevard
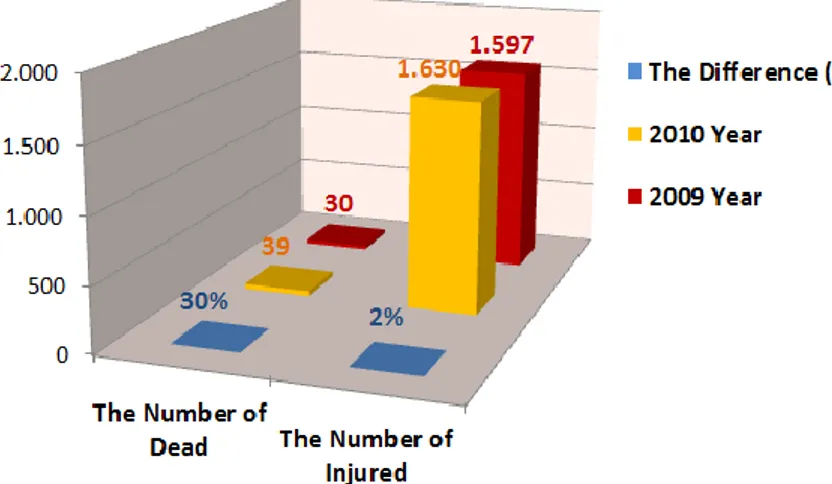
In these accidents occurring on boulevards–highroads–streets in 2009 year and 2010 year in Antalya Province Center died 69 people and were injured 3227 people (Figure 10).
Figure 10. The number of dead and injured in fatal - injury accidents occurring on boulevards– highroads–streets in 2009 year and 2010 year in Antalya Province Center
When we analyze in terms of “type of occurrence” accidents on boulevards–highroads–streets, as of all years, 22.14 % of boulevard–highroad–street accidents have occurred a result of "side impact" (Figure 11). As of all years, 22.10 % of boulevard–highroad–street accidents have occurred a result of "pedestrian impact".
Figure 11. The distribution map and the histogram as of the years according to “type of occurrence” of fatal-injury accidents occurring at boulevards (Blv) – highroads (Hrd) – streets (St) as of all years in Antalya Province Center. Also, the histogram of the number of fatal-injury accidents occurring as of all
When we look at the general information on boulevard–highroad–street accidents, as of all years, most accidents on boulevards–highroads–streets have occurred in may (10.36 %). The least accidents seen in February (5.67 %). The accidents appear extensively between may and October. In both 2009 year and 2010 year, November, December, January and February are the months when accidents are minimum. As of all years, most accidents have occurred on Friday with a rate of 15.15 %, whereas, minimum accidents have occurred on Tuesday with a rate of 12.62 %. In boulevard–highroad–street accidents, most accidents have occurred between 18:00 pm and 18:59 pm. Between these hours occurred 80 accidents in 2009 year, 79 accidents in 2010 year.
In Antalya Province Center, 52 accidents in 2010 year, 24 accidents in 2009 year have occurred in the tunnel. Hence, tunnel accidents holds an important place in all accidents. Rate of traffic accidents caused by male drivers is 87 %, whereas, rate of traffic accidents caused by women drivers is 7 %. In both 2009 year and 2010 year, accident rate of drivers between 26 age and 30 age are highest. As intersection accidents, it is seen that accident rate of secondary school graduates drivers in boulevard–highroad– street accidents are maximum (72.64 %). This rate is only 1.19 % for higher education graduates.
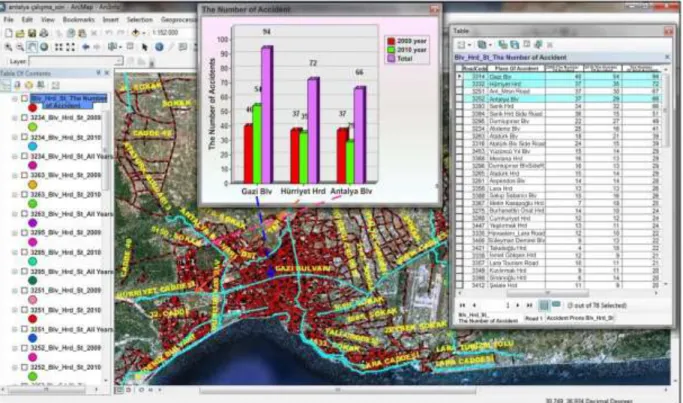
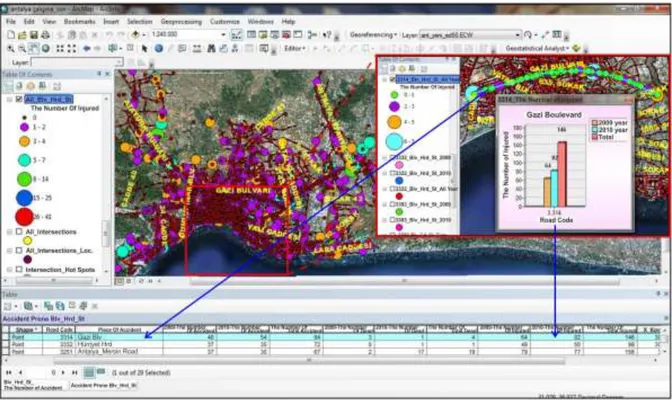
In Antalya Province Center as of 2009 and 2010 years, the regions where boulevard–highroad–street accidents are the most intense were determined. As of all years, there are 78 boulevards–highroads– streets, so that the number of accidents in these are more than 4. Taking into consideration total number of vehicles and traffic density in Antalya Province Center, as of all years on boulevards-highroads-streets has been determined 29 accident-prone regions, so that the number of accidents in these are more than 20 (Figure 12).
It is seen in Figure 12 that in Antalya Province Center, the most accident as of all years have occurred in Gazi Boulevard. In Gazi Boulevard occurred 40 fatal-injury accidents in 2009 year and occurred 54 fatal-injury accidents in 2010 year. Also, respectively Hürriyet Highroad, Antalya Mersin Way, Antalya Boulevard, Serik Highroad are regions where the most accident occurs.
Figure 12. In Antalya Province Center, accident-prone boulevards (Blv) – highroads (Hrd) – streets (Hrd) as of all years, and the number of accidents as of years
Distribution map according to the number of injured at accidents occurring at boulevards-highroads-streets as of all years in Antalya Province Center is shown in Figure 13. Also, in Figure 13 is
seen distribution map according to the number of injured at accidents occurring in all years in “Gazi Boulevard” and is seen histogram showing the number of injured according to years. It is seen in Figure 13 that the number of injured at accidents occurring in Gazi Boulevard are 64 injured in 2009 year and are 82 injured in 2010 year.
Figure 13. Distribution map according to the number of injured at accidents occurring at boulevards (Blv) - highroads (Hrd) - streets (St) as of all years in Antalya Province Center. Also, distribution map
according to the number of injured at accidents occurring as of all years at “Gazi Boulevard” and histogram showing the number of injured according to years
RESULTS
GIS is a computer based tool for mapping and analyzing and integrates database operations such as query and statistical analysis. That this data are displayed enables querying for different purposes to users and facilitates to perception as visual of results. GIS collect non-graphical properties as geo-referenced data and associate with features of the geographical map them. GIS use at studies of accident analysis is a quick and very effective method for the investigation of the causes of accidents and for the development of measures.
In Antalya Province Center, total 4763 traffic accidents in both 2009 year and 2010 year were occurred. In 2009 year, 36 fatal accidents and 2238 injury accidents were occurred, on the other hand, in 2010 year, 35 fatal accidents - 2454 injury accidents occurred. 51.4 % of fatal - injury accidents in 2009 year and 53.7 % of fatal - injury accidents in 2010 year were occurred at the intersections. 48.6 % of fatal - injury accidents in 2009 year and 46.3 % of fatal - injury accidents in 2010 year were occurred at the boulevards-highroads-streets. Since intersection accidents are high rates in Antalya Province Center, to make traffic arrangements at intersections will be very useful in terms of traffic safety of Antalya Province Center.
As of all the years, 0.88 % of intersection accidents is fatal, and, 99.12 % of intersection accidents is injury. While 10 fatal accidents occurred at intersections in 2009 year, the ratio increased to 12 in 2010
year. Compared to injury accidents, the number of injury accidents was 1158 in 2009 year, the number of injury accidents were 1325 in 2010 year. On account of, both fatal accidents and injury accidents have increased in 2010 year at intersections. Total 26 people died at fatal - injury accidents occurring at intersections in both 2009 year and 2010 year, on the other hand, total 3856 people were injured at fatal - injury accidents occurring at intersections in both 2009 year and 2010 year. Most accidents have occurred in four-way intersections. It is seen that the traffic light is not at 72.65 % of intersection accidents. For this reason, traffic lights and traffic signs increased at intersections should be increased. traffic controls should be increased from May months to October months and from 17:00 hours to 17:59 hours when most traffic accidents is seen in both intersection accidents and boulevard-highroad-street accidents. At the intersections in Antalya Province Center, İt has been identified 41 accident hot spots for the year 2009 and has been identified 57 accident hot spots for the year 2010. A total of 23 intersections have been defined as accident hot spot in both years.
As of all the years, 2.17 % of highroad-street accidents is fatal, and, 97.83 % of boulevard-highroad-street accidents is injury. While 26 fatal accidents occurred at boulevards-highroads-streets in 2009 year, the ratio decreased to 23 in 2010 year. Compared to injury accidents, the number of injury accidents was 1080 in 2009 year, the number of injury accidents were 1129 in 2010 year. On account of, both fatal accidents and injury accidents have increased about 5% in 2010 year at boulevards-highroads-streets. Total 69 people died at these accidents occurring in both 2009 year and 2010 year, on the other hand, total 3227 people were injured at these accidents occurring in both 2009 year and 2010 year. 57.70 % of boulevard-highroad-street accidents have occurred as a result of “side impact”, "pedestrian impact" and “behind impact”. According to all years, while the most accident occurred Friday, the least accident occurred Tuesday. In both intersection accidents and boulevard-highroad-street accidents, it have been seen that accident rates increased when the education level of the drivers decreased. In Antalya Province Center as of all years, 29 boulevards-highroads-streets has been determined as accident-prone regions. In both 2009 year and 2010 year, Gazi Boulevard are regions where the most accident occurred.
REFERENCES
Erdoğan, S., Yılmaz, İ., Baybura T., Güllü M., 2008, “Geographical Information System aided traffic accident analysis system case study: City of Afyonkarahisar”, Accident Analysis & Prevention, Vol. 40, Issue 1, January, pp. 174-181.
Ertunç, E., 2013, Coğrafi Bilgi Sistemleri Yardımıyla Trafik Kazalarının Analizi: Antalya Örneği, Master Thesis, Selçuk University, Graduate School of Natural Sciences, Konya-Turkey. 135 p.
Geymen, A. and Dedeoğlu, O.K., 2016, “Coğrafi Bilgi Sistemlerinden Yararlanılarak Trafik Kazalarının Azaltılması: Kahramanmaraş İli Örneği”, Iğdır Üniversitesi Fen Bilimleri Enstitüsü Dergisi, Vol. 6 (2), pp. 79-88.
Grimshaw, D.J., 1994, Bringing GIS into Business, Longman, London-England.
Gündoğdu, İ. B., 2010, “Applying Linear Analysis Methods to GIS-Supported Procedures for Preventing Traffic Accidents: Case Study of Konya”, Safety Science, Vol. 48/6, pp. 763-769.
Kabakuş, N., Tortum, A. and Çodur, M.Y., 2012, “Erzurum’un İlçelerinde Meydana Gelen Trafik Kazalarının Coğrafi Bilgi Sistemleri ile Değerlendirilmesi”, Ordu Üniversitesi Bilim ve Teknik Dergisi, Vol. 2(2), pp. 78-92.
Nizam, T., Erkenekli, F., Çodur, M.Y., Uluğtekin, N., Doğru, A.Ö., “Coğrafi Bilgi Sistemleri ile Trafik Kaza Analizi”, TMMOB Coğrafi Bilgi Sistemleri Kongresi, Antalya-Turkey, 5, 2011.
Reshma, E.K., Sharif, S.U., 2012, “Prioritization of Accident Black Spots Using GIS”, International Journal of Emerging Technology and Advanced Engineering, Vol.2(9), pp. 117-122.