Procedia - Social and Behavioral Sciences 99 ( 2013 ) 742 – 751
1877-0428 © 2013 The Authors. Published by Elsevier Ltd. Open access under CC BY-NC-ND license. Selection and peer-review under responsibility of the International Strategic Management Conference. doi: 10.1016/j.sbspro.2013.10.546
ScienceDirect
9
thInternational Strategic Management Conference
How human resource operations work in higher education
institutions
Hasan Arslan
a, Ali Akdemir
b,
caCanakkale Onsekiz Mart University,Canakkale,17100, Turkey
bArel University, Istanbul, 34722, Turkey
cHasan Kalyoncu University, Gaziantep, 37116, Turkey
Abstract
The purpose of this study is to examine the perceptions of faculty members about human resources operations in their higher education institutions whether human resources operations were adopting value-added service delivery strategies or not. An assessment instrument from the HR Value Proposition Model was applied to faculty members. The assessment tool from the HR Value Proposition Model was adapted to the higher education environment. The HR value-added model consists of 14 criteria in order to evaluate the perceptions of faculty members. The results indicate that a value-added roles model for higher education institutions requires a re-definition of HR roles, the development of new competencies, and the implementation of new approaches and outcomes accountability.
3 Published by Elsevier Ltd. Selection and/or peer-review under responsibility of the 9th
International Strategic Management Conference
Keywords: Higher education, human resources, value proposition model
Corresponding author. Tel: + 90-505-826-4239; fax: +90-286-212-0751
E-mail address: [email protected]
© 2013 The Authors. Published by Elsevier Ltd. Open access under CC BY-NC-ND license.
1. Introduction
The slow evolution of HR, along with the unique higher education environment, has resulted in HR in understanding of
value-the broader organization and secure a
must transform their operations if a leadership seat is desired, but cautioned that the adoption of a value-added HR paradigm requires redefining HR roles, developing new HR competencies, and implementing new approaches and outcomes accountability. However, they did not validate a framework for nor clearly re-define the HR roles, competencies, or other elements of value-added transformation.
The value proposition model (VPM) developed by Ulrich and Brockbank (2005) could provide a 18). However, it is not known if the five elements of the VPM apply to higher education HR. In addition, it is not known to what extent HR operations have adopted the 14 value-added criteria of service delivery. Also, it is not known if there is a relationship between the overall level of value-added service delivery among HR operations in different types of higher education institutions. The results of this study indicated that college and university CEOs perceive that the value-added paradigm is being adopted by HR professionals in higher education and that this adoption is evident in different types
Brault and Beckwith (2003) cited shrinking budgets, increased accountability for outcomes, and increased complexity as reasons for human resources (HR) in higher education to shift to a more strategic and value-added paradigm of service delivery. Brault and Beckwith described a value-added roles model for higher education, and posited that a value-added HR approach requires a re-definition of HR roles, the development of new competencies, and the implementation of new approaches and outcomes accountability. Brault and Beckwith argued that such a shift was necessary in order for higher education moving to a value-added approach to HR service delivery requires describing the role of human resource management (HRM) in a different way. They argued that an HR entity adopting a value-added approach must be prepared to re-configure HR functions, define new HR competencies, and adopt a different mix of activities to support large-scale organizational change. Lawler and Mohrman based their arguments on results of three descriptive survey studies conducted between 1998 and 2001 that examined the level of value-added strategies adopted by HR in medium to large size organizations. In their research, they identified and studied eight areas impacted by adoption of value-added approaches and strategic focus within HR. These areas included (a) HR roles and activities, (b) design of the HR function, (c) shared services units, (d) outsourcing, (e) e-HR, (f) talent management, (g) HR skills, and (h) HR effectiveness. There are indications that HR operations in higher education are moving toward this value-added approach to HRM (Brault & Beckwith, 2003; Joinson, 2000; Kemper, 2001). The study utilized a value-added service delivery model developed by Ulrich and Brockbank (2005) as a framework to examine the perceptions of faculty memebers about the level of value-added HR service delivery adopted in their institutions (Weinacker,2008).
2. Literature Review And Hypotheses
2.1. Evolution of HR in Higher Education
The evolution of human resources (HR) in higher education has been a relatively recent phenomenon considering the tenure of most colleges and universities. Triplett (1997) reported that personnel administration was one of the last specialty areas to emerge in higher education. When institutions first originated, professors received annual or quarterly wages and were responsible for hiring and paying their own assistants (Mackie, 1990). Prior to mid-1940, administrators handled HR functions as part of their routine job responsibilities. However, in early 1950, the first personnel managers appeared on campus in response to increasing federal mandates and rapid institutional growth. Personnel managers played a support role in hiring functions, and were responsible for processing payroll papers. Nevertheless, many HR functions (especially those related to faculty) continued to be handled by deans and department chairpersons. It was not until the 1990s that personnel administration functions began to be referred to as
HR and emerging corporate HR paradigms examined for relevance to higher education (Kemper, 2001). Two of these HR paradigms have been discussed in the literature. These include the traditional paradigm (Brault & Beckwith, 2003; Noe, Hollenbeck, Gerhart, & Wright, 2003), and the strategic partner paradigm (Brockbank, 1999; Browning, 2003; Hammonds, 2005; Kemper, 2001; Lawler & Mohrman, 2003; Prophal, 2002; Ulrich, 1997; Williams, 2004). Both paradigms focus on the delivery of HR services and both are evident in the higher education environment (Brault & Beckwith). A third paradigm the value-added paradigm, is emerging in the literature (Brault & Beckwith; Lawler & Mohrman; Ulrich & Brockbank, 2005). This paradigm views HR as part of the larger organizational system and expands the strategic partner paradigm to include additional HR roles, functions, and competencies (Ulrich & Brockbank). This dissertation utilized a descriptive survey methodology to examine whether college and university CEOs perceived that the value-added paradigm of HR service delivery is evident in higher education HR(Weinacker,2008).
2.2. HR Paradigms in Higher Education
Noe et al. (2003) defined the traditional paradigm of HRM
education include compensation, training and development, performance management, recruitment, selection, and employee relations functions (Kemper, 2001). Typically, HR personnel and departments in higher education operating within the traditional HRM paradigm, provide administrative and support functions by processing paper work, insuring that paychecks are cut accurately, and serving a general administrative/gatekeeper role (Brault & Beckwith, 2003). However, the value of the traditional paradigm of HRM has been widely debated in favor of a more strategic paradigm (Brockbank, 1999; Browning, 2003; Hammonds, 2005; Lawler & Mohrman, 2003; Prophal, 2002; Ulrich, 1997; Williams, 2004). human resource deployments and activities intended to enable an organization to achie
298). In this paradigm, the primary function of HR is to translate organizational strategy into human resource priorities. Human resource leaders are involved in defining organizational strategy, translating strategy into operational priorities and actions, and designing HR practices that align with the strategy (Kemper, 2001). Thus, HR performs a key role in achieving organizational vision and purpose and sustaining and maintaining competitive advantage (Noe et al., 2003).
However, the transition of higher education HR functions to the new strategic HRM approach has been slow with many higher education HR departments continuing to embrace the traditional, administrative gatekeeper role of the past (Joinson, 2000). HR functions have not been proactive in adopting strategic programs and processes to enable institutions to achieve their goals (Brault & Beckwith, 2003; Joinson; Kemper, 2001). For example, in an early study of 92 four-year universities, Smith and Ferris (1990) found human resources strategy and planning to be an uncommon practice. Only eight institutions (less than 10%) had strategic HR plans, and less than half of the respondents (25) thought having a strategic HR plan was important. While the transition from traditional HRM to strategic HRM is evident in both the private and public sectors of HR including higher education, Williams (2004) maintained that slow view of HR as
2.3. Value-Added HRM Paradigm in Higher Education
Zedeck and Cascio (1984
systems model, organizations receive input from the environment and then transform these inputs into organizational outputs. When considering HR from an open systems perspective, HRM is viewed in the context of the broader organization aswell as from the functional view of its parts (Wright & Snell, 1991). Incorporating a systems approach, value-added paradigms of HR combine the focus of both the traditional and strategic paradigms. Rather than choosing one paradigm over the other, both paradigms are accommodated in the delivery of HR service. Traditional roles tended to be more functionally and technically related to HR while value-added roles were more strategic and business based. Ulrich -added role characteristics (p. 23). Ulrich (1997) further proposed that when these strategic and operational focuses were combined with HR activities involving people and processes, four new HR roles emerged. These roles included (a) management of strategic HR; (b) management of firm infrastructure; (c) management of employee contributions; and (d) management of transformation and change. Ulrich argued that HR professionals who adopt these new HR roles also must expand their professional competence beyond the knowledge of HR practices to include knowledge of business practices, and the management of change(Weinacker,2008)..
Building on the work of Ulrich (1997), Brault and Beckwith (2003) introduced the concept of HR adding value in the field of higher education and discussed the roles and competencies of HR professionals from a value-added perspective. When describing the value-added roles model for higher education Brault and Beckwith also classified HR activities into four categories. These categories included (a) providing skilled staff, (b) enhancing organizational effectiveness, (c) motivating performance, and (d) designing and implementing effective processes. However, the Brault and Beckwith value-added model was never validated through scientific research. In addition, since the Brault and Beckwith work, Ulrich and Brockbank (2005) built on previous works and introduced a new value-added framework for HR the Value- Proposition Model (VPM) of HR service delivery.
3. Methodology
3.1. Research Goal
The purpose of this study is to examine the perceptions of faculty members about human resources operations in their higher education institutions whether human resources operations were adopting value-added service delivery strategies or not. An assessment instrument from the HR Value Proposition Model was applied to faculty members.
3.2. Sample and Data Collection
The Ulrich and Brockbank (2005) VPM assessment was adapted to the higher education by Weinacker (2008) and the survey was applied to 255 faculty members in Canakkale Onsekiz Mart University. The collected data from survey was analyzed through the SPSS statistical program. The mean scores, frequences and standard deviations applied to data. Two research questions are addressed:
1. Which of the five elements that define the HR Value Proposition have been adopted by HR in COMU?
2. Which of the 14 criteria presented in the VPM are evident in COMU HR?
Analysis of the survey results were used to describe the current state of HR in higher education relative to adoption of the value-added paradigm from the point of view of the faculty members in Canakkale Onsekiz Mart University.
3.3. Analyses and Results
The HR Value Proposition Model was applied to the faculty members in Canakkale Onsekiz University in order to collect data. The model was developed by Ulrich and Brockbank and adopted to higher education institutions by Weinacker (2008). There were 5 elements and 14 criteia in the assessment model. 5 likert-type scale was used to measure the human resources operations in Canakkale
es the reliability of scales used in that survey.
The first research question outlined in the expected results of this study. Faculty members in higher education instiutions would perceive that each of the five elements that define the HR Value Proposition had been adopted to some extent by the HR operations of their institutions. These elements are Element 1 knowing external business realities, Element 2 serving external and internal stakeholders, Element 3 crafting HR practices, Element 4 building HR resources and Element5 ensuring HR professionalism. Element 5 was reported by participants be adopted to the highest extend of the five (n=225 ,66 % ), and the Element I to the lowest extent (n=225, 49 % ). The other three elements (Element 2, 52,5 %,; Element 3, 60 % and Element 4, 61 Percent) were adopted to some extent.
The second research question was related to 14 criteria identified by Ulrich and Brockbank (2005) . These criteria: (1) Recognizes external business realities and adapts its practices and allocates resources accordingly, (2) Creates market value for investors by increasing intangibles, (3) Increases customer share by connecting with target customers, (4) Helps line managers deliver strategy by building organization Capabilities, (5) Clarifies and establishes an employee value proposition and ensures that employees have abilities to do their work, (6) Manages people processes in ways that add value, (7) Manages performance management processes in ways that add value, (8) Manages information processes and practices in ways
that add value, (9) Manages work flow processes and practices in ways that add value, (10) Has a clear strategic planning process for aligning HR investments with business goals, (11) Aligns its organization to the strategy of the business, (12) Has staff who play clear and appropriate roles, (13) Builds staff ability to demonstrate HR competencies, (14) Invests in HR professionals through training and development experiences.
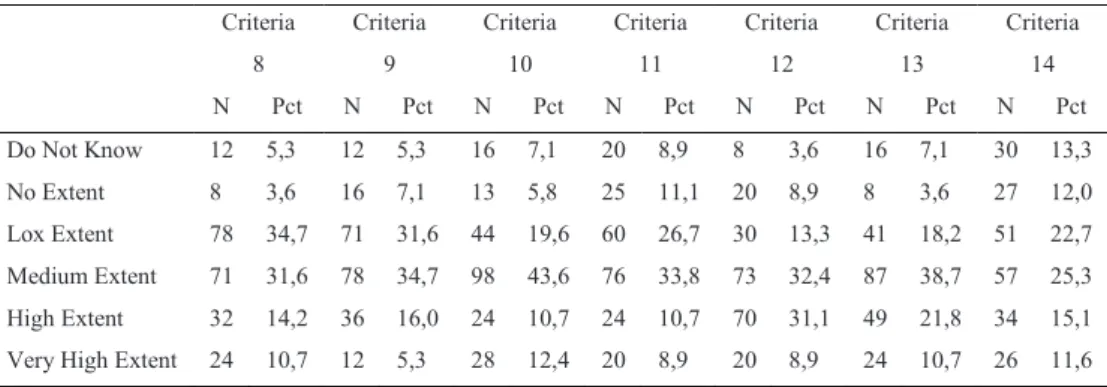
Frequency distributions were compiled and measures of central tendency computed for each of the 14 criteria. These are reported in Table 1 and Table 2. It was hypothesized that faculty members would perceive that each of the 14 criteria that define the HR Value Proposition (Ulrich & Brockbank, 2005) had been adopted to some extent by the HR operations of the institution. Data analysis indicated that Criteria 1 have 6,2 percent no extent , 32,0 percent low extent , 32,4 medium extent, 13,8 high extent and 8, 2 percent very high percent. The mean score was found 2,40 in Criteria 1. Criteria 2 have 22,7 percent no extent, 26,7 percent low extent, 16,4 percent medium extent, 11,1 percent high extent and 6,7 percent very high extent. The mean score was found 2,18 in cretria 2. Criteria 3 have 4,4 percent no extent, 32,9 low extent, 27,6 medium extent, 15,1 high extent and 4,9 very high extent. Criteria 3 has 2,37 mean score. Criteria 4 have 5,3no extent, 11,6 low extent, 29,3 medium extent, 26,7 high extent and 15,1 very high extent. The mean score has found 3,56 in Criteria 4. Criteria 5 have 5,3 percent no extent, 25,8 low extent, 33,8 medium extent, 12,9 high extent and 8,9 very high extent. The mean score was 2,54 in Criteria 5. Criteria 6 have 12,0 percent no extent, 27,6 low extent, 25,3 medium extent, 12,0 high extent and 11,1 very high extent. The criteria 6 has 3,17 mean score. Criteria 7have 5,8 percent no extent, 10,7 low extent, 32,9 medium extent, 30,7 high extent and 12 percent very high percent. The mean score was 3,08 for Criteria 7. Criteria 8 have 3,6 percent no extent, 34,7 low extent, 31,6 medium extent, 14,2 high extent and 10,7 very high extent. Criteria 8 has 2,77 mean score. Criteria 9 have 7,1 percent no extent, 31,6 low extent, 34,7 medium extent, 16,0 percent high extent and 5,3 very high extent. The mean score was 2,64 for Criteria9. Criteria 10 have 5,8 no extent, 19,6 low extent, 43,6 medium extent, 10,7 high extent and 12,4 percent very high extent. Criteria 10 has 3,08 mean score. Criteria 11 have 11,1 percent no extent, 26,7 low extent, 33,8 medium extent, 10,7 high extent and 8,9 very high extent. The mean score was 2,52 for Criteria 11. Criteria 12 have 8,9 no extent, 13,3 low extent, 32,4 medium extent, 31,1 high extent and 8,9 percent very high extent. Criteria 12 has 3,17 mean score. Criteria 13 have 3,6 no extent, 18,2 low extent, 38,7 medium extent, 21,8 percent high extent and 10,7 very high extent. The mean score was 2,96 for Criteria 13. Finally, Criteria 14 have 12,0 percent no extent, 22,7 percent low extent, 25,3 medium extent, 15,1 percent high extent and 11,6 percent very high extent. The mean score was 2,51 for Criteria 14 (Table 1,2,3,4).
The HR Value Proposition Model was applied to the faculty members in Canakkale Onsekiz University in order to collect data. The model was developed by Ulrich and Brockbank and adopted to higher education institutions by Weinacker (2008). There were 5 elements and 14 criteia in the assessment model. 5 likert-type scale was used to measure the human resources operations in Canakkalee
was found 0,82 which indicates the reliability of scales used in that survey.
The first research question outlined in the expected results of this study. Faculty members in higher education institutions would perceive that each of the five elements that define the HR Value Proposition had been adopted to some extent by the HR operations of their institutions. These elements are Element 1 knowing external business realities, Element 2 serving external and internal stakeholders, Element 3 crafting HR practices, Element 4 building HR resources and Element5 ensuring HR professionalism. Element 5 was reported by participants be adopted to the highest extend of the five (n=225, 66 %), and
the Element I to the lowest extent (n=225, 49 % ). The other three elements (Element 2, 52,5 %; Element 3, 60 % and Element 4, 61 %) were adopted to some extent.
The second research question was related to 14 criteria identified by Ulrich and Brockbank (2005) . These criteria: (1) Recognizes external business realities and adapts its practices and allocates resources accordingly, (2) Creates market value for investors by increasing intangibles, (3) Increases customer share by connecting with target customers, (4) Helps line managers deliver strategy by building organization Capabilities, (5) Clarifies and establishes an employee value proposition and ensures that employees have abilities to do their work, (6) Manages people processes in ways that add value, (7) Manages performance management processes in ways that add value, (8) Manages information processes and practices in ways that add value, (9) Manages work flow processes and practices in ways that add value, (10) Has a clear strategic planning process for aligning HR investments with business goals, (11) Aligns its organization to the strategy of the business, (12) Has staff who play clear and appropriate roles, (13) Builds staff ability to demonstrate HR competencies, (14) Invests in HR professionals through training and development experiences.
Frequency distributions were compiled and measures of central tendency computed for each of the 14 criteria. These are reported in Table 1 and Table 2. It was hypothesized that faculty members would perceive that each of the 14 criteria that define the HR Value Proposition (Ulrich & Brockbank, 2005) had been adapted to some extent by the HR operations of the institution. Data analysis indicated that Criteria 1 have 6,2 percent no extent , 32,0 percent low extent , 32,4 medium extent, 13,8 high extent and 8, 2 percent very high percent. The mean score was found 2,40 in Criteria 1. Criteria 2 have 22,7 percent no extent, 26,7 percent low extent, 16,4 percent medium extent, 11,1 percent high extent and 6,7 percent very high extent. The mean score was found 2,18 in cretria 2. Criteria 3 have 4,4 percent no extent, 32,9 low extent, 27,6 medium extent, 15,1 high extent and 4,9 very high extent. Criteria 3 has 2,37 mean score. Criteria 4 have 5,3no extent, 11,6 low extent, 29,3 medium extent, 26,7 high extent and 15,1 very high extent. The mean score has found 3,56 in Criteria 4. Criteria 5 have 5,3 percent no extent, 25,8 low extent, 33,8 medium extent, 12,9 high extent and 8,9 very high extent. The mean score was 2,54 in Criteria 5. Criteria 6 have 12,0 percent no extent, 27,6 low extent, 25,3 medium extent, 12,0 high extent and 11,1 very high extent. The criteria 6 has 3,17 mean score. Criteria 7have 5,8 percent no extent, 10,7 low extent, 32,9 medium extent, 30,7 high extent and 12 percent very high percent. The mean score was 3,08 for Criteria 7. Criteria 8 have 3,6 percent no extent, 34,7 low extent, 31,6 medium extent, 14,2 high extent and 10,7 very high extent. Criteria 8 has 2,77 mean score. Criteria 9 have 7,1 percent no extent, 31,6 low extent, 34,7 medium extent, 16,0 percent high extent and 5,3 very high extent. The mean score was 2,64 for Criteria9. Criteria 10 have 5,8 no extent, 19,6 low extent, 43,6 medium extent, 10,7 high extent and 12,4 percent very high extent. Criteria 10 has 3,08 mean score. Criteria 11 have 11,1 percent no extent, 26,7 low extent, 33,8 medium extent, 10,7 high extent and 8,9 very high extent. The mean score was 2,52 for Criteria 11. Criteria 12 have 8,9 no extent, 13,3 low extent, 32,4 medium extent, 31,1 high extent and 8,9 percent very high extent. Criteria 12 has 3,17 mean score. Criteria 13 have 3,6 no extent, 18,2 low extent, 38,7 medium extent, 21,8 percent high extent and 10,7 very high extent. The mean score was 2,96 for Criteria 13. Finally, Criteria 14 have 12,0 percent no extent, 22,7 percent low extent, 25,3 medium extent, 15,1 percent high extent and 11,6 percent very high extent. The mean score was 2,51 for Criteria 14 (Table 1,2,3,4).
Table 1. Value Proposition Model 14 Criteria Frequency Distribution Criteria 1 Criteria 2 Criteria 3 Criteria 4 Criteria 5 Criteria 6 Criteria 7 N Pct N Pct N Pct N Pct N Pct N Pct N Pct Do Not Know 27 12,0 36 16,0 34 15,1 24 10,7 30 13,3 24 10,7 18 8,0 No Extent 14 6,2 51 22,7 10 4,4 12 5,3 12 5,3 27 12,0 13 5,8 Lox Extent 72 32,0 60 26,7 74 32,9 26 11,6 58 25,8 62 27,6 24 10,7 Medium Extent 73 32,4 37 16,4 62 27,6 66 29,3 76 33,8 57 25,3 74 32,9 High Extent 31 13,8 25 11,1 34 15,1 60 26,7 29 12,9 25 12,0 69 30,7 Very High Extent 8 3,6 15 6,7 11 4,9 34 15,1 20 8,9 3 11,1 27 12,0
Table 2. Value Proposition Model 14 Criteria Frequency Distribution Criteria 8 Criteria 9 Criteria 10 Criteria 11 Criteria 12 Criteria 13 Criteria 14 N Pct N Pct N Pct N Pct N Pct N Pct N Pct Do Not Know 12 5,3 12 5,3 16 7,1 20 8,9 8 3,6 16 7,1 30 13,3 No Extent 8 3,6 16 7,1 13 5,8 25 11,1 20 8,9 8 3,6 27 12,0 Lox Extent 78 34,7 71 31,6 44 19,6 60 26,7 30 13,3 41 18,2 51 22,7 Medium Extent 71 31,6 78 34,7 98 43,6 76 33,8 73 32,4 87 38,7 57 25,3 High Extent 32 14,2 36 16,0 24 10,7 24 10,7 70 31,1 49 21,8 34 15,1 Very High Extent 24 10,7 12 5,3 28 12,4 20 8,9 20 8,9 24 10,7 26 11,6
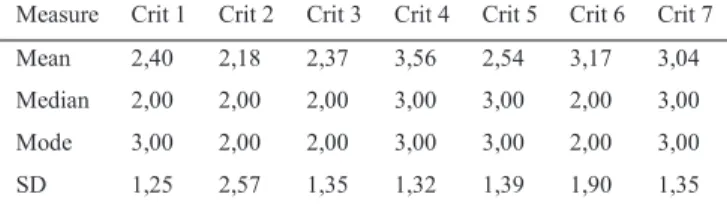
The highest mean scores were found in Criteria 4 (x=3-56), the second in Criteria 6 and 12 (x=3,17) and the third in Criteria 7 and 10 (x=3,08). The lowest mean scores were found in Criteria 2 (x=2,18), the second in Criteria 3 (2,37) and the third one in Criteria 1 (2,40). (Table 3,4).
Table 3. Value Proposition Model 14 Criteria Measures of Central Tendency Measure Crit 8 Crit 9 Crit 10 Crit 11 Crit 12 Crit 13 Crit 14 Mean 2,77 2,64 3,08 2,52 3,17 2,96 2,51 Meadian 3,00 3,00 3,00 3,00 3,00 3,00 3,00 Mode 2,00 3,00 3,00 3,00 3,00 3,00 3,00 SD 1,22 1,15 1,02 1,32 1,44 1,27 1,11
Table 4. Value Proposition Model 14 Criteria Measures of Central Tendency
4. Conclusion
The first research question outlined in the expected results of this study predicted that higher education faculty members in Canakkale Onsekiz Mart University would perceive that each of the five elements that define the HR Value Proposition had been adopted to some extent by the HR operations of their institution. Element % 5 was reported to the highest extent of the five (n=225, 66 %). It means the faculty members perceive that the HR operations are trying to ensure HR professionals. Even if the percentage is at the medium level,, the element has better than the other elements. On the other hand, the lowest percentage was given to Element 1. It means that HR operations in Canakkale Onsekiz MartUniversity does not know enough about external business realities (n=225, 49 %).
rs help line managers deliver strategy by building organization capabilities. The second highest criterias are criteria 6 and criteria 12. It means the crafting HR practices manage people processes in ways that add value and ensuring HR professionalism has staff who play clear and appropriate roles. The third highest score belongs to Criteria 10 that building HR resources has clear strategic planning process for aligning HR investments with business goals.
In conclusion, all 5 of the elements and all 14 of the VPM criteria had been adopted to some extent by HR operations in Canakkale Onsekiz Mart University have low scores. It can be inferred from the data that the value-added roles model for higher education institutions requires a re-definition of HR roles, the development of new competencies, and the implementation of new approaches and outcomes accountability. The human resource operations of Canakkale Onsekiz Mart University seem quite far from the expected level.
References
Brault, A. T., & Beckwith, C. A. (2003). Human resources adding value in higher education. Knoxville, TN: College and University Professional Association for Human Resources.
Brault, A. T., Manning, D., Preston, A. & Sturko, P. (2003). Transforming to a balanced role organization. In A.T. Brault & C. A. Beckwith (Eds.), Human resources adding value in higher education (pp. 51-72). Knoxville, TN: College and University Professional Association for Human Resources.
Browning, G. (2003). What business wants from HR. People Management, 9(22), 106- 107.
Hammonds, K. H. (2005). Why we hate HR. Fast Company, 97, 40-47. Retrieved November 15, 2005, from EBSCOHost database. Joinson, C. (2000). Public sector HR: Leaving bureaucracy behind. HR Magazine, 45(6). Retrieved August 24, 2005, from
http://www.shrm.org/hrmagazine/ 2000index/ 0600/0600joinson.asp
Kemper, J. E. (2001). The role of the human resource office in the collegiate environment and the necessary components of being a strategic partner. Digital Dissertations International, 62(3), 863. (UMI No. 3007462)
Measure Crit 1 Crit 2 Crit 3 Crit 4 Crit 5 Crit 6 Crit 7 Mean 2,40 2,18 2,37 3,56 2,54 3,17 3,04 Median 2,00 2,00 2,00 3,00 3,00 2,00 3,00 Mode 3,00 2,00 2,00 3,00 3,00 2,00 3,00 SD 1,25 2,57 1,35 1,32 1,39 1,90 1,35
Lawler, E. E., & Mohrman, S. A. (2003). Creating a strategic human resources organization: An assessment of trends and new directions. CA: Stanford University Press.
Noe, R. A., Hollenbeck, J. R., Gerhart, B., & Wright, P. M. (2003). Human resources management: Gaining a competitive advantage (4th ed.). New York: McGraw- Hill Higher Education.
Prophal, L. (2002). Getting a seat at the table: What does it really take? Retrieved November 4, 2004, from http://www.shrm.org/hrresources/whitepapers_ published/CMS_000277.asp
Smith, C. S., & Ferris, G. R. (1990). Human resources strategy and planning in higher education. Human Resource Planning, 12(4), 13-25. etrieved June 1, 2004, from ProQuest database.
Ulrich, D. (1997). Human resources champions: The next agenda for adding value and delivering results. Boston: President and Fellows of Harvard College.
Ulrich, D., & Brockbank, W. (2005). The HR value proposition. Boston: Harvard Business School Press.
Ulrich, D., Brockbank, W., & Yeung, A. K. (1989). Beyond belief: A benchmark for human resources. Human Resource Management, 28(3), 311-335. Retrieved January 22, 2005, from ABI/Inform Global database.
Ulrich, D., Brockbank, W., Yeung, A. K., & Lake, D. G. (1995). Human resource competencies: An empirical assessment. Human Resource Management, 34(4), 473-495. Retrieved January 22, 2005, from ABI/Inform Global database.
Weinacker, E.L. (2008). Human Resource Operations in Higher Education. Campella University Publishing. Williams, M. (2002). The war for talent: Getting the best from the best. Wappingers Falls, NY: Beekman Books.
Wright, P., & McMahan, G. (1992). Theoretical perspectives for strategic human resources management. Journal of Management, 18(2), 295-320. Retrieved June 1, 2004, from EBSCOHost database.
Wright, P. M. & Snell, S. A. (1991). Toward an integrative view of strategic human resource management. Human Resource Management Review, 1(3), 203-225.
Zedek, S. & Cascio, W. (1984). Psychological issues in personnel decisions. Annual Review of Psychology, 35, p. 461-519. Zedek, S. & Cascio, W. (1984). Psychological issues in personnel decisions. Annual Review of Psychology, 35, p. 461-519.