Investigation of Dairy Cattle Traits by Using Artificial
Neural Networks and Cluster Analysis
Hülya Atıl1, Asli Akilli2
1Department of Biometry and Genetic, Faculty of Agriculture, Ege University,
Izmir, Turkey
2Department of Biometry and Genetic, Faculty of Agriculture, Ahi Evran University, Kirsehir,
Turkey
Abstract. Artificial neural networks is a method which based on artificial intelligence, has been emerged according to the working principles of the human brain nerve cells. Especially in the modelling of nonlinear systems, with the information learned through experience similarly to humans, it provides classification, pattern recognition, optimization and allows the realization of forward-looking forecasts. Artificial neural networks is very successful method that has been the subject of many studies in different disciplines. Artificial neural network studies performed in animal husbandry in recent years, often located in the literature such as prediction of yield characteristics and classification, animal breeding, quality assessment, disease diagnosis. In this study, classification according to some traits of dairy cattle using artificial neural networks and k-means method are aimed. Due to results of the research, it is determined that artificial neural networks is more successful than the k-means clustering method. The analysis of study was performed using SPSS 20.0 statistical software package and Matlab R2011b work programme.
Keywords: Classification, artificial neural network, dairy cattle.
1 Introduction
One of the key issues in the field of animal breeding studies is classification differences and similarities measure with respect to each other to various characteristics of the animals. The animals’ correct classification which made by the yield property or exterior features provide great advantages manufacturer and farmers.
Conscious breeding work, to be derived from animals is to maximize the level of economic benefits expected in herd management, which plays an important role in maintaining a profitable production. The aim of classification of animals is getting homogeneous in itself, themselves a heterogeneous group. Some of the statistical methods are known as cluster analysis, fuzzy clustering analysis, fuzzy logic, neural networks, and data mining methods used to make classification or clustering for this purpose in farming.
Artificial neural network method is one of the performing machine learning methods based on artificial intelligence. Problems encountered in daily life vary under different conditions. This parallel opposite problem, combined with advances in technology, new methods of solution are produced. Artificial intelligence technologies provide great benefits to the people across the problem way to find a solution on the basis of the system created. Although it is fairly widely used, especially engineering, medicine, agriculture areas etc. artificial neural network is frequently used in recent years. Artificial neural networks is a method that have emerged to move the workings of nerve cells in the human brain. People likewise, it can perform functions such as optimization, prediction, classification, pattern recognition using information learned through experience based on the data. It is very successful method that located in linear and non-linear system the relationship between input and output variables mathematical modelling, in many cases according to conventional statistical methods with low error rates obtained from the analysis results (Takma et al. 2012; Akıllı and Atıl 2014).
In animal science artificial neural network is successfully applied such as diagnosis of diseases such as mastitis and lameness (Yang ve ark. 1999; Cavero et al. 2008; Sun 2008; Hassan et al. 2009; Roush et al. 2001), in the prediction of the forward-looking traits (Grzesiak et al. 2003; Salehi et al. 1998; Sanzogni and Kerr 2001; Kominakis et al. 2002; Hosseinia et al. 2007; Görgülü 2012), animal breeding studies (Shahinfar et al. 2012; Salehi et al. 1997; Grzesiak et al. 2010), in the prediction of the nutrient content in manure (Chen et al. 2008; Chen et al. 2009; Chen et al. 2009) and oestrus detection (Krieter et al. 2006).
In this study, it is aimed using artificial neural networks and k-means clustering method in the framework of the identified variables divided into homogeneous groups of dairy cattle.
2 Material and Method
2.1 Material
The study material consists of records related to 10,000 head of Holstein Friesian dairy cattle for milk, fat and protein yield values with calving interval, age at first calving, milking days and season variables that obtained between 1981-2000 years. Data analysis was carried out using SPSS 20.0 statistical software package programme and MATLAB (R2011b) programme.
2.2 Method
In this study, artificial neural network and k-means clustering method which is one of multivariate statistical methods are used for classification according to the specified characteristics of dairy cattle.
Cluster analysis provides in itself homogeneous and between them heterogeneous group separation unable to obtain precise information about the studied data group
data sets taking into consideration the differences and similarities in that they showed against each other. Cluster analysis is being implemented in three phases such as creation of data matrix, selection of the clustering technique and discussion of the significance of the results (Tatlıdil 1996; Alpar 2011).
In this study, k-means method is used which is one of non-hierarchical clustering methods. In this technique, it is not necessary to determine the similarity and distance matrix. However, it should be noted by the researchers of a possible cluster number (Özdamar 2010). Standardized data variables are used because of having different scale and size value the variables examined in the study. The data is converted to a standard value Z scores [𝑍 ∼ 𝑁 0,1 ].Formula used for this purpose is located in Equation 1 (Kalaycı, 2008).
𝑧 =
(!!!)! (1)
In k-means technique, observations divided into k clusters including the smallest sum of squares within clusters as shown in Equation 2.
2 1 min 1 1 n n i jn i W x a j k n = = − ≤ ≤
∑
(2)According to the rule the observation of classification takes place in the nearest cluster. In the rule; each one x1, x2,...,xn determined number of variables for each observation vector set, a1, a2...akn each group were selected as cluster centres for individuals (Tatlıdil, 1996).
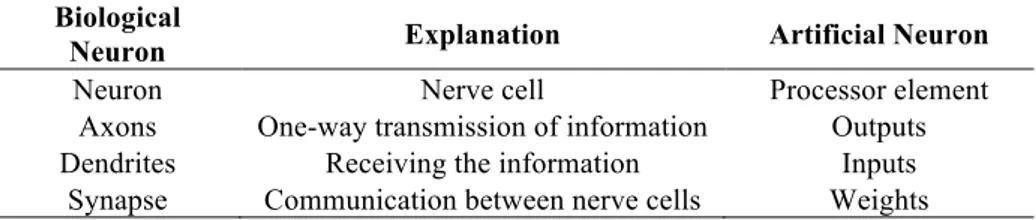
The second method is a method used in the study neural networks. Artificial neuron with a similar operating principle biological nerve cells form a neural network together. Artificial neuron consists of different numbers of inputs and outputs. Inputs pass through the activation function with a sum function to collect information from the outside and generate output. The generated output is transferred to another cell via links to have the neural network (Öztemel, 2006; Negnevitsky, 2001). The comparative view of the biological and neural cells is located in Table 1.
Table 1. Biological neuron and artificial neuron
Biological
Neuron Explanation Artificial Neuron
Neuron Nerve cell Processor element
Axons One-way transmission of information Outputs
Dendrites Receiving the information Inputs
Synapse Communication between nerve cells Weights
Artificial neural networks, is composed of input- output layer and one or different number of hidden layers in between the layers. Received data from the input layer is processed in the hidden layer and then sent to the output layer. Determining the weight value concerning the training of the network that allows nerve cells in neural
networks is an important process. Severity of incoming data is decisive here. Determining the proper amount of weight, it means to make accurate generalizations to do right never seen through examples and thereby create new information. The data of the input variables are converted to output values in the output layer being associated with weight values (Negnevitsky, 2001; Baykal and Beyan, 2004; Öztemel, 2006; Russel and Norvig, 2010; Uğur and Kınacı, 2006).
The studies related to neural networks have led to the emergence of different network structures according to the different problem structure. In the literature, the most commonly used networks single and multilayer perceptrons, vector quantization models (LVQ), self organized map (SOM), adaptive resonance theory (ART), Hopfield network, Elman network, radial basis function network (Öztemel, 2006). Artificial neural networks are classified as feed forward networks, and feedback networks depending on the direction of information flow. Also it is classified according to different learning strategies such as supervised, unsupervised and reinforcement learning. View of the multi-layered artificial neural network is located in Figure 1.
Fig. 1. Multilayer perceptron artificial neural network.
This neural network model used in this study is defined as multilayer perceptron. Multi-layered sensor model operates according to the supervised learning strategy and it has feed forward terms of the direction of flow of information structure. This learning algorithm used in the multilayer perceptron model is designed to work as back-propagation algorithm. Back propagation algorithm operation is performed in two basic stages. The data of the input variables in the first stage is presented to the neural network, in next stage after the processing of data weight in each layer based on the error level is updated on the resulting output and in order to minimize error, the spread of error is provided backwards from the output layer. Levenberg-Marquardt algorithm, which is the back propagation algorithm, the problem structure in this study to investigate suitability, is preferred because the learning error and low running faster than other algorithms.
The number of processor elements in each layer and number of layers in the network structure acts in substantially the operating performance of artificial neural networks. In literature, a specific formula for determining the number of layers and the processor element is not included. In this study, the numbers of processor
elements and layer were determined using detailed literature study for research and trial and error with the heuristic.
Perform the clustering process with the lowest error which layer and the processor element number is determined as the optimal number. Performance criteria used for this, it was determined as the coefficient of determination (R2), the root mean square error (RMSE), mean absolute deviation (MAD) and mean absolute percentage error (MAPE). According to these criteria with high value R2 and error variance expressing the low value of RMSE, MAD and MAPE statistics is the low value indicated that the best fit of the model which is the subject of research. R2, RMSE, MAD and MAPE for the calculation of statistical formulas is located in respectively Equation 3-6. In equations n: number of records, Yi: observed value, : predicted value.
(3)
(4)
(5)
(6) The data are subjected to normalization pre-processing prior to analysis done by the method of artificial neural networks. Normalization process network to reduce the difficulties during the training is done in order to run faster in the training process of the network and the balancing of the importance of the parameters involved in research. In the literature different types of normalization techniques are located. Researchers are different techniques depending on the problem structure may choose (Öztemel 2006; Xu et al, 2007; Jayalakshmi and Santhakumaran, 2011). In this study data [0.1-0.9] range is scaled using the formula in the Equation 7 (Xu et al, 2007). (7) Yi ∧
R
2=
(Y
∧i− Y )
2 i=1 n∑
(Y
i− Y )
2 i=1 n∑
RMSE= (Y∧i− Y )2 i=1 n∑
n MAD= Yi− Yi ∧ i=1 n∑
n MAPE= Yi− Yi ∧ Yi i=1 n∑
n × 100 Pn= 0.1+ (0.9 − 0.1) × (P− Pmin) (Pmax− Pmin)In Equation 7, contained in the data set represents the normalized value as a value P. and , located in the input or output variable indicates the data set having the highest and lowest values of the data. After the normalization process is complete the minimum value of 0.1 and the maximum value of 0.9 is determined in the data set. After network training is completed and the test output data obtained to convert the actual scale of the output, the formula was used in the Equation 8. In next step, made a comparison between the predicted value and actual value and performance criteria is calculated.
(8) P represents the converted value that is transformed pre-normalization.
Before starting the analysis with neural networks dataset completely randomized on the 80% training and 20% testing data set is divided into two different groups namely. 8,000 head of dairy cattle in the training data set and test data set consists of records pertaining to 2,000 head of dairy cattle milk production traits variable.
In this study, a detailed literature review for research and using trial and error, layers and the number of processor elements are determined. Prediction performs operations with the lowest error layer and the number of processor elements has been identified as the most appropriate number. Number of hidden layers is “1” and the number of neuron in this layer is “7” are determined in the neural network designed study. Also, convergence criteria and maximum number of iteration has been recognized as 1x10⁻⁶ and 1000. Animals which have been the subject of research were clustered before analysis by an expert. The methods’ performance was evaluated with the expert opinion. The inputs of model are defined as first calving age model, calving interval, milk with milking day data, the value related to fat and protein yield. The output of the model refers to the group to which it belongs to the subject of dairy cattle research.
3 Results and Discussion
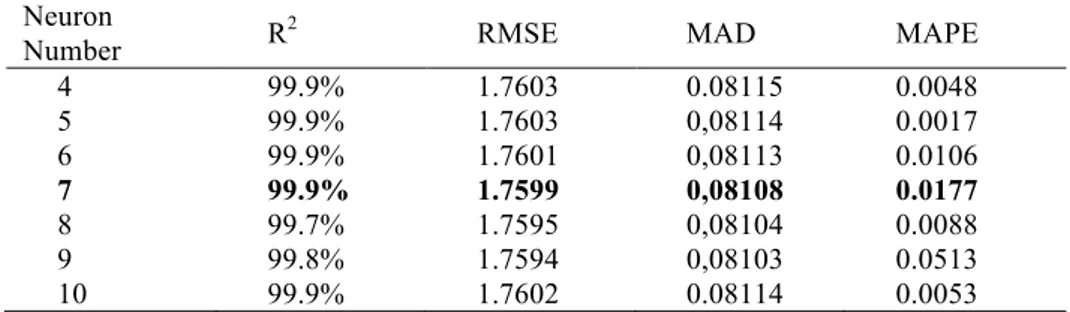
In this study, artificial neural networks, k-means clustering method based on 10,000 head of dairy cattle milk production traits is divided into homogeneous groups. In the result of analysis, animals were included in three different groups. Analysis of the results of artificial neural networks is located in Table 2. According to the results of highest classification success in the case where the number of neurons is provided seven. Here, the neural network which has seven neurons is observed that coefficient of determination of 99.9% and lower levels of error statistics according to the number of other neurons.
P
nP
maxP
minP= (Pn− 0.1) ×(Pmax− Pmin)
Table 2. Artificial neural network test results working with different numbers of neuron.
Neuron
Number R2 RMSE MAD MAPE
4 99.9% 1.7603 0.08115 0.0048 5 99.9% 1.7603 0,08114 0.0017 6 99.9% 1.7601 0,08113 0.0106 7 99.9% 1.7599 0,08108 0.0177 8 99.7% 1.7595 0,08104 0.0088 9 99.8% 1.7594 0,08103 0.0513 10 99.9% 1.7602 0.08114 0.0053
The neural network and k-means method is situated classification performance in Table 3. The method used in the classification process seems to be quite successful relating to dairy cattle. The results indicate that the more successful classification by the k-means method of artificial neural network method.
Table 3. Artificial neural network and K-means results.
Statistics ANN K-means Coefficient of
determination 99.9% 94.9%
RMSE 1.7599 1.7758
MAD 0,08108 0.0002
MAPE 0.0177 0.1048
Artificial neural network and k-means method is located performance values of conformational display in Figure 2.
Classification works done by artificial neural networks are quite common in the livestock area. Hassan et al. (2009) a neural network model used for the detection of mastitis and analysis resulted in success in their study. A like, Yang et al. (2000) in the estimation of clinical mastitis cases with milk production traits studied the availability of artificial neural networks. The study of comparative review of artificial neural networks, Grzesiak et al. (2003) in their study, multiple regression and artificial neural networks methods have used to estimate the 305-day lactation milk yield. Takma et al. (2012), lactation milk yield of Holstein were modelled using multiple regression and neural network. In both studies it noted that the comparison of the results artificial neural networks can be an alternative method to regression analysis.
Fig. 2. Artificial neural network and K-means method results
In this study, artificial neural networks and k-means clustering methods were examined in comparison to their classification and such as mentioned in recent studies methods artificial neural networks that provide very good results.
4 Conclusion
In this study, k-means clustering method and the method of artificial neural networks are used for classification of dairy cattle. When the k-means clustering method and artificial neural network method of classification performance comparison, the neural network is seen as a better fit. The survey results indicate neural networks can be used as an alternative to clustering analysis of animal science methods. Artificial neural network -the machine learning perform and one of the artificial intelligence methods- provide a lower estimate convenience incorrect classification according to the traditional method for researchers. Classification work done by artificial neural networks in the field of animal science in the literature is quite low. In the later stages of this study it is intended to be resources for individuals to do research on this subject. Different neural network models and different input
0,00% 50,00% 100,00% 150,00% 200,00% Coefficient of Determination
RMSE MAD MAPE ANN 0,00% 50,00% 100,00% 150,00% 200,00% Coefficient of Determination
RMSE MAD MAPE K-‐Mean
variables with in studies are expected to give positive results in the classification of animals.
References
1. Akıllı, A. and Atıl, H. (2014) Süt sığırcılığında yapay zeka teknolojisi: Bulanık mantık ve yapay sinir ağları. Hayvansal Üretim, 55(1). p.39-45.
2. Alpar, R. (2011) Uygulamalı çok değişkenli istatistiksel yöntemler. Ankara: Detay Yayıncılık.
3. Baykal, N. and Beyan, T. (2004) Bulanık mantık ilke ve temelleri. Ankara: Bıçaklar Kitabevi.
4. Cavero, D., Tölle, KH., Henze, C., Buxadé, C. and Krieter, J. (2008) Mastitis detection in dairy cows by application of neural networks. Livestock Sci., 114. p.280–286.
5. Chen, LJ., Cui, LY., Xing, L. and Han, LJ. (2008) Prediction of the nutrient content in dairy manure using artificial neural network modeling. J. Dairy Sci., 91. p.4822-4829.
6. Chen, LJ, Xing, L. and Han, LJ. (2009) Quantitative determination of nutrient content in poultry manure by near infrared spectroscopy based on artificial neural networks. Poult Sci., 88(12). p.2496-503.
7. Gorgulu, O. (2012) Prediction of 305-day milk yield in Brown Swiss cattle using artificial neural networks. South African J. Anim. Sci., 42(3). p.280-287.
8. Grzesiak, W., Lacroix, R., Wójcik, J. and Blaszczyk, P. (2003) A comparison of neural network and multiple regression predictions for 305-day lactation yield using partial lactation records. Can. J. Anim. Sci., 83. p.307-310.
9. Grzesiak, W., Zaborski, D., Sablik, P., Żukiewicz, A., Dybus, A. and Szatkowska, I. (2010) Detection of cows with insemination problems using selected classification models. Comput. Electron. Agr., 74 (2). p.265–273. 10. Hassan, KJ., Samarasinghe, S. and Lopez-Benavidest, MG. (2009) Use of neural
networks to detect minor and major pathogens that cause bovine mastitis. J. Dairy Sci., 92. p.1493-1499.
11. Hosseinia, P., Edrisi, M., Edriss, MA. and Nilforooshan, M.A. (2007) Prediction of second parity milk yield and fat percentage of dairy cows based on first parity information using neural networks system. J. Appl. Sci., 7. p.3274-3279.
12. Jayalakshmi, T. and Santhakumaran, A. (2011) Statistical normalization and back propagation for classification. IJCTE 2011, 3(1). p.89-93.
13. Kalaycı, Ş. (2008) SPSS uygulamalı çok değişkenli istatistik teknikler. Ankara: Asil Yayın Dağıtım.
14. Kominakis, AP., Abas, Z., Maltaris, I. and Rogdakis, E. (2002) A preliminary study of the application of artificial neural networks to prediction of milk yield in dairy sheep. Comput. Electron. Agric., 35. p.35-48.
15. Krieter, J., Stamer, E. and Junge, W. (2006) Control charts and neural networks for oestrus detection in dairy cows. Lecture Notes in Informatics. Land- und Ernährungswirtschaft im Wandel -Aufgaben und Herausforderungen für die
Agrar und Umweltinformatik, Referate der 26. GIL Jahrestagung, 6–8 March 2006, Potsdam, p.133–136.
16. Negnevitsky, M. (2002) Artificial intelligence: A guide to intelligent systems. Harlow: Pearson Education.
17. Özdamar, K. (2010) Paket programlar ile istatistiksel veri analizi. Eskişehir: Kaan Kitabevi.
18. Öztemel, E. (2006) Yapay sinir ağları. İstanbul: Papatya Yayıncılık.
19. Roush, WB., Wideman, RF., Jr Cahaner, A., Deeb, N. and Cravener, TL. (2001) Minimal number of chicken daily growth velocities for artificial neural network detection of pulmonary hypertension syndrome PHS. Poultry Sci., 80(3). p.254-259.
20. Russel, S. and Norvig, P. (2010) Artificial intelligence: A Modern Approach. Pearson Education.
21. Salehi, F., Lacroix, R., Yang, XZ. and Wade, KM. (1997) Effects of data preprocessing on the performance of artificial neural networks for dairy yield prediction and cow culling classification. Trans. ASAE, 40(3). p.839-846. 22. Salehi, F., Lacroix, R. and Wade, KM. (1998) Improving dairy yield predictions
through combined record classifiers and specialized artificial neural networks. Comput. Electron. Agric., 20. p.199-213.
23. Sanzogni, L. and Kerr, D. (2001) Milk production estimates using feed forward artificial neural networks. Comput. Electron. Agric., 32. p.21-30.
24. Shahinfar, S., Mehrabani-Yeganeh, H., Lucas, C., Kalhor, A., Kazemian, M. and Weigel, K. A. (2012) Prediction of breeding values for dairy cattle using artificial neural networks and neuro-fuzzy systems. Comput. Math. Methods Med., Volume 2012, Article ID 127130.
25. Sun, Z. (2008) Application of artificial neural networks in early detection of mastitis from improved data collected on-line by robotic milking stations. Dissertation, Lincoln University, New Zealand.
26. Takma, Ç., Atıl, H. and Aksakal, V. (2012) Çoklu doğrusal regresyon ve yapay sinir ağı modellerinin laktasyon süt verimlerine uyum yeteneklerinin karşılaştırılması. Kafkas Üniv. Vet. Fak. Derg., 18(6). p.941-944.
27. Tatlıdil, H. (1996) Uygulamalı çok değişkenli istatistiksel analiz. Ankara: Cem Web Ofset.
28. Uğur, A. and Kınacı, AC. (2006) Yapay zeka teknikleri ve yapay sinir ağları kullanılarak web sayfalarının sınıflandırılması. Inet-tr 2006, XI. Türkiye’de İnternet Konferansı, TOBB Ekonomi ve Teknoloji Üniversitesi, Ankara, 21-23 Aralık 2006.
29. Xu, L., Jiandong, X., Shizhong, W., Yongzhen, Z. and Rui L. (2007) Optimization of heat treatment technique of high-vanadium high-speed steel based on back-propagation neural networks. Mater Des., 28. p.1425–1432. 30. Yang, XZ., Lacroix, R. and Wade, KM. (1999) Neural detection of mastitis from
dairy herd improvement records. Trans. ASAE, 42(4). p.1063-1071.
31. Yang, XZ., Lacroix, R. and Wade, KM. (2000) Investigation into the production and conformation traits associated with clinical mastitis using artificial neural networks. Can. J. Anim. Sci., 80. p.415–426.