SHORT AND LONG TERM ANOMALIES
IN INITIAL PUBLIC OFFERINGS
LEVENT ÖZER
105664022
İSTANBUL BİLGİ ÜNİVERSİTESİ
SOSYAL BİLİMLER ENSTİTÜSÜ
ULUSLARARASI FİNANS YÜKSEK LİSANS PROGRAMI
Thesis Advisor:
Prof. Dr. Oral ERDOĞAN
SHORT AND LONG TERM ANOMALIES
IN INITIAL PUBLIC OFFERINGS
HALKA ARZLARDA
KISA VE UZUN DÖNEM ANOMALİLER
LEVENT ÖZER
105664022
Tez Danışmanının Adı Soyadı (İmzası) : Prof. Oral ERDOĞAN………. Jüri Üyelerinin Adı Soyadı (İmzası) :Prof. Gülten KAZGAN………. Jüri Üyelerinin Adı Soyadı (İmzası) :Prof. Cemal İBİŞ……….
Tezin Onaylandığı Tarih :………..
Toplam Sayfa Sayısı :…87………...
Anahtar Kelimeler Keywords
1) İlk Halka Arz 1) Initial Public Offerings 2) Düşük Fiyatlama 2) Underpricing
3) Uzun dönem düşük performans 3) Long Term Underperformance 4) Istanbul Menkul Kıymetler Borsası 4) Istanbul Stock Exchange
Abstract
Regardless of the method for pricing, many studies both in developed and emerging markets show that the IPOs are underpriced. This first anomaly in the IPO markets has puzzled researchers since 1970s and there is a huge amount of studies on this subject. Another anomaly in the IPO market is generally defined as the “hot issue” markets implies that there are cycles in terms of volume and number. The third anomaly in the IPO markets is known as the long run underperformance. Long run underperformance is usually proven by using 3 years cumulative market adjusted returns after the IPO. But some studies indicate that the long run underperformance can go up to six years. Why do the IPOs systematically underperform the market? Although there are some other theories for the long run underperformance, one of the most important one indicates that the initial pricing of the IPO causes this anomaly. So, the first anomaly is a part of the answer of the third one or in other words the factors behind the performance of the future periods may lie back to the IPO process 3 or more years ago.
This study mainly focuses on the anomalies especially the first and the third ones in the IPO markets. After reviewing the literature about the anomalies mentioned above there is an empirical study for the Istanbul Stock Exchange to determine the validity of these anomalies in Turkey and the factors behind them.
In parallel to the literature, raw return, adjusted return, cumulative return, WR values, indexing and regression analysis were used in the study. Findings prove that both underpricing and long run underperformance anomalies exist in ISE. Especially market conditions, number of investors, IPO offering rate, in some cases sals method were found as statistically important factors for underpricing in the ISE. Another important finding is that underpricing causes long run underperformance.
Özet
İlk halka arzlarda, gerek gelişmiş gerekse gelişmekte olan piyasalara ilişkin yapılan çalışmalarda düşük fiyatlama anomalisi gözlenmektedir. Halka arz piyasalarına ilişkin ilk anomali olan düşük fiyatlamayla ilgili 1970’lerden başlayan çok geniş bir literatür oluşmuştur. Halka arz piyasalarına ilişkin ikinci anomali gerek sayı olarak gerekse hacim olarak bu piyasalarda dönemsellik bulunmasıdır.
Üçüncü anomali ise halka arzların uzun dönem düşük performansı olarak adlandırılmaktadır. Uzun dönem performans genellikle 3 yıllık birikimli piyasaya göre düzeltilmiş getiriler baz alınarak ölçülmektedir. Bazı çalışmalar uzun dönem düşük performansın halka arzdan sonraki altıncı yılda dahi devam ettiğini göstermektedir. Bu anomaliyi açıklamaya yönelik farklı teoriler olmakla birlikte düşük performansın nedenlerinin halka arza bağlı olduğuna yönelik teoriler bulunmaktadır. Bir başka ifadeyle “uzun dönem düşük performans” anomalisine kısmen düşük fiyatlama anomalisi neden olmaktadır. Dolayısıyla bugün için düşük performans gösteren bir şirketin bu performansının nedenlerinden bazıları üç veya daha fazla yıl öncesindeki halka arz sürecinde aranabilir.
Bu çalışmada konuyla ilgili literature araştırmasının yapılarak söz konusu anomalilerden özellikle halka arzlarda düşük fiyatlama ve uzun dönem düşük performans anomalilerinin İMKB için varlığı araştırılarak nedenleri tespit edilmeye çalışılmıştır.
Konuyla ilgili literatüre benzer şekilde, basit getiriler, log getiri, düzeltilmiş getiri, kümülatif getiri, WR değerleri, endeksleme ve regresyon analizi kullanılan temel yöntemlerdir. Bulgular İMKB’de düşük fiyatlama ve uzun dönem düşük performans anomalilerinin mevcut olduğunu göstermektedir. Farklı modeller kullanılmış olmasına karşılık genelikle piyasa koşulları, yatırımcı sayısı, halka arz oranı, bazı durumlarda satış yöntemi istatistiki olarak nu anomalileri kısmen açıklayana değişkenler olarak tespit edilmiştir. Bir diğer önemli sonuç düşük fiyatlamanın aynı zamanda uzun dönem düşük performansa neden olmasıdır.
TABLE OF CONTENTS
1 INTRODUCTION... 9
2 GOING PUBLIC AND IPO ... 12
2.1 Going Public and Alternatives ... 12
2.2 Theories on Going Public ... 13
2.2.1 The costs of going public ... 14
2.2.1.1
Adverse selection ... 14
2.2.1.2
Administrative expenses and fees... 14
2.2.1.3
Loss of confidentiality ... 15
2.2.2 The benefits of going public ... 15
2.2.2.4
Overcoming borrowing constraints ... 15
2.2.2.5
Liquidity and portfolio diversification ... 16
2.2.2.6
Monitoring... 16
2.2.2.7
Investor recognition... 17
2.2.2.8
Change of control ... 17
2.2.2.9
Windows of opportunity... 17
2.2.3 Going public and Turkish Companies... 19
3 ANOMALIES IN IPOs ... 23
3.1 Underpricing ... 23
3.1.1 Theories of Initial Underpricing... 24
3.1.1.1Asymmetric Information Models ... 24
3.1.1.1.1 The Winner’s Curse... 24
3.1.1.1.2 Information Revelation Theories... 28
3.1.1.1.3 Principal–Agent Models ... 30
3.1.1.1.4 Underpricing as a Signal of Firm Quality... 31
3.1.1.2
Institutional Explanations... 32
3.1.1.2.5 Legal insurance or lawsuit avoidance hypothesis ... 32
3.1.1.2.6 Tax Arguments... 34
3.1.1.3
Ownership and Control ... 35
3.1.1.3.7 Underpricing as a Means to Retain Control... 35
3.1.1.4
Behavioral Explanations ... 36
3.1.1.4.1 Cascades ... 37
3.1.1.4.2 Investor Sentiment ... 38
3.1.1.4.3 Prospect Theory and Mental Accounting... 39
3.2 Hot Issue Markets... 41
3.3 Long Term Underperformance of IPOs... 43
3.3.1 The divergence of opinion hypothesis ... 44
3.3.2 The impresario hypothesis ... 44
3.3.3 The windows of opportunity hypothesis ... 45
4 EMPRICAL ANALYSIS... 46
4.1 IPO Underpricing, Evidence from International Studies... 46
4.2 Statistics about IPOs in ISE ... 51
4.3 Underpricing in ISE ... 54
4.4 Long Run Underperformance of IPOs in ISE... 64
4.5 Regression Analysis ... 77
LIST OF TABLES
Table 1. Benefits of Going Public... 18
Table 2. Costs of Going Public... 18
Table 3. IPO Underpricing Country Studies... 49
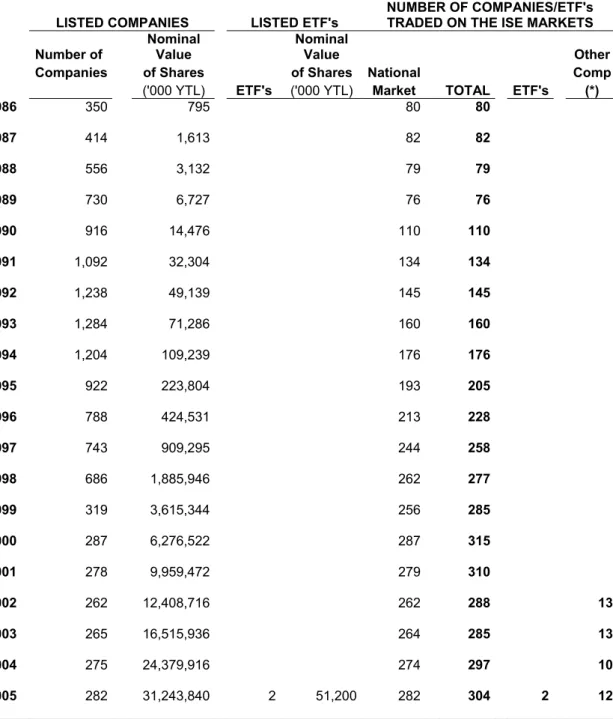
Table 4. Number of Companies at the Istanbul Stock Exchange ... 51
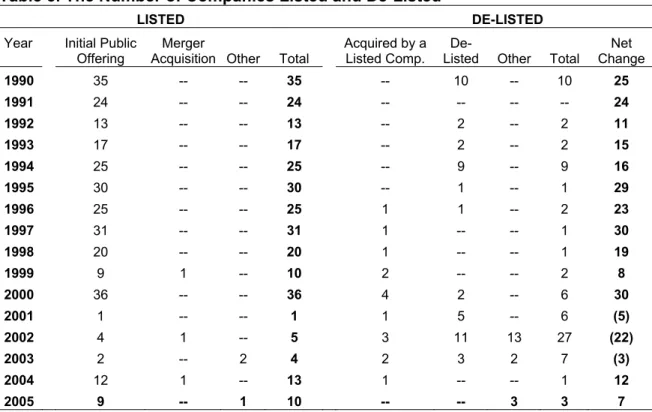
Table 5. The Number of Companies Listed and De-Listed ... 52
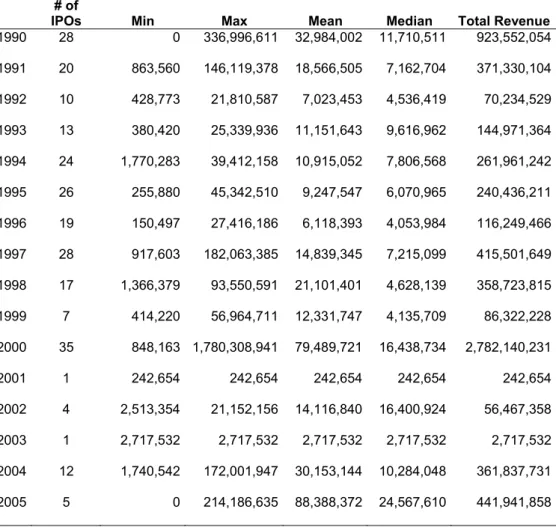
Table 6. Descriptive Statistics of IPOs Revenues (1990-2005)... 54
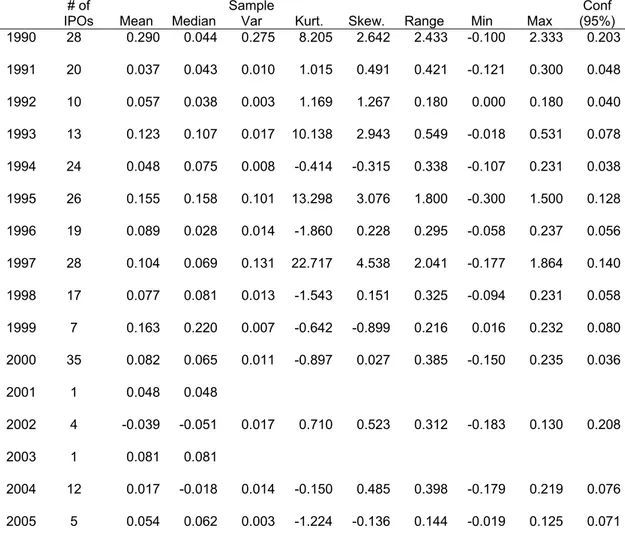
Table 7. Descriptive Statistics on IPO First Day Raw Returns (1990-2005)56 Table 8. Descriptive Statistics on IPO First Day Adjusted Returns (1990-2005) ... 57
Table 9. Money Left on the Table at the IPOs in the ISE... 63
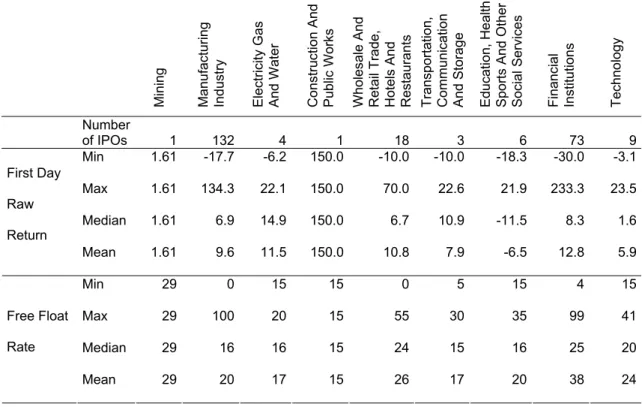
Table 10. Sectorial Breakdown of IPOs and Underpricing ... 64
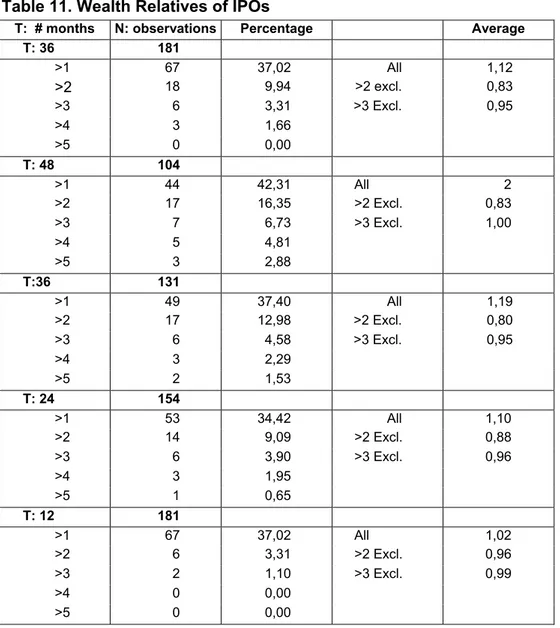
Table 11. Wealth Relatives of IPOs ... 68
Table 12. WR Values for Main Sectors ... 69
Table 13. Manufacturuing Industry Sub-Sectorial WR Values ... 70
Table 14. Wholesale and Retail Trade, Hotels and Restaurants Sub-Sectorial WR Values ... 70
Table 15. Financial Institutions Sub-Sectrial WR Values ... 71
Table 16. WR Values for 1998-2003... 73
LIST OF GRAPHS
Graph 1. Average initial returns by month for S.E.C.-registered IPOs in the
U.S. during 1977-96 ... 41
Graph 2. The number of IPOs by month in the U.S. during 1977-96, excluding closed-end fund... 42
Graph 3. Number of IPOs per Month in the ISE... 42
Graph 4. IPOs by month in ISE ... 43
Graph 5. IPO Returns in the United States: 1960-2003 ... 46
Graph 6. IPO Returns in Europe: 1990-2003 ... 47
Graph 7. IPO Returns in Asia-Pacific and Latin America: 1990-2001 ... 48
Graph 8. IPOs Offer Rate (1990-2005) ... 53
Graph 9. Histogram of Offer Rate ... 53
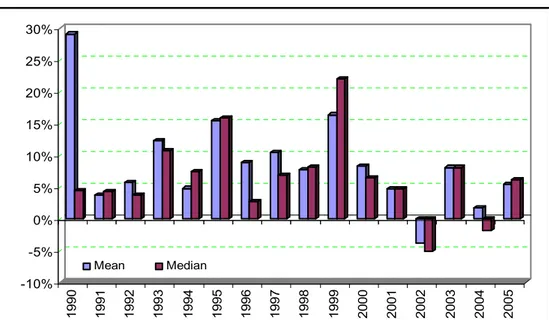
Graph 10. Mean and Median of IPOs’ First Day Simple Raw Returns (1990-2005) ... 57
Graph 11. Histogram of First Day Returns of IPOs... 59
Graph 12. Histogram of First Day Returns of IPOs (without outliers) ... 59
Graph 13. 5 Year Period Histogram... 60
Graph 14. Long-Term Market Adjusted Returns of IPOs... 65
Graph 15. Weekly Market Adjusted Returns of IPOs... 66
Graph 16. Cumulative Adjusted Returns for 500 Days ... 67
Graph 17. Histogram of First Day Raw Returns (1998-2003)... 71
Graph 18. Daily Market Adjusted Returns ... 72
Graph 19. Daily CAR Values ... 73
Graph 20. Performance Comparison of IPOS With Respect to The Control Group... 75
LIST OF ABBREVIATIONS
AR: Adjusted Return
CAR: Cumulative Adjusted Return CMB: Capital Markets Board IPO: Initial Oublic Offering ISE: Istanbul Stock Exchange MC: Market Capitilization YTL: New Turkish Lira
CHAPTER I
1 INTRODUCTION
The macro economic view suggests that the aim of the corporations or firms is profit maximization. As the capital markets get more efficient, the aim of both the corporate owners and the shareholders get closer. In perfect markets where it is possible to invest in financial instruments with minimum trading costs, it is assumed that the investors invest in the firms with the incentive to maximize their welfare.
The firms can provide the finance that they need for achieving their goals and continue their activities from internal and external sources. Especially in the early stages of the establishment process, the internal sources play an important role. However in the growth period, as the internal sources are scarce, firms need more external capital sources. If there are not venture capitalists or investment angels as in the case of most emerging markets, there are limited instruments for the new firms that have a high growth potential to find funds. One way is to get finance through debt instruments (credit institutions or bond offering), and the other way is the public offering. Generally, firms provide short term funds through credits and long term financial needs through capital markets by issuing bonds or shares. Stock exchanges play a vital role in the financial system by constructing a
balance between the fund supply and demand, allocating the funds efficiently in terms of quantity and maturity.
Especially in emerging countries where the public sector borrowing requirement is high, due to the crowding out effect, the interest rates are high. As a result, the credit interest rates and the cost of funds by credits are high. Besides, the crowding out effect prevents the firms to raise funds through bills and bonds offerings. Also the policy of high interest rate and low currency to attract the foreign investors increases the cost of finance. As an alternative source of finance, firms can go public. When a firm decides to go public, the pricing problem occurs. Pricing of an IPO is important for all related parties namely the firm, investors, employers, underwriters. In principal, valuing IPOs is not different from valuing other stocks. The common approaches of discounted cash flow analysis and/or comparable firms analysis can be used. In the case of IPOs of the young growth firms in high technology industries, historical accounting information is of limited use in projecting future profits or cash flows. Thus, a preliminary valuation may rely heavily on how the market is valuing comparable firms. In some cases, publicly-traded firms in the same line of business are easy to find. In other cases, it may be difficult to find publicly-traded “pure plays” to use for valuation purposes.
Regardless of the method for pricing many studies both in developed and emerging markets show that the IPOs are underpriced and IPO underpricing has become a financial anomaly and has puzzled researchers since 1970s. Why do the firms leave money on the table? There are many theories aiming at explaining this financial anomaly. Since some of them
are very case or country specific, only main theories will be discussed in detail in the following chapters.
Another anomaly in the IPO market is generally defined as the “hot issue” markets. This will be shortly handled in this study.
The third anomaly known as the long run underperformance of IPOs will also be discussed in detail in the following chapters. This anomaly is a less studied field than the underpricing in the literature. Long run underperformance is usually proven by using 3 years cumulative market adjusted returns after the IPO. But some studies indicate that the long run underperformance can go up to six years. Why do the IPOs systematically underperforms the market? Although there are some other theories for the long run underperformance, one of the most important one indicates that the initial pricing of the IPO causes this anomaly. So, the first anomaly is a part of the answer of the third one or in other words the factors behind the performance of the future periods may lie back to the IPO process 3 or more years ago.
This study mainly focuses on the above mentioned anomalies especially the first and the third ones in the IPO markets. The first chapter mainly focuses on the factors that determine the going public or not going public decision. The case of Turkish firms will also be handled shortly. The next chapter captures the models or theories aiming at explaining the anomalies mentioned above. After reviewing the literature, there is an empirical study for the Istanbul Stock Exchange to determine whether these anomalies exist in Turkey.
CHAPTER II
2 GOING PUBLIC AND IPO
The decision to go public is one of the most important and least studied questions in corporate finance. Most corporate finance textbooks limit themselves to describing the institutional aspects of this decision, providing only a few remarks on its motivation. The conventional wisdom is that going public is simply a stage in the growth of a company. Although there is some truth in it, this theory alone cannot explain the observed pattern of listings. Even in developed capital markets, like the U.S., some large companies are not public. In other countries, like Germany and Italy, publicly traded companies are the exceptions rather than the rule, and quite a few private companies are much larger than the average publicly traded company. These cross-sectional and cross-country differences indicate that going public is not a stage that all companies eventually reach, but is a choice. This begs the question of why some companies choose to use public equity markets and some don't.
2.1 Going Public and Alternatives
The firms can provide the financial sources which they need to make investments, sales etc. through internal and external sources. At the early stages of establishment most of the firms prefer the internal sources. The reason is that the value of a young firms depends on the growth potential
more than assets, it is hard for the investors to value these firms correctly
[
Ibbotson, Ritter, (1995), 1007]
. From the firm’s point of view, internal finance is the source that the problems arising form information asymmetry is minimum. However the scare internal sources will restrict the growth potential of a firm. In developed countries especially in the USA, one alternative for these firms is the investment angels or venture capital. Both are not valid for most of the developing countries. An alternative to find funds for the firms in developing countries is going public. For a successful offering in the going public process, and getting funds with low cost, the timing and the pricing would be important. It is also important for the success of the secondary offerings and diminish the cost of funding. The costs in the going public process can be divided into two groups namely, direct and indirect costs [Ibbotson, Ritter, (1995), 993]. The direct costs are mainly the money paid to the intermediaries or underwriters and the legal institutions, the indirect costs are the effort and time spent by the management. The total cost and the pros and cons of going public are the important factors for a firm’s decision to go public or not. Although there may be other incentives or legal environment for different countries, there are many theories or hypothesis aiming to explain the going public process.2.2 Theories on Going Public
The decision to go public is so complex that no single model can hope to capture all of the relevant costs and benefits. But almost all of the effects of this decision have been evaluated in one model or another.
2.2.1 The costs of going public
2.2.1.1 Adverse selection
Adverse selection mainly focuses on the informational asymmetry between issuers and investor. In general it is assumed that investors are less informed than the issuers about the true value of the companies going public. As indicated by (Leland and Pyle, 1977), (Rock (1986), this informational asymmetry adversely affects the average quality of the companies seeking a new listing and thus the price at which their shares can be sold. Especially in case of the listing of young and small companies, the adverse selection cost is a more serious obstacle than for old and large companies, as mentioned by Chemmanur and Fulghieri (1995). If there is adverse selection, the probability of going public should be positively correlated with the age and/or the size of a company.
2.2.1.2 Administrative expenses and fees
As mentioned before, besides the initial under pricing, going public have direct costs such as underwriting fees, registration fees, etc. Also after IPO there are the yearly layouts on auditing, certification and dissemination of accounting information, stock exchange fees, etc. Since many of these expenses do not increase proportionally with the size of the IPO, they weigh relatively more on small companies. Ritter (1987) has estimated that in the US the fixed costs equal approximately $250,000 and the variable costs are about 7 percent of the gross proceeds of the IPO. Taking these variable costs into account and the existence of fixed costs of listing implies that the likelihood of an IPO should be positively correlated with company size.
I would like to add that being registered by the exchange or the capital markets boards may bring additional expenses for the firms after the IPO. Especially if most of the other firms in the same sector are unregistered, the firms going public can lose competitive advantage.
2.2.1.3 Loss of confidentiality
Stock exchanges’ regulations or rules on the disclosure requirement may force companies to disclose the data about R&D projects or future marketing strategies that may be crucial for their competitiveness. They also expose them to close scrutiny from tax authorities, reducing their scope for tax elusion and evasion relative to private companies. This point was first pointed by Campbell (1979), Yosha (1995) has shown that in equilibrium firms with more sensitive information are deterred from going public if the costs of a public offering are sufficiently high. So we can expect that there is a negative correlation between the R&D intensity of an industry and the probability of an IPO.
2.2.2 The benefits of going public
2.2.2.4 Overcoming borrowing constraints
Gaining access to a source of finance alternative to banks is probably the most cited benefit of going public, which is explicitly or implicitly present in most models. The opportunity to tap public markets for funds should be particularly appealing for companies with large current and future investments, high leverage, and high growth. All these factors should be positively related with the likelihood of an IPO [Pagano, Panette, Zingales, 1997].
By gaining access to the stock market and disseminating information to the generality of investors, a company elicits outside competition to its lender and ensures a lower cost of credit, a larger supply of external finance or both, as highlighted by Rajan (1992). The prediction here is that companies facing higher interest rates and more concentrated credit sources are more likely to go public, and credit will become cheaper and more readily available after an IPO, controlling for profitability and leverage.
2.2.2.5 Liquidity and portfolio diversification
As many market microstructure models show, the liquidity of a company's shares is an increasing function of the trading volume. Share trading on an organized exchange is cheaper, especially for small shareholders. This creates another reason to expect a positive relationship between size and the likelihood of an IPO. Going public also provides diversification. This can be achieved directly, by divesting from the company and reinvesting in other assets, or indirectly, by having the company raise fresh equity capital after the IPO and acquire stakes in other companies. If diversification is an important motive in the decision to go public, as in Pagano (1993), it is reasonable to expect riskier companies to be more likely to go public, and controlling shareholders to sell a large portion of their shares at the time of the IPO or soon afterwards [Pagano, Panette, Zingales, 1997].
2.2.2.6 Monitoring
As mentioned by Holmstrom and Tirole (1993) going public, provides a managerial discipline, both by creating the danger of hostile takeovers and by exposing the market's assessment of managerial decisions. More efficient compensation schemes for their managers can be designed, (e.g.
indexing their salaries to the stock price or by offering them stock options). Also recently many exchanges have corporate governance rules or principles that force the firms to work more efficiently.
2.2.2.7 Investor recognition
In most of the emerging markets going public is an additional prestige for the firm. Listing on a major exchange can act as an advertisement for the company. Merton (1987) has captured this point in a capital asset pricing model with incomplete information, showing that stock prices are higher the greater the number of investors aware of the company's securities. In a study made by Kadlec and McConnell (1994), there is an indirect support that when companies already listed elsewhere announce to dual listing in New York, their stock yields a 5% percent abnormal return on average.
2.2.2.8 Change of control
In this model IPO is a step for the owner who wants to sell the company. The decision of a firm to go public is the result of a value maximizing decision made by an initial owner who wants to eventually sell his company. By going public, the initial owner can change the proportion of cash flow rights and control rights which he will retain when he bargains with a potential buyer Zingales (1995).
2.2.2.9 Windows of opportunity
In times of the bull’s markets sometimes the stock prices rise so much that the link between the company’s real value and market value differs seriously. If there are periods in which stocks are mispriced, as suggested by Ritter (1991), companies which realize that other companies in their industry are overvalued have an incentive to go public. In some papers the
buoyancy of the relevant market is measured by the median market-to-book ratio of public companies in the same industry. A high market-to-market-to-book ratio may alternatively indicate that rational investors place a high valuation on the future growth opportunities in the industry.
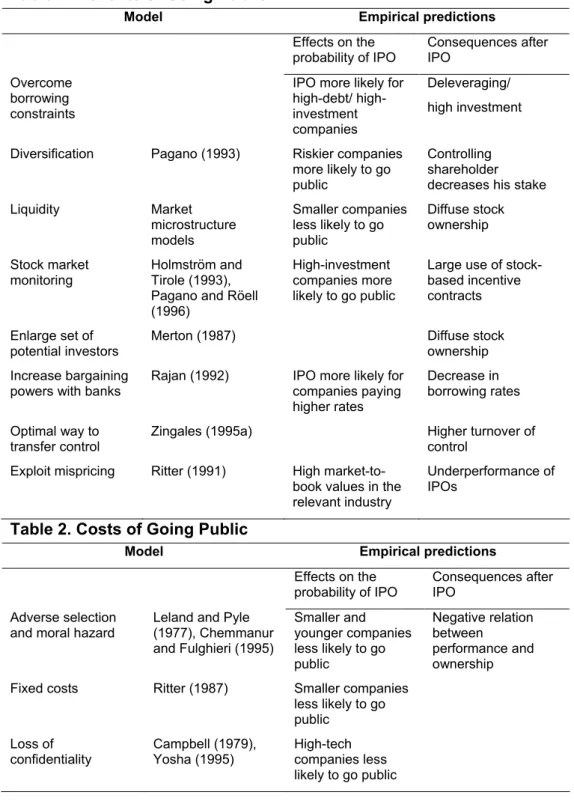
Table 1. Benefits of Going Public
Model Empirical predictions
Effects on the probability of IPO Consequences after IPO Overcome borrowing constraints
IPO more likely for debt/ high-investment companies
Deleveraging/ high investment Diversification Pagano (1993) Riskier companies
more likely to go public
Controlling shareholder decreases his stake Liquidity Market microstructure models Smaller companies less likely to go public Diffuse stock ownership Stock market monitoring Holmström and Tirole (1993), Pagano and Röell (1996)
High-investment companies more likely to go public
Large use of stock- based incentive contracts Enlarge set of
potential investors
Merton (1987) Diffuse stock
ownership Increase bargaining
powers with banks
Rajan (1992) IPO more likely for companies paying higher rates
Decrease in borrowing rates Optimal way to
transfer control Zingales (1995a) Higher turnover of control
Exploit mispricing Ritter (1991) High market-to-book values in the relevant industry
Underperformance of IPOs
Table 2. Costs of Going Public
Model Empirical predictions
Effects on the
probability of IPO Consequences after IPO Adverse selection
and moral hazard Leland and Pyle (1977), Chemmanur and Fulghieri (1995) Smaller and younger companies less likely to go public Negative relation between performance and ownership
Fixed costs Ritter (1987) Smaller companies
less likely to go public Loss of confidentiality Campbell (1979), Yosha (1995) High-tech companies less likely to go public
2.2.3 Going public and Turkish Companies
The Capital Markets Board (CMB) of Turkey had two questionnaires relating to going public as a source of finance in 1991 and 1996. These questionnaires provide important clues on the financial structure of the Turkish firms, the important factors in their financial decision and on the determination of the factors that prevent them going public.
The summary of some of the important points in these questionnaires are as follows. The cost of the funds is usually more important for the firms than the maturity, when deciding to find the financial sources they need for their investments. The first source in for the working capital is the short term bank credits. The second important sources are the commercial borrowings. Although the firms need long term funds they choose short term borrowings as the cost is lower. Considering the financial situation of Turkey in those years this may be logical for the firm. Some of the firms (12%) prefer borrowing from abroad not only for the cost is lower but also it is easier to provide the sources in a shorter time. 86% of the firms declared that they never used capital markets as a source of finance. In 1991, 90.2% of the firms in the questionnaire stated that they will never use the capital markets or they don’t think about going public at any time. Most of the firms declared that they didn’t want to go public as they didn’t need this fund or they were afraid to loose the control of the firm. Although the firms stated the two main reasons as follows, on the other hand the firms thinking an IPO stated that they wanted to go public as the cost of the funds are lower and the maturity is longer. In the later questionnaire the firms mentioned that some tax or investment incentives for the public firms would promote going public.
Another important factor preventing the firms going public at those times was that the distinction between public firms and the publicly traded firms and being listed in the exchange was not clear.
The firms were accepted public if the shares were distributed among more than 250 people (100 investors were adequate for being a public firm in the previous regulation). So the firms could increase the number of their investors artificially without being listed or traded in the Istanbul Stock Exchange (ISE) to get the incentives for the public firms.
The latest ISE regulation on the initial listing of securities representing partnership rights is as follows.
Article 13- If the securities representing partnership rights are being listed
initially, the application must cover the entire securities of same type issued until the application date, and for the corporation;
a) The financial statements of the company for the last three years
including the one for the respective quarter must have been independently audited,
b) At least three calendar years must have elapsed since the establishment
of the corporation and financial statements of the last three years must have been publicly disclosed,
c) The corporation must have made profits before tax in the last two
consecutive years prior to the application date (it should have made profits in the previous year if the market capitalization of the publicly offered shares is at least YTL 33 million¹ or if the free-float rate is at least 35%),
d) The shareholders’ equity in the last independently audited financial
statement of the corporation must be at least YTL 11 million,
e) Market capitalization of the publicly offered shares of the corporation
must be at least YTL 17 million and the rate of the nominal value of these shares to paid-in or issued capital must be at least 25% (if this rate is below 25%, market capitalization of the publicly offered shares must be at least YTL 33 million),
f) The Exchange management must have had the corporation’s financial
structure examined and accepted its ability to continue as an ongoing concern,
g) The corporation’s Articles of Incorporation must not include any
provisions restricting the transfer and circulation of the securities to be traded on the Exchange or preventing the shareholders from exercising their rights,
h) Significant legal disputes which might affect the corporation’s production
or activities must not exist,
i) For reasons other than acceptable to the Exchange, the corporation must
not have suspended its production activities for more than three months within the previous year, not filed for liquidation or entered into composition or any other arrangement with its creditors, and not have faced similar situations determined by the Exchange,
j) The corporation’s securities must comply with the criteria pre-determined
k) It must be documented that the corporation’s legal situation in terms of
its establishment and activities as well as the legal situation of its shares comply with the respective legislation.
For the securities with special characteristics such as securities with no voting rights and the securities with attached privileges, Executive Council may decide to demand additional requirements as well as may not ask for some conditions stated in section one.
The amounts stated in section one, subsection (c), (d) and (e) may be increased by the Executive Council considering the average increase in the wholesale price index published by the State Institute of Statistics.
CHAPTER III
3 ANOMALIES IN IPOs
3.1 Underpricing
In principal, valuing IPOs is no different from valuing other stocks. The common approaches of discounted cash flow analysis and/or comparable firms analysis can be used. In the case of IPOs are of young growth firms in high technology industries, historical accounting information is of limited use in projecting future profits or cash flows. Thus, a preliminary valuation may rely heavily on how the market is valuing comparable firms. In some cases, publicly-traded firms in the same line of business are easy to find. In other cases, it may be difficult to find publicly-traded “pure plays” to use for valuation purposes. The question is that if these analyses work for valuation why is there a systematic underpricing in the IPOs market? IPO underpricing has become a financial anomaly and has puzzled researchers since Stoll and Curley (1970 and Ibbotson (1975) first documented the IPO underpricing on the US markets. It is obvious that underpricing is a cost for companies that go public. Therefore, the determination of the initial price of a share is very important. If the price is high, the demand for the shares can will be decreased and the IPO will be unsuccessful and if the price is low, it is “money left on the table” for the company. The first anomaly namely the “underpricing” is examined in many studies in literature, both for developed and developing markets.
As many markets have the underpricing in IPOs, there existed a great literature on the issue. Although the reasons can be country specific, the theories or hypothesis aiming at explaining the underpricing phenomenon are usually grouped as the asymmetric information models, institutional explanations, ownership and control, behavioral explanations.
3.1.1 Theories of Initial Underpricing
3.1.1.1 Asymmetric Information Models
3.1.1.1.1 The Winner’s Curse
Asymmetric information models of underpricing assume that one of the parties, namely the issuing firm, the bank underwriting and marketing the deal, and the investors buying the stock in an IPO, knows more than the others. The first model based on this assumption is the Rock’s “winner curse” model which is actually based on the application of Akerlof’s (1970) lemons problem. In Rock’s model there are the investors groups in the market that are divided as the informed and uninformed. Rock’s (1986) winner’s curse model turns on information heterogeneity among these investors. Assuming that some investors are better informed about the true value of the shares on offer than are investors in general, the issuing firm, or its underwriting bank Rock stated that when informed investors would only bid for attractively priced IPOs. This imposes a ‘winner’s curse’ on uninformed investors. In unattractive offerings, they receive all the shares they have bid for, while in attractive offerings, their demand is partly crowded out by the informed. So one of the most important result of this model is that underpricing is lower if information is distributed more homogeneously across investor groups. There are many empirical studies
on this model. Michaely and Shaw (1994) argue that as the information heterogeneity goes to zero, the winner’s curse disappears and so the underpricing. At the heart of the winner’s curse model is the idea that, if properly adjusted for rationing, uninformed investors’ abnormal returns are zero, on average – that is, just enough to ensure their informed, in order to avoid the unattractive IPOs [Ljungqvist, 2005].
Rock assumes that as the demand of only the informed investors would be insufficient to occupy all shares on offer even in attractive offerings, the primary market is dependent on the continued participation of uninformed investors. The natural outcome of this assumption is that all IPOs must be underpriced.
Another assumption of the Rock’s model is that firms going public benefit from underpricing, because it is the key to ensuring the continued participation in the IPO market of the uninformed, whose capital is needed by assumption. However this causes a dilemma, on the other hand as underpricing is clearly costly to a firm going public. Beatty and Ritter (1986) argue that as repeat players, investment banks have an incentive to ensure that new issues are underpriced by enough lest they lose underwriting commissions in the future. Investment banks thus coerce issuers into underpricing. Of course, they cannot underprice too much for fear of losing underwriting market share.
The earliest study of Koh and Walter’s (1989) analyze Singapore. During the 1970s and 1980s oversubscribed IPOs were allocated by random ballot. This system provides that if two investors bidding for the same number of shares they had an equal chance of receiving an allocation. Using data on 66 IPOs, Koh and Walter show that the likelihood of
receiving an allocation was negatively related to the degree of underpricing, and that average initial returns fall substantially, from 27% to 1%, when adjusted for rationing. Another paper done by Levis (1990), conducted similar results for U.K. Keloharju (1993) studied on Finland and reached similar evidence. Amihud, Hauser, and Kirsh (2003) find that uninformed investors earned a negative allocation-weighted initial return in Israel in the early 1990s, of –1.2% on average.
The distinction between the informed and uninformed investors groups are generally made due to institutional versus retail investors. There are conflicting results in the literature. Hanley and Wilhelm (1995) show that there is little difference in the size of allocations institutions receive in underpriced and overpriced issues. On the other hand Aggarwal, Prabhala, and Puri (2002), find that institutional investors earn greater returns on their IPO allocations than do retail investors. This may be because they are allocated more stock in those IPOs. By focusing on a segment of the IPO market in which heterogeneity is likely to be low, this prediction can be tested. According to Michaely and Shaw, institutional investors largely avoid IPOs of master limited partnership (MLPs), for a variety of tax reasons. If the informed investors are mainly institutions, and retail investors are mainly uninformed, information heterogeneity among investors in MLPs should be low. Consistent with this prediction, Michaely and Shaw show that average underpricing among 39 MLP IPOs completed between 1984 and 1988 is –0.04%. For comparison, underpricing among non-MLP IPOs over the same time period averaged 8.5%. Though it there are differences among the findings,
The general rule is that underpricing should increase in the ex ante uncertainty about the value of the IPO firm, [Ritter (1984), Beatty and Ritter (1986)]. Most of the empirical studies in IPO underpricing checks the ex ante uncertainty, by company characteristics, offering characteristics, prospectus disclosure, and aftermarket variables. Company characteristics usually include measures of size such as log sales (Ritter (1984)), or the industry the company is from (Benveniste, Ljungqvist, Wilhelm, and Yu (2003)). Gross proceeds are popular offering characteristics for valuation of uncertainty. The number of uses of IPO proceeds as disclosed in the prospectus (Beatty and Ritter (1986)) and the number of risk factors listed in the prospectus (Beatty and Welch (1996)). However, in the absence of rules standardizing what uses and risks must be disclosed, it is unclear whether variation in these measures reflects underlying differences in uncertainty or merely in drafting. A potentially more promising approach might be to identify specific uses or risk factors that, if present, indicate higher uncertainty. Ljungqvist and Wilhelm (2003), for instance, argue that firms intending to use their IPO proceeds mainly to fund “operating expenses” rather than investment or debt repayment are potentially more risky. Finally, aftermarket variables such as trading volume (Miller and Reilly (1987)) or volatility (Ritter (1984, 1987)) rely on information which was not in fact available at the time of the IPO. Indeed, it is even possible that such variables are endogenous to the outcome of the IPO. For instance, heavily underpriced IPOs tend to generate more investor interest and so more after-market trading, with the causation running from underpricing to after-market trading behavior rather than the other way around [Ljungqvist, 2005].
As underpricing represents an involuntary cost to the issuer they would not be willing to make a highly underpriced IPO. As the information asymmetry theory suggest, this may be possible by reducing the information asymmetry between informed and uninformed investors. One possible way to do this is to hire a prestigious underwriter (Booth and Smith (1986), Carter and Manaster (1990), Michaely and Shaw (1994)) or a reputable auditor (Titman and Trueman (1986)). But the empirical evidence on this point is mixed. Early studies, focusing on data from the 1970s and 1980s, have tended to find a negative relation between various measures of underwriter reputation and initial returns. Results are, however, highly sensitive to the period studied. Beatty and Welch (1996), who use data from the early 1990s, show that the sign of the relation has flipped since the 1970s and 1980s, such that more prestigious underwriters are now associated with higher underpricing. Some studies Carter and Manaster (1990) provide a ranking of underwriters. Other studies (Megginson and Weiss, 1991) measure underwriters’ reputation by their market share. This approach attracted more attention and is widely used. Many studies found that the results are not very sensitive to the choice of underwriter reputation measure.
3.1.1.1.2 Information Revelation Theories
Theories of book building stress the important role of investment banks in eliciting information that is valuable in price-setting, and the benefit of giving them discretion over allocation decisions. If some investors are better informed than either the company or other investors as assumed by Rock, eliciting their information before setting the price becomes one of the key tasks for the investment bank taking a company public. The challenge for
the underwriter is to design a mechanism that induces investors to reveal their information truthfully, by making it in their best interest to do so [Ljungqvist, 2005]. Benveniste and Spindt (1989), Benveniste and Wilhelm (1990), and Spatt and Srivastava (1991) show that bookbuilding can, under certain conditions, be such a mechanism. The more aggressive are investors’ bids, the more the offer price is raised.
The price revision over the course of book building and the first-day underpricing return are positively correlated. This is often referred to as the ‘partial adjustment’ phenomenon (Hanley (1993)). Cross-sectionally, the more positive the information (and so the greater the incentive to withhold it), the more money has to be left on the table. If underwriters and institutional investors deal with each other repeatedly in the IPO market, the cost of information acquisition can be reduced [Ljungqvist, 2005].
The Benveniste and Spindt (1989) paradigm has been extended in numerous ways. Benveniste and Wilhelm (1990) investigate its interaction with Rock’s (1986) winner’s curse. If bookbuilding succeeds in extracting the informed investors’ private information, the informational asymmetry among investors will be reduced. and thus the level of underpricing.
Cornelli and Goldreich (2001, 2003) and Jenkinson and Jones (2004) tested the bookbuilding theories of IPO underpricing by using data from two different European investment banks. In the Benveniste-Spindt framework, investors submitting price-limited bids should therefore receive disproportionately larger allocations than investors submitting strike orders, and this allocation bias should become more pronounced, the more aggressive the price limit. The results generally support the Benveniste-Spindt model. Consistent with this conjecture, Cornelli and Goldreich show
that investors submitting price-limited bids receive larger allocations when the book contains fewer limit bids.
Aggarwal, Prabhala, and Puri (2002) analyze a more recent dataset covering 164 IPOs managed by nine different banks in 1997 and 1998. As in Hanley and Wilhelm (1995), institutional investors are allocated the lion’s share of IPO stock and institutional allocations increase in the price revision relative to the filing range. Underpricing, in turn, is larger the more stock institutions were allocated. When comparable firms’ valuations are low, the IPO is likely to generate relatively little ‘surplus’ for the issuer [Ljungqvist, 2005].
3.1.1.1.3 Principal–Agent Models
The first theoretical models linking agency conflicts and IPO underpricing goes back more than 20 years Baron and Holmström (1980) and Baron (1982). Such models focused on the underwriter’s benefit from underpricing and how a bank’s informational advantage over issuing companies might allow the bank to exert sub-optimal effort in marketing and distributing the stock. If effort is not perfectly observable and verifiable, banks find themselves in a moral hazard situation when acting as the issuers’ agents in selling an IPO.
Loughran and Ritter (2003) pointed the potential for agency problems between the investment bank and the issuing firm. They declared that the more uncertain the value of the firm, the greater the asymmetry of information between issuer and underwriter, and thus the more valuable the latter’s services become, resulting in greater underpricing. After the “dot com” bubble many other writers studied agency models of IPO
In principle, issuers can lessen agency conflicts either by monitoring the investment bank’s selling effort and bargain hard over the price, or by using contract design to realign the bank’s incentives by making its compensation an increasing function of the offer price. Ljungqvist and Wilhelm (2003) provide evidence consistent with monitoring and bargaining in the U.S. in the second half of the 1990s. The first-day returns are lower, the greater are the monitoring incentives of the issuing firms’ decision-makers.
Higher equity ownership gives the decision-maker a greater stake in the outcome of the pricing negotiations, while underpricing stock sold for personal account represents a direct wealth transfer from the decision-maker to IPO investors. These results indicate that issuing firms’ contractual choices affect the pricing behavior of their IPO underwriters. Moreover, the empirical results cannot reliably reject the hypothesis that the intensity of incentives is optimal, and so that contracts are efficient. A potentially powerful way to test the agency models is to investigate the underpricing experience of IPOs that have little or no informational asymmetry between issuer and bank [Ljungqvist, 2005].
Some of the early studies Muscarella and Vetsuypens (1989), show that investment banks underwriting their own IPOs suffered as much underpricing as other issuers. However later studies by Ljungqvist and Wilhelm (2003) proved that the greater the investment bank’s equity holding, the lower are first-day underpricing returns.
3.1.1.1.4 Underpricing as a Signal of Firm Quality
These theories emphasis that if companies have better information about the present value or risk of their future cash flows than do investors, underpricing may be used to signal the company’s ‘true’ high value.
Although this brings a cost to the firm in an IPO, this signaling may allow the issuer more successful secondary offerings at a later date. In the words of Ibbotson (1975), who is credited with the original intuition for the IPO signaling literature, issuers underprice in order to ‘leave a good taste in investors’ mouths’ [Ljungqvist, 2005]. Allen and Faulhaber (1989), Grinblatt and Hwang (1989), and Welch (1989) have contributed theories with this feature.
The signaling models state that underpricing is positively related to the probability, size, speed, and announcement effect of subsequent equity sales. As stated in the other asymmetric information theories of underpricing, the signaling models also predict a positive relation between underpricing and the ex-ante uncertainty about firm value.
Michaely and Shaw (1994) estimate a simultaneous system using underwriter reputation to identify the underpricing equation and post-IPO performance to identify the equation modeling the size of the seasoned equity offering. The results do not support the signaling models. They found that underpricing is not significantly related to the reissue decision. Jegadeesh, Weinstein, and Welch (1993) also found similar results. Welch (1996) using the decision how long to wait before returning to the equity market as an endogenous variable concluded that the longer a firm waits, the smaller is the underpricing.
3.1.1.2 Institutional Explanations
3.1.1.2.5 Legal insurance or lawsuit avoidance hypothesis
The first studies of Logue (1973) and Ibbotson (1975), assumes that companies deliberately sell their stock at a discount to reduce the likelihood
performance of their shares. This is called as the legal insurance or lawsuit avoidance hypothesis. The idea is expected as country (US) specific as many other studies have unsupporting findings. Australia (Lee, Taylor, and Walter (1996)), Finland (Keloharju (1993)), Germany (Ljungqvist (1997)), Japan (Beller, Terai, and Levine (1992)), Sweden (Rydqvist (1994)), Switzerland (Kunz and Aggarwal (1994)), or the U.K. (Jenkinson (1990)), all of which experience underpricing.
Lowry and Shu (2002) estimate that nearly 6 percent of companies floated in the U.S. between 1988 and 1995 subsequently were sued for violations relating to the IPO, with damages awarded to plaintiffs averaging 13.3% of IPO proceeds. Tinic (1988), Hughes and Thakor (1992), and Hensler (1995) argue that intentional underpricing may act like insurance against such securities litigation. Tınıç (1988) proposes that the enactment of the 1933 Securities Act represents a regime shift that potentially allows us to test the legal liability hypothesis. Prior to the 1933 Act, the principle of
caveat emptor largely protected issuers and investment banks against
litigation risk, and so underpricing should have been low. After 1933, litigation risk should have featured more prominently when investment banks priced deals, and so underpricing should have increased.
Hughes and Thakor propose a trade-off between on the one hand minimizing the probability of litigation, and on the other maximizing the gross proceeds from the IPO.
However Drake and Vetsuypens (1993) study a sample of 93 IPO firms that were sued and compare them to a sample of 93 IPOs that were not sued, matched on IPO year, offer size, and underwriter prestige. Conflicting with some other studies, they found that sued firms are just as underpriced as
the control sample, and underpriced firms are sued more often than overpriced firms. Drake and Vetsuypens interpret these findings as inconsistent with the legal insurance hypothesis. Lowry and Shu (2002) argue that such an ex post comparison misses the point because it does not truly consider the probability of being sued. Empirical analysis of the link between underpricing and the probability of litigation needs to be careful about the following simultaneity problem: firms choose a certain level of underpricing to reduce the probability of litigation, but the level of underpricing they choose depends on the probability of being sued [Ljungqvist, 2005].
Asquith, Jones, and Kieschnick (1998) investigate whether observed underpricing is the by product of price support, as Ruud proposes, or whether it may have independent causes. Using the aforementioned mixture-of distributions approach, they estimate the average underpricing returns for the two hypothesized distributions of supported and unsupported IPOs. If Ruud is correct in saying that there is no deliberate underpricing, then the initial return distribution of unsupported offerings should have a mean of zero. This, however, is not what Asquith, Jones, and Kieschnick find.
3.1.1.2.6 Tax Arguments
This hypothesis can cover only one side of underpricing of IPOs and could be very country specific, as tax regulations differ among countries. Rydqvist (1997), in his study on Swedish IPOs found supporting results. As the regulations in Sweden taxed employment income much more heavily than capital gains, there was an incentive. When the Swedish tax authorities made underpricing-related gains subject to income tax, removing the
incentive to allocate underpriced stock to employees in 1990, underpricing fell from an average of 41% in 1980-1989 to 8% in 1990-1994.
3.1.1.3 Ownership and Control
This theory assumes that going public is, actually a step towards the separation of ownership and control. If the separation of ownership and control is incomplete, an agency problem between non-managing and managing shareholders can arise (Jensen and Meckling (1976)). Emprical tests give conflicting results. Brennan and Franks (1997) view underpricing as a means to entrench managerial control and the attendant agency costs by avoiding monitoring by a large outside shareholder, Stoughton and Zechner’s (1998) analysis instead suggests that underpricing may be used to minimize agency costs by encouraging monitoring.
3.1.1.3.7 Underpricing as a Means to Retain Control
In the Brennan and Franks (1997) model, underpricing gives managers the opportunity to protect their private benefits by allocating shares strategically when taking their company public. The role of underpricing in this view is to generate excess demand. Excess demand enables managers to ration investors so that they end up holding smaller stakes in the business. There are also supporting and unsupporting emprical tests of this idea. Booth and Chua (1996) argue that if there is a more dispersed ownership structure, as the investors think that there will be a more liquid secondary market for their shares, the owners will value more. Zingales stated that the link between underpricing and ownership dispersion is not sufficient evidence in favor of Brennan and Franks’ model. Zingales (1995) assumes that an IPO is frequently only the first stage in a multi-period sell-out strategy which will culminate in the complete transfer of ownership and control from the
original founders to new owners. Brennan and Franks, on the other hand, assume that the IPO is designed to prevent a transfer of control in spite of the partial transfer of ownership [Ljungqvist, 2005].
Some other studies focused on the issuing of non-voting shares as a guarantee for the managers not to loose the control of the company. Smart and Zutter (2003) find that U.S.companies that issue non-voting stocks in their IPOs are less underpriced and have higher institutional ownership after the IPO. This is consistent with the notion that non-voting stock can substitute for the Brennan-Franks mechanism. Arugaslan, Cook, and Kieschnick (2003) found the size as an important determinant of institutional investors’ stock selection.
3.1.1.3.8 Underpricing as a Means to Reduce Agency Costs
Brennan and Franks (1997) implicitly assume that, in the wake of the separation of ownership and control, managers try to maximize their expected private utility by entrenching their control benefits. However, it could be argued that managers should actually seek to minimize, rather than maximize, their scope for extracting private benefits of control [Ljungqvist, 2005]. Stoughton and Zechner (1998) observe that, in contrast to Brennan and Franks, it may be value-enhancing to allocate shares to a large outside investor who is able to monitor managerial actions.
3.1.1.4 Behavioral Explanations
Considering that the IPO firms by definition have no prior share price history and tend to be young, immature, and relatively informationally opaque it is hard to value, them. As researchers are suspicious about the sufficiency of informational models, the risk of lawsuits, or control
underpricing. Behavioral theories assume either the presence of ‘irrational’ investors who bid up the price of IPO shares beyond true value, or that issuers are subject to behavioral biases and therefore fail to put pressure on the underwriting banks to have underpricing reduced. These explanations are immature compared to the informational models. The explanations that can be put in this category are grouped as ‘informational cascades’, investor sentiment, prospect theory and mental accounting,
3.1.1.4.1 Cascades
The starting point of informational cascades is that later investors can state their bids on the bids of earlier investors, rationally disregarding their own information. Welch (1992) shows that ‘informational cascades’ can develop in some forms of IPOs if investors make their investment decisions sequentially: If the initial sales are successful it will be a signal for subsequent investors that earlier investors held favorable. On the contrary, if the initial sales are disappointing, it can discourage later investors from investing irrespective of their private signals. As a consequence, demand either snowballs or remains low over time. In this sense cascades may play a role in explaining IPO underpricing. However we should keep in mind that in book building cascades do not occur. Therefore less underpricing is required. In addition if it is assumed that investors can communicate freely, cascades also do not form. However Welch (1992) proves that issuers are better off with cascades than with free communication. He also adds that IPOs managed by national underwriters are predicted to be less underpriced. He also points to the factors that the issuers pay attention when deciding which type of underwriter to choose. In other words he mentions that the choice of underwriter is not random. In conclusion,
Welch’s cascades model remains one of the least explored explanations of IPO underpricing.
3.1.1.4.2 Investor Sentiment
One of the popular subjects of the behavioral finance is the effect of ‘irrational’ or ‘sentiment’ investors’ behaviors on stock prices. The model predicts that companies going public in a hot market subsequently underperform, both relative to the first-day price and to the offer price. Underperformance relative to the first-day price is not surprising; it follows from the two assumptions of sentiment investors and short-sale constraints (Miller (1977)). One extension of the model is the negative correlation between underpricing and long run performance as documented by Ritter (1991). However Krigman, Shaw, and 62 Womack (1999) find a positive relation. In the Ljungqvist, Nanda, and Singh (2004) model, the relation is not necessarily monotonic. In particular, the relation is negative only if the probability of the hot market ending is small.
If the hot market is highly likely to end, the issuer optimally reduces the offer size, implying regular investors hold smaller inventories and so require less underpricing to break even. At the same time, the reduction in offer size aggravates long-run underperformance, given the negative slope of the sentiment demand curve. Consistent with evidence from the 1990s (Beatty and Welch (1996)), Ljungqvist, Nanda, and Singh (2004) predict that underpricing increases in underwriter reputation. Underwriters enjoying a large IPO deal flow can more easily punish regular investors who attempt to free-ride on the inventory-holding strategy by dumping their shares prematurely, before the price falls. This in turn implies that the more active banks can underwrite larger IPOs, as more inventory can be held over time.
Since underpricing is compensation for the expected inventory losses in the face of a non-zero probability that the hot market will end before all inventory has been unloaded, the more active underwriters will be associated with greater underpricing [Ljungqvist, 2005].
3.1.1.4.3 Prospect Theory and Mental Accounting
Loughran and Ritter (2002) focused on behavioral biases among the decision-makers of the IPO firm, rather than among investors. They assume that the decision-maker’s initial valuation beliefs are reflected in the mean of the indicative price range reported in the issuing firm’s IPO registration statement.
As argued earlier, offer prices appear only to ‘partially adjust’ (Hanley (1993)) in the sense that large positive revisions from the reference point are associated with large initial price increases from the offer price during the first day of trading. Such partial adjustment is consistent with both the Benveniste and Spindt (1989) information-acquisition model of IPO underpricing and Loughran and Ritter’s argument. If the shares could have been sold at the higher first-day trading price then there would be a positive gain as wealth.
Ljungqvist and Wilhelm (2004) investigate whether CEOs deemed ‘satisfied’ with the underwriter’s performance according to Loughran and Ritter’s story are more likely to hire their IPO underwriters to lead-manage later seasoned equity offerings. Controlling for other known factors, IPO firms are less likely to switch underwriters for their SEO when they were deemed ‘satisfied’ with the IPO underwriter’s performance. Underwriters also appear to benefit from behavioral biases in the sense that they extract higher fees for subsequent transactions involving ‘satisfied’
decision-makers. While these tests suggest there is explanatory power in the behavioral model, they do not speak directly to whether deviations from expected utility maximization determine patterns in IPO initial returns [Ljungqvist, 2005].
3.2 Hot Issue Markets
The second anomaly is that cycles exist in both in the volume and the average initial returns of IPOs. Graph 1 shows that high initial returns tend to be followed by rising IPO volume. The periods of high average initial returns and rising volume are known as "hot issue" markets. The volume of IPOs, both in the U.S. and other countries, shows a strong tendency to be high following periods of high stock market returns, when stocks are selling at a premium to book value. Rational explanations for the existence of hot issue markets are difficult to come by.
Hot issue markets exist in other countries as well as the U.S. For example, there was a hot issue market in the United Kingdom between the "Big Bang" (the end of fixed commission rates) in October 1986 and the crash a year later. In South Korea, there was a hot issue market in 1988 that coincided with a major bull market Ritter (1998).
Graph 1. Average initial returns by month for S.E.C.-registered IPOs in the U.S. during 1977-96
Graph 2. The number of IPOs by month in the U.S. during 1977-96, excluding closed-end fund
Source: Ritter (1998), Initial Public Offerings.
Graph 3. Number of IPOs per Month in the ISE
0 1 2 3 4 5 6 7 Ja n-90 Ja n-91 Ja n-92 Ja n-93 Ja n-94 Ja n-95 Ja n-96 Ja n-97 Ja n-98 Ja n-99 Ja n-00 Ja n-01 Ja n-02 Ja n-03 Ja n-04 Ja n-05
Graph 4. IPOs by month in ISE 0 5 10 15 20 25 30 35 Janua ry F ebr ua ry Ma rc h Ap ril Ma y June Ju ly A ugu st S eptemb er Oct ob er No ve m be r De ce m be r
3.3 Long Term Underperformance of IPOs
The secondary market performance of IPOs is generally defined as the long term performance on a three year basis. Long term underperformance of IPOs is the third anomaly. Most of the studies on the third anomaly of the IPOs provide evidence for the long term underperformance. Ritter (1991), in his study for the 1975-84 period consisting 1526 IPOs find that after the 36 months the adjusted return is -15%. He also found that underperformance is much more for the higher the offering amounts and young firms. Loughran (1993) investigated 3656 IPOs in NASDAQ for the 1967-1987 period and stated that the underperformance is also valid even in the sixth year after IPO. Loughran & Ritter (1995), worked on 4.753 IPOs at NASDAQ and New York Stock Exchange for 1970-1990. Accepting the first day price as buy price and making a control group with similar market capitalization they find that IPOs provided 5% return where the control
group provided 12%. Wang, Chan& Gau (1992), find that the long run performance in the first nine months is -8.9 for the investment companies that had 2.8% underpricing for the first day.
Long run underperformance is a less studied field in literature than the underpricing anomaly. The theories or hypothesis trying to explain this anomaly are as follows.
3.3.1 The divergence of opinion hypothesis
One argument is that investors who are most optimistic about an IPO will be the buyers. If there is a great deal of uncertainty about the value of an IPO the valuations of optimistic investors will be much higher than those of pessimistic investors. As time goes on and more information becomes available, the divergence of opinion between optimistic and pessimistic investors will narrow, and consequently, the market price will drop.
3.3.2 The impresario hypothesis
The "impresario" hypothesis argues that the market for IPOs is subject to fads and that IPOs are underpriced by investment bankers (the impresarios) to create the appearance of excess demand, just as the promoter of a rock concert attempts to make it an "event." This hypothesis predicts that companies with the highest initial returns should have the lowest subsequent returns. There is some evidence of this in the long run, but in the first six months, momentum effects seem to dominate. One survey of individual investors in IPOs found that only 26 percent of the respondents did any fundamental analysis of the relation between the offer price and the firm's underlying value.
3.3.3 The windows of opportunity hypothesis
If there are periods when investors are especially optimistic about the growth potential of companies going public, the large cycles in volume may represent a response by firms attempting to "time" their IPOs to take advantage of these swings in investor sentiment. Of course, due to normal business cycle activity, one would expect to see some variation through time in the volume of IPOs. The large swings in volume displayed in Graph 5, however, seems difficult to explain as merely normal business cycle activity.
The windows of opportunity hypothesis predicts that firms going public in high volume periods are more likely to be overvalued than other IPOs. This has the testable implication that the high-volume periods should be associated with the lowest long-run returns. This pattern indeed exists.
CHAPTER III
4 EMPRICAL ANALYSIS
4.1 IPO Underpricing, Evidence from International Studies
Graph 5. IPO Returns in the United States: 1960-2003
Source: Ljungqvist, 2005
The figure reports quarterly equal-weighted average initial IPO returns in % for 14,906 IPOs completed in the United States between 1960 and 2003, calculated as the first-day closing price over the IPO offer price less one.
Graph 6. IPO Returns in Europe: 1990-2003
Source: Ljungqvist, 2005
The figure reports equal-weighted average initial IPO returns in % for 19 European countries, calculated as the aftermarket trading price over the IPO offer price less one. Aftermarket trading prices are measured on the first day of trading in all countries except France and Greece, where they are measured on the fifth day of trading due to daily volatility limits. IPOs are identified by the author using a range of sources including national stock exchanges, Thomson Financial’s SDC global new issue database, Dealogic’s Equityware, and news searches. Due to crosslistings, some companies go public outside their home country. The figure shows initial IPO returns by country of listing. Aftermarket trading prices are mostly from Datastream, with missing data hand filled from news searches. Between 1990 and 2003, 4,079 IPOs were completed in the 19 countries shown in the figure. This breaks down as follows: Austria (83), Belgium (102), Denmark (69), Finland (70), France (679), Germany (583), Greece (301),
Hungary (54), Ireland (22), Italy (158), Luxembourg (5), Netherlands (77), Norway (167), Poland (214), Portugal (33), Spain (47), Sweden (180), Switzerland (68), and the United Kingdom (1,167).
Graph 7. IPO Returns in Asia-Pacific and Latin America: 1990-2001
Source: Ljungqvist, 2005
The figure reports equal-weighted average initial IPO returns in % for eight Asian-Pacific and eight countries, calculated as the aftermarket trading price over the IPO offer price less one. Aftermarket trading prices are measured on the first day of trading. IPOs are identified by the author using a range of sources including national stock exchanges, Thomson Financial’s SDC global new issue database, Dealogic’s Equityware, and news searches. Due to cross-listings, some companies go public outside their home country. The figure shows initial IPO returns by country of listing. Aftermarket trading prices are mostly from Datastream, with missing data hand filled from news searches. Between 1990 and 2001, 2,716 IPOs
as follows: Australia (633), Hong Kong (523), Indonesia (213), Malaysia (506), New Zealand (51), Philippines (91), Singapore (313), Thailand (251), Argentina (25), Barbados (1), Brazil (13), Chile (7), Colombia (3), Mexico (79), Uruguay (1), and Venezuela (6).
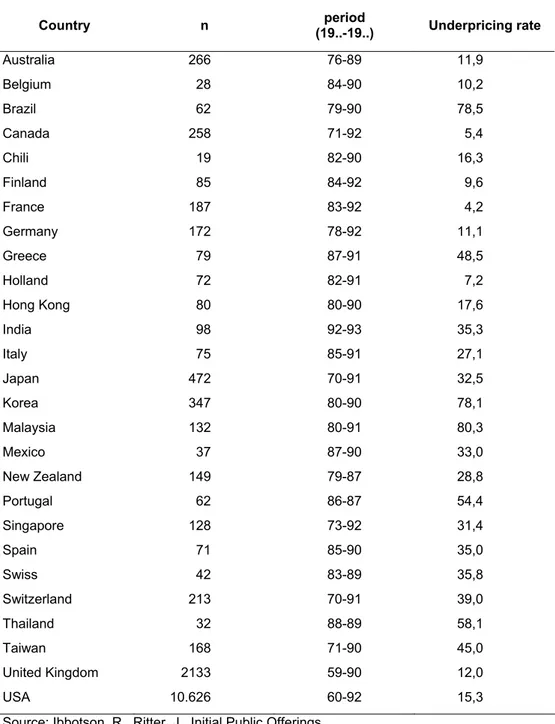
Table 3. IPO Underpricing Country Studies
Country n (19..-19..) period Underpricing rate
Australia 266 76-89 11,9 Belgium 28 84-90 10,2 Brazil 62 79-90 78,5 Canada 258 71-92 5,4 Chili 19 82-90 16,3 Finland 85 84-92 9,6 France 187 83-92 4,2 Germany 172 78-92 11,1 Greece 79 87-91 48,5 Holland 72 82-91 7,2 Hong Kong 80 80-90 17,6 India 98 92-93 35,3 Italy 75 85-91 27,1 Japan 472 70-91 32,5 Korea 347 80-90 78,1 Malaysia 132 80-91 80,3 Mexico 37 87-90 33,0 New Zealand 149 79-87 28,8 Portugal 62 86-87 54,4 Singapore 128 73-92 31,4 Spain 71 85-90 35,0 Swiss 42 83-89 35,8 Switzerland 213 70-91 39,0 Thailand 32 88-89 58,1 Taiwan 168 71-90 45,0 United Kingdom 2133 59-90 12,0 USA 10.626 60-92 15,3
There are 16093 IPOs in table related to 27 different markets. In most of the studies the underpricing is calculated as the return on first day closing price with respect to IPO price. However some of them use the first week closing price. Besides some studies uses the market adjusted returns and some uses the raw returns. But the important thing is that no matter the calculation is there exits underpricing phenomenon in both the developed and the developing countries. The underpricing changes between 80.3 and 4.2%. There are many more studies investigating the underpricing which are not listed on this table.