Purpose: Many studies have confirmed the significance of tibial tuberosity‑trochlear groove (TTTG) distance measurement for the preoperative assessment of tibial tubercle osteotomy and refixation of the patients that need surgery. TTTG distance is being used as threshold value for surgery decision. The purpose is to determine the TTTG values for the adult Turkish population and compare this with the values of other studies and establish a possible index. Materials and Methods: This study was conducted on 200 patients (97 female, 103 male) aged between 18 and 65 years, retrospectively, who had magnetic resonance imaging at Istanbul Medipol Mega University Hospital Radiology Department. Individuals with no knee surgical history and deformation included to research group, any deformities related with knee were excluded. The scans were analyzed in Picture Archiving Communication System program and compared with other populations. Significance was evaluated with independent Student’s
t‑test. Results: The mean TTTG distance was found 10.07 ± 1.60 mm in males, 9.96 ± 1.41 mm in females, and 10.02 ± 1.51 mm for total cases. There was no statistically significant difference between sex (P > 0.05). However, overall TTTG distance of right and left knees found significantly different (P < 0.05). Conclusion: Obtained results are similar with the results of Caucasian population but different than Asian. It is believed that these results will be significant in evaluation of patellofemoral disorders and helpful in treatment.
Keywords: Knee joint, magnetic resonance imaging, patellar dislocation, sexual dimorphism, tibial tuberosity‑trochlear groove, Turkish population
Evaluation of Normal Tibial Tubercle to Trochlear Groove Distance in
Adult Turkish Population
A Ortug, T Ormeci1, N Yuzbasioglu, S Albay2, M Seker3
Address for correspondence: Dr. A Ortug, Department of Anatomy, School of Medicine, Istanbul Medipol University, Istanbul, Turkey. E‑mail: [email protected]
instance, Schoettle et al.[6] reported high correlation between CT and MRI studies.[8] For this reason, MRI measurements are preferred for examination of knee joint pathology without radiation exposure.[9] It is also stated in the literature that it is not possible to measure TTTG distance clinically.[10]
The bone structure of the knee joint is anatomically formed by femur, tibia, and patella. The fibula also
Introduction
T
ibial tuberosity‑trochlear groove (TTTG) distance was first described by Goutallier and Bernageau on axial radiography with 30° knee flexed.[1,2] Later, Dejour et al. used superimposing computed tomography (CT) images with fully extended knee as a method and reported improved accuracy and reliability.[1,3,4] So that, historically, fully extended knee on CT used as golden method for TTTG measurement.[5,6] However, recently, MR imaging also considered as an equivalent method.[7] Many studies conducted to show magnetic resonance imaging (MRI) can substitute CT method; forDepartments of Anatomy and 1Radiology, School
of Medicine, Istanbul Medipol University, Istanbul, 2Department
of Anatomy, School of Medicine, Suleyman Demirel University, Isparta,
3Department of Anatomy,
School of Medicine, Necmettin Erbakan University Meram, Konya, Turkey
Abstract
This is an open access journal, and articles are distributed under the terms of the Creative Commons Attribution‑NonCommercial‑ShareAlike 4.0 License, which allows others to remix, tweak, and build upon the work non‑commercially, as long as appropriate credit is given and the new creations are licensed under the identical terms.
For reprints contact: [email protected]
How to cite this article: Ortug A, Ormeci T, Yuzbasioglu N, Albay S, Seker M. Evaluation of normal tibial tubercle to trochlear groove distance in adult Turkish population. Niger J Clin Pract 2018;21:1403-7.
Date of Acceptance: 23-Jul-2018
Access this article online
Quick Response Code:
Website: www.njcponline.com
DOI: 10.4103/njcp.njcp_11_18
participates in the clinical evaluation. Two joints, tibiofemoral and patellofemoral, are involved in the active movements of the knee. Knee is stabilized by bone and connective tissue stabilizers. It is stated that an important part of knee pain encountered in clinic is related to the patellofemoral joint.[11] It is important to know the biomechanics of the patellofemoral joint during treatment planning. Increased patellofemoral joint reaction force causes excessive stress on articular cartilage. This can cause additional problems, such as stress, chondromalacia, and osteoarthritis. The morphological abnormalities of the dorsal joint surface of the trochlear formation or patellar and the magnitude of the forces acting laterally may cause lateral subluxation or dislocation of the patella. Static stabilizers forming the patellofemoral joint are medial patellofemoral ligament, patellar tendon, retinaculum, joint capsule, and trochlear groove. Trochlear groove is the primary bone stabilizer with its depth and width. Patellofemoral instabilities may result in various predisposing factors, such as excessive femoral anteversion, patellar dysplasia, genu valgum, trochlear dysplasia, and joint hyperlaxity.[11] The TTTG distance is one of the most important parameters for determining the degree of external torsion and the lateralization of tibial tuberosity. The obtained measurement is important in assessing patellar instability.[2] It is also stated in the literature that it is not possible to measure TTTG distance clinically.[6]
It is indicated that 15 mm or higher deviation of TT shows lateralization/transposition.[12] Lateralization of the patellar tendon/TT is also at the origin of the quadriceps femoris muscle, which increases the tendency of the tendon on the patella and predisposes to patellofemoral diseases.[13]
It has been suggested in previous studies that the normal values of the population are important as well as the values of the patient groups because of the variability of the data present in the sources.[8,14,15]
Orthopedic surgeons explain that TTTG measurement is especially important for the patients who are planned to undergo tibial tuberosity osteotomy and refixation. For this reason, we believe that the index study will be useful for informing surgeons.
Materials and Methods
Study groupThe ethical approval of this study was obtained prior to the commencement of work from the Medipol University Clinical Ethics Committee (decision 368, dated 21/07/2016). Two hundred Turkish patients were
included to study from 2016 through 2017 (103 males, 97 females; mean age 35.37 ± 9.82) at Istanbul Medipol Mega University Hospital Radiology Department. Because of the studies indicating that MR imaging can be used with accurate results and less radiation exposure, we preferred using MR imaging. MR images registered in Picture Archiving Communication Systems (PACS) used for measurement. Patients with no patellofemoral instability, degenerative changes in bone structure, ligamentous laxity, congenital malformations, and knee surgery were included in the study group. Those with ligament damage were excluded.
Imaging
MRI was performed with the patient in supine and has the knee 5° of external rotation with relaxed position on a 3‑T unit with following parameters TR 3029, TE 30, and slice thickness 4 mm. In order to analyze scan images, PACS were used.
Measurement
The technique defined by Schoettle et al. used for measurement.[6] Although the patient in supine position with fully extended knee, two sections from the proximal of trochlea and tibial tubercle are sufficient for the measurement. After superimposing those two sections, a perpendicular line through the deepest point of trochlea should be drawn to the transverse line passing from the posterior end of femur condyles. Then, a parallel line should be drawn to trochlea line starting from the tibial tubercle where patellar tendon attaches [Figure 1]. TTTG measurement is defined by distance between those two parallel lines.[16] Each MRI was measured in a double blinded, randomized manner.
Statistics
Independent Student’s t‑test was used for the comparison of TTTG distance value with gender and side of the knee. Mean values of TTTG for all samples were calculated with 95% confidence intervals and P ‑ values < 0.05 were regarded as statistically significant. Statistical analyses were performed using SPSS (Version 17.0 for Windows; SPSS Inc, Chicago, Illinois, USA).
Results
Total mean TTTG was 10.02 ± 1.51 mm (min. 7.00 mm Table 1: Mean values for female and male subjects for
right, left, and all measurements Gender
Mean
Male Female
Right Left All Right Left All
Table 2: Chart of tibial tuberosity-trochlear groove measurement distribution according to gender
TTTG=Tibial tuberosity‑trochlear groove
Table 3: Chart of tibial tuberosity-trochlear groove measurement distribution according to right and left knee
TTTG=Tibial tuberosity‑trochlear groove
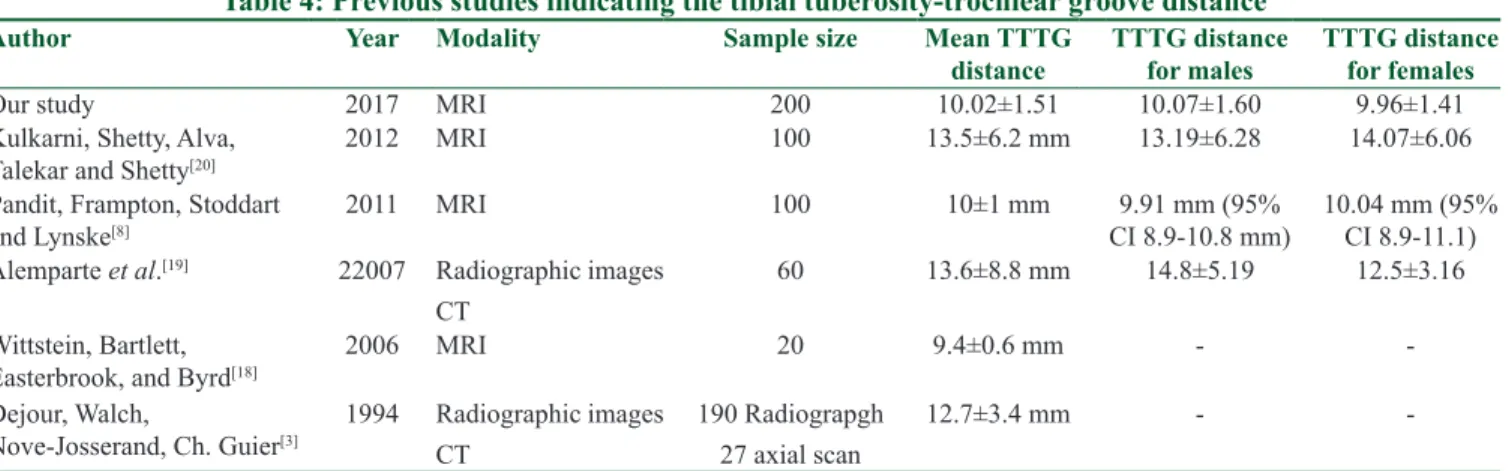
Table 4: Previous studies indicating the tibial tuberosity-trochlear groove distance
Author Year Modality Sample size Mean TTTG
distance TTTG distance for males TTTG distance for females
Our study 2017 MRI 200 10.02±1.51 10.07±1.60 9.96±1.41
Kulkarni, Shetty, Alva,
Talekar and Shetty[20] 2012 MRI 100 13.5±6.2 mm 13.19±6.28 14.07±6.06
Pandit, Frampton, Stoddart
and Lynske[8] 2011 MRI 100 10±1 mm CI 8.9‑10.8 mm)9.91 mm (95% 10.04 mm (95% CI 8.9‑11.1)
Alemparte et al.[19] 22007 Radiographic images
CT
60 13.6±8.8 mm 14.8±5.19 12.5±3.16
Wittstein, Bartlett,
Easterbrook, and Byrd[18] 2006 MRI 20 9.4±0.6 mm ‑ ‑
Dejour, Walch,
Nove‑Josserand, Ch. Guier[3] 1994 Radiographic imagesCT 190 Radiograpgh27 axial scan 12.7±3.4 mm ‑ ‑
TTTG=tibial tuberosity‑trochlear groove, MRI=magnetic resonance imaging, CT=computed tomography, CI=confidence interval
and max. 14.90 mm). There was no statistically significant difference between males and females. The mean TTTG for males was 10.07 ± 1.60 mm and 9.96 ± 1.41 mm for females (P > 0.05) [Tables 1 and 2].
However, when TTTG compared with left and right knee, mean TTTG for right was 9,81 ± 1,49 mm (n = 105) and 10.24 ± 1.50 mm for left knee. The difference was found statistically significant (P < 0.05) [Table 3].
Figure 1: (a) The yellow line below indicates the attachment of patellar tendon. Upper red line shows mid‑point of insertion. (b) Trochlear groove was identified. A perpendicular line from the trochlear groove to axis of posterior condyles was drawn (trochlear line). (c) Section images at the level of a and b superimposed. Distance between two parallel lines as red showing tibial tuberosity‑trochlear groove distance. TGL = trochlear groove line, PCL = posterior condylar line, and TL: tibial linea
c
b a
Discussion
TTTG distance is normal, <15 mm, border between 15 and 20 mm, >20 mm is considered pathological. Measurements made with MRI have been shown to be slightly less than those performed with CT.[17]
The normal values of the TTTG range made in different study groups were widely variable in many studies. Table 4 contains data on normal values in the literature. Chronologically, in 1994, 190 radiographic and 27 axial images were used to compare symptomatic and asymptomatic samples. The mean value was found 12.7 ± 3.4 mm without discrimination between males and females.[3] In another study, the average value over 20 MRI images was calculated as 19.6 mm in 2006.[18]
Another study on 60 healthy subjects aimed to compare the statistical reliability of radiographic and CT imaging methods. Total mean value was reported as 13.6 ± 8.8 mm, 14.8 ± 5.19 in males and 12.5 ± 3.16 in females.[19]
Pandit et al. aimed to measure the normal values of the TTTG range over MRI images. The results were 10 ± 1 mm in total in 100 subjects, 9.91 mm in males and 10.04 mm in females.[8]
Finally, in 2012, Kulkarni et al. performed a similar study on 100 subjects with MRI images.[20] They reported 13.5 ± 6.2 mm for overall mean values; 13.19 ± 6.28 mm in males and 13.07 ± 6.06 mm in females.
These studies have provided an evaluation without considering the origins of the sample groups. It is obvious that the results are very different from each other as they are within themselves in terms of female, male, and total values. We think that this difference is likely to result from the origin characteristics of the sample groups. Also, a previous study indicates that TTTG distance may differ with age and height.[15] So that anthropological differences of the bone structures may result with different values.
In our study, we evaluated cases reported to have clinically normal patellofemoral joint structure. Our results show that there is no statistical difference between males and females. The obtained data were found to be different from Asian,[15] giving results consistent with TTTG distance results obtained from Caucasian individuals in the literature. We believe that these results will help diagnosis and treatment in the relevant population.
Conclusion
Clinically, TTTG value more than 20 mm considered as pathological and suitable for surgical operation. Our standard normal results for this value regardless of the gender and side of the knee was found 10.07 ± 1.60 mm for male and 9.96 ± 1.41 for female.
Financial support and sponsorship Nil.
Conflicts of interest
There are no conflicts of interest.
References
1. Wagenaar FC, Koëter S, Anderson PG, Wymenga AB. Conventional radiography cannot replace CT scanning in detecting tibial tubercle lateralisation. Knee 2007;14:51‑4. 2. Goutallier D, Bernageau J, Lecudonnec B. The measurement
of the tibial tuberosity. Patella groove distanced technique and results (author’s transl). Rev Chir Orthop Reparatrice Appar Mot 1978;64:423‑8.
3. Dejour H, Walch G, Nove‑Josserand L, Guier C. Factors of patellar instability: An anatomic radiographic study. Knee Surg Sports Traumatol Arthrosc 1994;2:19‑26.
4. Anley CM, Morris GV, Saithna A, James SL, Snow M. Defining the role of the tibial tubercle‑trochlear groove and tibial tubercle‑posterior cruciate ligament distances in the work‑up of patients with patellofemoral disorders. Am J Sports Med 2015;43:1348‑53.
5. Meininger AK. Understanding the patellofemoral joint: From instability to arthroplasty. Clin Sports Med 2014;33:xiii‑xiv. 6. Schoettle PB, Zanetti M, Seifert B, Pfirrmann CW, Fucentese SF,
Romero J, et al. The tibial tuberosity‑trochlear groove distance; a comparative study between CT and MRI scanning. Knee 2006;13:26‑31.
7. Dornacher D, Reichel H, Lippacher S. Measurement of tibial tuberosity‑trochlear groove distance: Evaluation of inter‑ and intraobserver correlation dependent on the severity of trochlear dysplasia. Knee Surg Sports Traumatol Arthrosc 2014;22:2382‑7. 8. Pandit S, Frampton C, Stoddart J, Lynskey T. Magnetic
resonance imaging assessment of tibial tuberosity‑trochlear groove distance: Normal values for males and females. Int Orthop 2011;35:1799‑803.
9. Yeoh CS, Lam KY. Tibial tubercle to trochlear groove distance and index in children with one‑time versus recurrent patellar dislocation: A magnetic resonance imaging study. J Orthop Surg (Hong Kong) 2016;24:253‑7.
10. Shakespeare D, Fick D. Patellar instability – Can the TT–TG distance be measured clinically? Knee 2005;12:201‑4.
11. Burc H, Basal O. Spor Yaralanmaları/Diz Yaralanmaları (Sports Injuries/Knee Injuries). In: Atay T, editor. Ortopedi ve Spor Yaralanmaları Asistan Kitabı (Orthopaedics and Sports Medicine Guide for Researchers. 1st ed. 1. Baskı. Ankara Derman Tıbbi
Yayıncılık; 2015. p. 705‑25.
12. Mete, BD, Gursoy M, and Kocyigit H. Magnetic resonance imaging of the patellofemoral joint/Patellofemoral eklemin manyetik rezonans goruntulemesi. Turkish Journal of Physical Medicine and Rehabilitation 2015;61:261‑72.
13. Çoban, G, Tarhan NC. Patellofemoral eklem patolojilerinin değerlendirilmesinde manyetik rezonans görüntülemenin rolü (The role of magnetic resonance imaging in the evaluation of
patellofemoral joint diseases). TOTBİD Dergisi 2012;11:302‑13. 14. Dickens AJ, Morrell NT, Doering A, Tandberg D, Treme G.
Tibial tubercle‑trochlear groove distance: Defining normal in a pediatric population. J Bone Joint Surg Am 2014;96:318‑24. 15. Tse MS, Lie CW, Pan NY, Chan CH, Chow HL, Chan WL,
et al. Tibial tuberosity‑trochlear groove distance in Chinese patients with or without recurrent patellar dislocation. J Orthop Surg (Hong Kong) 2015;23:180‑1.
16. Camp CL, Stuart MJ, Krych AJ, Levy BA, Bond JR, Collins MS, et al. CT and MRI measurements of tibial tubercle‑trochlear groove distances are not equivalent in patients with patellar instability. Am J Sports Med 2013;41:1835‑40.
17. Hinckel BB, Gobbi RG, Filho EN, Pécora JR, Camanho GL,
Rodrigues MB, et al. Are the osseous and tendinous‑cartilaginous tibial tuberosity‑trochlear groove distances the same on CT and MRI? Skeletal Radiol 2015;44:1085‑93.
18. Wittstein JR, Bartlett EC, Easterbrook J, Byrd JC. Magnetic resonance imaging evaluation of patellofemoral malalignment. Arthroscopy 2006;22:643‑9.
19. Alemparte J, Ekdahl M, Burnier L, Hernández R, Cardemil A, Cielo R, et al. Patellofemoral evaluation with radiographs and computed tomography scans in 60 knees of asymptomatic subjects. Arthroscopy 2007;23:170‑7.
20. Kulkarni S, Shetty AP, Alva KK, Talekar S, Shetty VD. Patellar instability in Indian population: Relevance of tibial tuberosity and trochlear groove distance. SICOT J 2016;2:14.