THE EFFECTS OF PERSONAL TRAITS AND COMPLEXITY ON
AESTHETIC PREFERENCES
A Master’s Thesis by NAZ BİLGİÇ Department ofInterior Architecture and Environmental Design İhsan Doğramacı Bilkent University
Ankara June 2017
To my wonderful family; Arif Bilgiç, Aslıhan Bilgiç, Burcu Bilgiç,
Meloş Bilgiç
THE EFFECTS OF PERSONAL TRAITS AND COMPLEXITY ON
AESTHETIC PREFERENCES
The Graduate School of Economics and Social Sciences of
İhsan Doğramacı Bilkent University by
NAZ BİLGİÇ
In Partial Fulfillment of the Requirements for the Degree of MASTER OF FINE ARTS
THE DEPARTMENT OF
INTERIOR ARCHITECTURE AND ENVIRONMENTAL DESIGN İHSAN DOĞRAMACI BİLKENT UNIVERSITY
ANKARA June 2017
ABSTRACT
THE EFFECTS OF PERSONAL TRAITS AND COMPLEXITY ON
AESTHETIC PREFERENCES
Bilgiç, Naz
MFA, Department of Interior Architecture and Environmental Design Supervisor: Assist. Prof. Dr. Çağrı İMAMOĞLU
June, 2017
This study explores the relationship between aesthetic preferences related to visual complexity and personal traits. For this purpose, we used nine images with geometric shapes and nine photographs of building façades, each of which was manipulated to represent three complexity levels. According to “The Big-Five Model”, Extraversion, Agreeableness, Conscientiousness, Emotional Stability (Neuroticism), and Intellect are the five main personal traits. Effect of these personal traits on aesthetic
preferences about visual complexity was examined by conducting an online research with 207 respondents (144 women and 63 men). Results show that the relationship between aesthetic preference for complexity on geometric shapes and age is positive which means older respondents prefer more complex stimuli than younger ones.
Results also revealed that interrelationship between rated complexity of geometric shapes and agreeableness is positive which means when a person has the higher score in agreeableness he/she also rates geometric shapes as more complex. The interrelationship of rated complexity of geometric shapes and conscientiousness also is positive. A similar tendency exists on the complexity ratings of building façades for the respondents who have higher scores of extraversion. People who have higher scores on extraversion rated building façades as more complex. As a result of this study conducted with geometric shapes and building façades, personal traits, complexity and familiarity are affected the aesthetic preference of respondents.
Keywords: Aesthetic preferences, Building Façades, Geometric Shapes, The Big-Five Model, Visual Complexity.
ÖZET
KİŞİSEL ÖZELLİKLERİN VE KARMAŞIKLIĞIN ESTETİK
TERCİHLER ÜZERİNE ETKİLERİ
Bilgiç, Naz
Yüksek Lisans, İç Mimarlık ve Çevre Tasarımı Tez Danışmanı: Yrd. Doçent. Dr. Çağrı İMAMOĞLU
Haziran, 2017
Bu çalışma görsel karmaşıklık ve kişilik özelliklerinin estetik tercihler üzerine etkilerini incelemektedir. Bu amaçla üç farklı karmaşıklık seviyesinde olacak şekilde manipüle edilmiş geometrik şekillerden oluşan dokuz adet imaj ve dokuz adet bina cephesi fotoğrafı kullandık. “Beş Faktör modeline” göre dışadönüklük, uyumluluk, sorumluluk, duygusal dengelilik, deneyime açıklık adı altında beş temel kişilik özelliği bulunmaktadır. Bu kişisel özelliklerin görsel karmaşıklıkla ilgili estetik tercihler üzerindeki etkisi, 207 katılımcı (144 kadın ve 63 erkek) ile çevrimiçi bir araştırma yapılarak incelenmiştir. Çalışmanın sonuçlarına göre geometrik
şekillerdeki karmaşıklık tercihi ve katılımcı yaşları arasında pozitif bir ilişki vardır. Bu yaşlı katılımcıların gençlerden daha karmaşık uyaranları tercih ettiklerini
göstermektedir. Sonuçlar aynı zamanda geometrik şekillerde oylanmış karmaşıklık ve kabul edilebilirlik arasında olumlu bir ilişki olduğunu ortaya koymuştur; bu kabul edilebilirlik puanları yüksek olan katılımcıların, geometrik şekilleri diğerlerinden daha karmaşık olarak algıladığı anlamına gelmektedir. Geometrik şekillerde katılımcılar tarafından derecelendirilmiş karmaşıklık düzeyleri ve kararlılığın
karşılıklı ilişkisi de olumludur. Bina cephelerinin karmaşıklık derecelendirmelerinde yüksek dışa dönüklük puanına sahip olan katılımcılar arasında da benzer bir eğilim vardır. Dışa dönüklük puanı daha yüksek olan katılımcılar yapı cephelerini daha karmaşık olarak oylamışlardır. Geometrik şekiller ve bina cepheleriyle yapılan bu çalışmanın sonucunda kişisel özelliklerin, karmaşıklık ve aşinalığın katılımcıların estetik tercihlerinden etkilendiği görülmüştür.
Anahtar Kelimeler: Beş Faktör Modeli, Bina Cepheleri, Estetik Tercihler, Geometrik Şekiller, Görsel Karmaşıklık.
ACKNOWLEDGEMENTS
I would like to thank Assist. Prof. Dr. Çağrı İmamoğlu for his invaluable support, endless patience, supervision and guidance throughout this study. I consider myself as privileged for being one of his students.
I would like to thank Prof. Dr. Halime Demirkan for guiding me in her Research Methods II course and helping me to find my research focus. Also, I would like to thank my jury members İpek Memikoğlu and Yasemin Afacan for their contributions and feedbacks.
My greatest indebtedness is to my family to whom I owe what I have – Arif Bilgiç, Aslıhan Bilgiç, Burcu Bilgiç and Meloş Bilgiç - for their trust and support in every aspect of my life.
I would like to thank all my friends for their friendship and moral support during this study. Lastly, I would like to thank Elif Aksel for being my student co-advisor and supporting me mentally.
TABLE OF CONTENTS
ABSTRACT ... iii
ÖZET ... v
ACKNOWLEDGEMENTS ... vi
TABLE OF CONTENTS ... viii
LIST OF TABLES ... x
LIST OF FIGURES ... xi
CHAPTER I: INTRODUCTION ... 1
1.1 Aim of the Study ... 4
1.2 Structure of the Thesis ... 4
CHAPTER II: LITERATURE REVIEW ... 6
2.1 Visual Complexity ... 6
2.2 Visual Complexity and Aesthetic Preference ... 10
2.2.1 Geometry Preference ... 11
2.2.2 Façade Complexity Preference ... 14
2.3 Relationship Between Aesthetic preferences and Personal Factors ... 17
2.4 The Big-Five Model of Personal Traits ... 19
2.5 Familiarity for Visual Stimuli ... 21
3.1 Research Question ... 23
3.2 Sample Group ... 24
3.3 Instruments ... 25
3.4 Procedure ... 26
CHAPTER IV: RESULTS ... 28
4.1 Mean and Standard Deviations of the Ratings of Respondents on Geometric Shapes and Building Façades ... 29
4.2 Factor Analysis of Personal Trait Data ... 31
4.3 Correlations Between Mean Ratings on Personal Traits ... 34
4.4 Correlations Between Mean Ratings of Age, Aesthetic Preference, Complexity and Familiarity Ratings ... 38
4.5 Effect of Gender on Aesthetic Preference Complexity and Familiarity ... 39
4.6 Effect of Profession on Aesthetic Preference Complexity and Familiarity ... 42
CHAPTER V: DISCUSSION ... 45
CHAPTER VI: CONCLUSION ... 56
REFERENCES ... 62
APPENDICES ... 72
APPENDIX A: SURVEY (ENGLISH) ... 72
APPENDIX B: SURVEY (TURKISH) ... 82
APPENDIX C: INSTRUMENTS ... 92
LIST OF TABLES
Table 1. Means and Standard Deviations of the Ratings of Respondents on Triangle, Circle and Square ... 30 Table 2. Means and Standard Deviations of the Ratings of Respondents on Low,
Medium and High Complexity Building Façades ... 31 Table 3. Means and Standard Deviations of the Ratings of Respondents on Geometric
Shapes and Building Façades ... 31 Table 4. Higher-order Factor Analysis for The Big-Five Model of Personal Traits . 32 Table 5. Items of Factor 1 and Factor 2 ... 33 Table 6. Correlation Between Stability, Plasticity and Aesthetic Preference Ratings
LIST OF FIGURES
Figure 1.First Set Of Findings: An Inverted-U Shape Relationship Between Aesthetic Preference And Complexity ... 2 Figure 2. Second Set Of Findings: A Positive Linear Relationship Between Aesthetic
Preference And Complexity ... 2 Figure 3. Patterns Sampling Complexity Variables ... 9 Figure 4.Factors And Levels Affects Façade Complexity ... 15 Figure 5. Mean Preference Ratings Of Respondents On Manipulated Low, Medium
And High Complexity Geometric Shapes And Building Façades ... 46 Figure 6. Mean Complexity Ratings Of Respondents On Manipulated Low, Medium
And High Complexity Geometric Shapes And Building Façades ... 47 Figure 7. (A) Mean Preference, Complexity And Familiarity Ratings Of
Respondents On Manipulated Low, Medium And High Complexity
Geometric Shapes ... 48 Figure 7. (B) Mean Preference, Complexity and Familiarity Ratings of Respondents
on Manipulated Low, Medium and High Complexity Building Façades...49
Figure 8. (A) Mean Preference Ratings Of Respondents On Manipulated Low, Medium And High Complexity Geometric Shapes Distributed According To
Figure 8. (B) Mean Preference Ratings of Respondents on Manipulated Low, Medium and High Complexity Building Façades Distributed According to Profession...53
CHAPTER I
In this chapter, a brief introduction explains the general concepts that are mentioned in this thesis are covered. First, a general introduction is given about visual
complexity, aesthetic preference, and familiarity. Then issues covered in this thesis are revealed. The aim of the study is presented. Lastly, in the structure of the thesis, part information about chapters and their contents are mentioned to have a general understanding of this research overall.
INTRODUCTION
Complexity is one of the important factors related to the perception and cognition of a visual stimulus, frequently considered to be an important variable in evaluation studies (Wohlwill, 1976; Michailidou, Harper & Bechhofer, 2008; Orth & Wirtz, 2014; Chassy, Lindell, Jones & Paramei, 2015; Chung, Chong & Kim, 2016). Researches exist examined the effects of complexity and aesthetic preference
relationship (Vitz, 1966; Berlyne, 1971; Saklofske, 1975; Farley & Weinstock, 1980; Heaps & Handel, 1999; İmamoğlu, 2000; Nadal, Munar, Marty & Cela-Conde, 2010; Güçlütürk, Jacobs & Van Lier, 2016). Some of the researchers explain the
complexity and aesthetic preference as an inverted u shape (Vitz, 1966; Berlyne, 1971; Saklofske, 1975; Farley & Weinstock, 1980; İmamoğlu, 2000; Güçlütürk et al., 2016). An inverted u shape relationship refers to a relationship which both preference and complexity increases at an optimal level then from that level preference began to decrease as complexity still increases (See Figure 1). Other studies claim that relationship between complexity and aesthetic preference is
positive and linear (Kaplan, Kaplan & Wendt, 1972; Wohlwill, 1976)(See Figure 2).
Figure 1.First Set of Findings: An Inverted-U Shape Relationship Between Aesthetic Preference and Complexity
Figure 2. Second Set of Findings: A Positive Linear Relationship Between Aesthetic Preference and Complexity
Previous studies also mention familiarity as an element that affects aesthetic preference for complexity. Mielby, Kildegaard, Edelenbos, Thybo, and Gabrielsen (2012) suggests that fluency while processing a stimulus as a result of being familiar with it cause positive response towards this stimulus. Another effect of familiarity on the aesthetic preference for visual complexity according to previous studies is when a receiver is familiar with a stimulus it comes more predictable and less complex to him (Zajonc, 1968; Wickelgren, 1979; İmamoğlu, 2000).
Studies also found that aesthetic preferences over complexity may change according to personal factors (Chamorro-Premuzic, Reimers, Hsu & Ahmetoglu, 2009;
Cleridou & Furnham, 2014). Age, gender, profession, and personal traits are the issues that covered previously in the topic of aesthetic preferences of individuals. However, there is a gap in the literature about the effects of personal traits and complexity over the aesthetic preferences together. In the light of these studies, this study mostly focused the effects of personal traits and complexity on the aesthetic preferences over stimuli. It also tries to minimize the effect of familiarity while trying to understand the nature of the relationship between complexity and aesthetic preference with the influence of personal traits.
The experimental design was conducted in two stages. In the first stage, demographic information was collected from respondents. As a second stage, personal traits of respondents were decided with a 50-item questionnaire based on Goldberg’s (1990) Big-Five model. In the third stage, nine images of geometric shapes and nine building façade photographs showed to respondents to understand their aesthetic preferences of visual complexity.
1.1 Aim of the Study
The main aim of this study is to understand the effects of complexity and personal traits on the aesthetic preferences. While there are some sub-aims which are;
1. Understanding the effect of familiarity over the complexity preference,
2. Examining the effects of gender and profession over the complexity preference, 3. Having an understanding about geometric shape and façade complexity
preferences.
1.2 Structure of the Thesis
The present study consists of six chapters. The introduction is the first chapter that gives general information about the concept of complexity and links it with the aesthetic preference, familiarity, and personal trait topics. Then it gives brief information about the main aim and structure of the study. In the second chapter, which is the literature review, previous studies in the literature that examine the visual complexity and aesthetic preference relationship, effects of familiarity on the perception of complexity, aesthetic preferences for geometric shapes and façades in relation with complexity is mentioned. The literature review also mentions the effect of personal traits on complexity preference and it explains the Big-Five Model. In the third chapter, the method of the study is given. In this chapter main aim of the study and research question is represented, then demographic data of the sample,
instruments in the current study, the procedure of this study and statistical tests that used in this study is presented. Results are given in the fourth chapter with necessary tables to explain the tests conducted with IBM SPSS program. In discussion chapter, which is the fifth chapter, results of the study in comparison with literature are discussed. In the last chapter, a brief conclusion is given to summarize the study. Also strengths, limitations and possible further studies that may be conducted are mentioned.
CHAPTER II
In this chapter, previous studies are covered to understand the relationship between aesthetic preference and complexity. First visual complexity is described, and
elements that made a stimulus complex are presented. Then, the relationship between aesthetic preference and visual stimuli is revealed, and two different ideas about this relationship are mentioned. After that geometric shape and building façade and complexity topics are covered. Next, the personal factors, which affect the aesthetic preference on visual complexity, are examined, and Big-Five model is presented. Lastly, the issue of familiarity that affects the aesthetic preferences on complexity is explained as another variable.
LITERATURE REVIEW
2.1 Visual Complexity
Visual complexity as an idea first emerged from the good form from Gestalt psychology, and it developed through different pathways like the convergent and
complementary analyses of visual complexity theory, perceptual learning theory, and neural circuit theory (Donderi, 2006). According to Donderi (2006) results of these developmental studies can be summarized as:
Simple forms and arrays activate generalized perceptual objects that correspond to higher-level neural circuits, that are coded more simply
according to visual complexity theory, and that are activated by a wider range of proximal inputs. Complex forms and arrays activate both high- and low-level neural circuits that respond to a smaller range of less probable inputs. The particular coding achieved by a visual input, and therefore the perceived visual complexity of that input, is constrained at both ends of the perceptual system. (p. 92-93)
Complexity is “the degree of difficulty in providing a verbal description of an image”(Heaps & Handel, 1999, p. 301). According to Heylighen (1999), the perception of complexity is related to the variety in the visual stimulus. The complexity of a visual stimulus is about how the elements of line, direction, shape, size, color, texture come together to produce harmony, contrast, dominance, rhythm, and balance (Osborne & Farley, 1970). Complexity increases with detail,
irregularity, number, asymmetry, range, color, contrast, material and texture of objects (Berlyne, 1974; Pieters, Wedel, & Zhang, 2007; Wolfe, Horowitz, & Kenner, 2005). Berlyne (1971) presented the stimulus he created to explain the factors that affect the complexity of a pattern in his study about aesthetic (See Figure 3). He created image pairs; images on the left-hand side are the less complex ones while he manipulated images on the right-hand side according to different factors that affect complexity. Supportively, Professor R. Frances (as cited in Berlyne, 1971) found that complexity of visual patterns might change according to differing in a number of elements, regularity of arrangement, or presence or absence of incongruity. Some
visual pattern simpler (Feldman 1997; Palmer 1999; Van der Helm 2000). In other words, repetition and uniformity in visual stimuli help people to perceive it less complex than disorganized and cluttered ones (Heaps & Handel 1999; Olivia & Torralba 2001). Heylighen (1999) states that when a visual stimulus has elements that are hard to separate from each other and too difficult to identify as individually, it is perceived as complex. Furthermore when its parts are separated or
conceptualized it becomes simpler for the receivers (Heylighen, 1999). Olivia, Mack, Shrestha and Peeper (2004) sum up this statement by Heylighen as perceptual
grouping, a characteristic independent of the quantity of parts, an observer perceives in the scene also related to the perception of receivers about complexity. They also added to the explanation that visual complexity also depends on scale, schemas, and familiarity with the scene (Olivia et al., 2004).
Figure 3. Patterns sampling complexity variables Adapted from Aesthetics and Psychobiology (p. 199) by D. E. Berlyne, 1971, New York, NY:
Appletoll-Century-2.2 Visual Complexity and Aesthetic Preference
Aesthetic preference is the degree that a certain stimulus is selected over another stimulus for cosmetic purposes (Nugent, 2013). Gustav Theodor Fechner (1876) was one of the first researchers that use the method of asking participants about their preferences and assesses their aesthetic preferences over different stimuli. By this method, he built a bridge that combines the aesthetic preferences and individual factors that affect the preferences over different stimuli. Using the same method researchers tried to examine the relationship of complexity and aesthetic preference. They investigated the relationship of complexity and aesthetic preference in different contexts like aesthetic preference for visual complexity of car front images (Chassy et al., 2015); perception of complexity and aesthetic preference for harmonic progression of music for adults with schizophrenia (Chung et al., 2016); aesthetic preference on complexity of Piano Jazz (Gordon & Gridley, 2013); aesthetic preference and visual complexity in abstract art (Osborne & Farley, 1970);
complexity and liking of traditional and modern house façades (İmamoğlu, 2000); visual complexity and aesthetic perception of web pages (Michailidou, et al., 2008); visual preferences for pictures of fruit and vegetable mixes (Mielby et al., 2012), among others (Erdogan, Binici, Akalin & Yildirim, 2013; Friedenberg & Liby, 2016; Krajewska & Waligorska, 2015; Orth & Wirtz, 2014; Willis & Dornbush, 1968).
Berlyne (1971) who is seen as a leading researcher in his field describes the visual complexity and aesthetic appeal relationship depending on an arousing and de-arousing effect and according to him complexity and arousal have a direct linear
relationship. When pleasantness is taken into consideration with these determinants, the relationship becomes inverted u shaped (Berlyne, 1971,1974). According to Nadal et al. (2010), complexity dimensions have different relationships with
aesthetic preference. There are two kinds of approach existing about the relationship of visual complexity and aesthetic preferences. In one, researchers say that there is an inverted U-shape relationship between complexity and aesthetic preferences of people, where medium level complexities are the preferable ones (Vitz, 1966; Berlyne, 1971; Saklofske, 1975; Farley & Weinstock, 1980; İmamoğlu, 2000; Mielby et al., 2012; Gordon & Gridley, 2013; Güçlütürk et al., 2016). However, other studies suggest that a positive linear relationship could be found between complexity and aesthetic preferences (Willis & Dornbush, 1968; Kaplan et al., 1972; Wohlwill, 1976). Nadal et al. (2010) claimed that the different findings in the
relationship between complexity and aesthetic preference might be caused by differences in the conceptualization and operationalization of visual complexity, viewer motivation, and viewer response. While Berlyne (1970) in his collative motivation model claimed that people prefer an optimal level of arousal, Kaplan (1995) says that people tend to prefer simple patterns but also looking for mystery and obscurity that can be understood as stimuli with greater complexity.
2.2.1 Geometry Preference
A factor that alters the aesthetic preference for complexity levels is the geometry of the stimuli. There are studies about aesthetic preference for different kinds of stimuli, such as symmetrical rather than asymmetrical, larger than small, curved than sharp,
etc. (Bar & Neta, 2006; Carbon & Leder, 2005; Silvera, Josephs & Giesler, 2002; Tinio & Leder, 2009). Carbon and Leder (2005) mentions in their study with car interiors that people prefer curved interior features more than sharp ones. Dazkir and Read (2012) supportively found in their study of furniture forms and their influence on emotional responses found that curvilinear forms evoke more positive emotions and respondents wanted to spend more time with curvilinear furniture that
rectangular ones. Bar and Neta (2006) also support the same tendency for liking. In their study, respondents prefer curved objects rather than sharp objects as everyday tools. They suggest that this aesthetic preference for the curved objects rather than sharp objects may be related to bias for sharp objects. Supportively, in her study about emotional responses of the respondents about the use of rectilinear,
symmetrical curvilinear and asymmetrical curvilinear forms in virtual environments, Örer (2016) found that in a virtual setting respondents’ preference ratings increase from rectangular to curvilinear environments. This means respondents have higher aesthetic preference scores on asymmetrical curvilinear interior settings, while they have lower aesthetic preference scores over rectangular interior settings (Örer, 2016).
The reason that created this different aesthetic preference over geometric shapes may be because of the semantic meanings of the objects (Bar & Neta, 2006). In their study about emotional valence and the aesthetic preference for curved objects, Leder, Tinio and Bar (2011) found similar results as Bar and Neta (2006). In addition to this Leder et al. (2011) suggest that curved object is preferred more than sharp ones, but additionally they found that aesthetic preference for curved objects is related with emotional valence, “the hedonic value of a specific emotion as either positive or negative” (Briesemeister, Kuchinke & Jacobs, 2012, p. 1). People have a positive
attitude towards curved objects if it is characteristically positive or neutral, on the other hand even though the object is curved, if it is negative in emotional valence they feel threatened (Leder et al., 2011). In her study about colors and lines, Hevner (1935) used two versions of four designs and asked respondents to match these designs with the adjectives that she grouped. As a result of her study, she found curves are associated by serene, graceful, and tender-sentimental adjectives while angles were associated with robust, vigorous adjectives (Hevner, 1935). It can be inferred from this experiment that people tend to correlate curves with more positive senses when it comes to angular shapes they have more negative feelings.
Berlyne’s (1971) stimuli example previously showed that there are different effects exists to create different complexity levels. In the study by Friedenberg and Liby (2016) about aesthetic preference for the complexity of random texture patterns, in addition to Berlyne’s (1971) findings, they found that people prefer patterns with 50% fill level. According to them different element level preferences in their two different experiments, but the common thing is the fill level in each different task when it comes to complexity (Friedenberg & Liby, 2016). Also, they thought that respondents seem to be rating according to the range of patterns (Friedenberg & Liby, 2016). Conclusively Friedenberg and Liby (2016) depicted that combinations that were made with medium elements have more combination with different scaled elements and were perceived as more complex and more appealing.
is used. Three geometric shapes that are used commonly in basic design courses, which are circle, triangle and square are selected. Square is selected as a first rectangular sharp object, then triangle selected as a second sharp object, which also used in previous studies because of its basic form. Then circle selected as a circular geometric shape to examine the relationship of aesthetic preference over the curved and sharp objects.
2.2.2 Façade Complexity Preference
Façades are one of the common topics that architects researched on when it comes to complexity and aesthetic preference issue. According to Stamps (1999), façades can be described with three different and independent factors: Silhouettes, surfacing and massing. Altering over these factors makes a façade more complex (See Figure 4). Silhouette is the most studied factor among those three in previous studies. There are different geometric features that affect the respondent's evaluation of a silhouette but according to literature most dominant ones are: the number of turns, symmetry (Chipman, 1977), line lengths, changes in angles (Zusne, 1970), and perimeter squared divided by area (Quinlan, 1991). When it comes to surface as a factor of a façade, Van der Laan (1983) suggests that in a music note we perceive two very close frequencies as a one note. The Same perception occurs when people look at the objects. People have a tendency to perceive objects in discrete sizes rather than the continuous range of sizes (Van der Laan, 1983). According to Van der Laan’s (1983) research considering part/whole relationship, if the ratio between them is larger than 1/7, parts are being understood as a texture in the whole object. Massing, on the other
hand, refers to articulations on the façade (Stamps, 1999). When it comes to massing of a façade, vertical and horizontal divisions, number of openings and volumes that broken up were the common design elements in building façades according to Stamps (1999). He also suggests that people assess façades according to six visual elements for each building: overall massing, secondary massing, openings,
texture(s), width, and height (Stamps, 1999).
Figure 4.Factors and Levels Affects Façade Complexity Adapted from “Physical determinants of preferences for residential facades” by A. Stamps, 1999,
In this study, the factors affect the perception of building façades presented to experts when they were evaluating building façades and experts rated the building façades accordingly. Through the experiment, respondents didn’t have any
information about these factors. By this way, we are able to observe the effectiveness of these factors with comparing the manipulated and rated complexity of building façades.
In the present study, building façades are used as an alternative of geometric shapes. The reason is geometric shapes somehow is a common stimulus that everybody is familiar with it. To understand aesthetic preference on visual complexity in an architectural concept in a 2D form building façade seemed like a good option. We examined façade complexity and aesthetic preference issue through photographs. One of the previous studies about visual complexity and aesthetic that uses photographs as an instrument revealed that different contexts create different reactions when it comes to photography that they experienced with (Sun, Yamasaki & Aizawa, 2014). They evaluated the aesthetic preference and complexity
relationship of photographs in their study and found that ascending or descending parts of the inverted u shaped relationship between them is exist for different categories of photographs; ascending trends are in architecture, cityscape, and landscape while descending ones are animal, floral and food drink categories (Sun et al., 2014). On the other hand, they had difficulty with portrait and still life
photographs that they suggest that is because these photographs convey more semantic meanings (Sun et al., 2014).
2.3 Relationship Between Aesthetic preferences and Personal Factors
Personal factors may also be another factor that affects aesthetic preferences of respondents. Previous studies supported this statement with their findings about the relationship between aesthetic preferences and personal factors like age, gender, profession, personal traits, etc. (Chamorro-Premuzic et al., 2009; Cleridou & Furnham, 2014; Ghomeshi & Jusan, 2013; Gifford, 1980; Gordon & Gridley, 2013; Jellinek & Köster, 1979; Mielby et al., 2012; Nasar, 1988, 1989; Simon & Wohlwill, 1968; Willis & Dornbush, 1968; Vitz, 1966).
In their study, Willis and Dornbush (1968) found that complexity preference exists even in 5-year-old kids, but it increases with age. In a study of familiarity,
complexity, and liking in façades, Erdogan et al. (2013) found that young people found images of house façades less unfamiliar, modern and complex when compared to the older respondents.
Eisenman (1967) suggests that gender is another important factor when the aesthetic preference for complexity considered in his study of aesthetic preference for
complexity in polygons. His findings support the idea that women tend to prefer more complex polygons than men (Eisenman, 1967). He also found a relationship between complexity preference and birth order which is first born men prefers more complexity while in contrast first born women prefers less complexity (Eisenman, 1967). In their studies about odors Jellinek and Köster (1979) found that men prefer
less complex odors than women. Also in the study by Erdogan et al. (2013) men evaluation of images of house façades are more positive than women. Supportively in Mielby at al. (2012) found that women prefer more complex stimuli than men in their study about aesthetic preference for pictures of fruit and vegetable mixes’ complexity. In their discussion, they mentioned that it might be the result of the degree of exposure (Mielby et al., 2012).
Some studies suggest that people who have different majors and specializations have different judgments related to their aesthetic preferences (Gifford, 1980; Nasar, 1989). For example, architects are separated from non-architects when their aesthetic preferences are taken into account. Professions and previously taking part of any art or design activities also is another factor that affects aesthetic preference for
complexity. Professor R. Frances (as cited in Berlyne, 1971) also found in his study with students and workman that students liked more complex patterns while
Workman likes simple patterns more. It can be inferred that students may have more experience with complex visual stimuli and also their intellectual capacity and background may cause this result. Another example is Gordon and Gridley (2013) found in their study that musicians enjoyed more complex piano jazz than non-musicians. Some other studies also support the idea that students that are artistically sophisticated tend to prefer more complex visual forms (Simon & Wohlwill, 1968; Vitz, 1966). In his study Nasar (1988) found that apart from ‘architects’ and non-architects’ aesthetic preferences differ from each other, architects also have a difficulty to understand what non-architects like. Ghomeshi and Jusan (2013) suggested that for façade design both designers and non-designers prefer the same amount of physical clues, the only difference between these groups is when
designers have higher aesthetic preference scores on articulation and square windows; non-designers prefer circular or oval shapes and their reflectance more.
Previous literature also mentions personal traits might have a role on aesthetic preference for visual complexity judgment. Based on their findings from the
literature, Osborne and Farley (1970) hypothesized that respondents who prefer more complex paintings have higher extraversion scores than respondents who prefer lower complexity paintings. But they found no significant relationship between aesthetic preference for complexity and extraversion for the judgment of abstract art paintings. Chamorro-Premuzic and Furnham (2004) found in their study about art judgment and personal trait relationship that three of The Big-five Model, which are Neuroticism, Extraversion, and Conscientiousness, were related with art judgment scores. While extraversion and conscientiousness were negatively related to art judgment, Neuroticism was positively related (Chamorro-Premuzic & Furnham, 2004).
2.4 The Big-Five Model of Personal Traits
The Big-Five Model is a commonly used personal trait model in the psychology literature (Osborne & Farley, 1970; Furnham & Walker, 2001; Chamorro-Premuzic & Furnham, 2004; Krajewska & Waligorska, 2015). The Big-Five Model was introduced to the literature by Tupes and Cristal (1992). It has developed through decades and became more complex. Personal traits according to The Big-Five Model
as presented by Goldberg (1990) are Extraversion, Agreeableness,
Conscientiousness, Emotional Stability (Neuroticism), and Intellect. Each of traits in Big-Five Model is a major factor that defines groups of personality adjectives. In his studies, Goldberg (1990, 1992) tried to examine some English trait adjectives and create a link between these adjectives and Big-Five Model of personal traits.
Costa and McCrae (1985) defines extroverted people as people who like other people who are assertive, talkative, active, prefer large groups, upbeat, energetic and
optimistic. Agreeableness defined by Graziano and Eisenberg (1997) as “a general latent variable that summarizes more specific tendencies and behaviors (e.g., being kind, considerate, likable, cooperative, helpful)” (p. 815). Conscientiousness is another trait defined by Hogan and Ones (1997) as “conformity and socially
prescribed impulse control” (p. 849). It is related to a person’s adaptation to authority (Hogan & Ones, 1997). They relate this adaptation process with an argument from Freud that suggests people cannot fully adapt to authority because of their nature (Hogan & Ones, 1997). According to them if a person has difficulty adapting to authority fully as nature, a conscientious person’s behavior becomes a strategy to avoid guilt-associated behaviors (Hogan & Ones, 1997). And they came up with the idea that people who are extremely conscientious are more compulsive, dependent, stubborn and stingy while people who have a little conscientiousness seen as not able to solve disagreements with the authority (Hogan & Ones, 1997). As a trait
Neuroticism is related to anxiety, hostility, depression, self- consciousness, vulnerability, and impulsiveness (Wiggins & Trapnell, 1997). On the other hand, while neurotics have a higher score on Neuroticism, artists have higher scores of openness to experience. According to the studies by McCrae (1993, 1994), Openness
to Experience has a strong relationship with “artistic temperament, diverse issues as social attitudes, hypnotizability, career changes, and moral reasoning” (McCrae & Costa, 1997, p. 826).
2.5 Familiarity for Visual Stimuli
Literature shows that familiarity and aesthetic preference are related to each other. Some findings mention this relationship as when familiarity increases, aesthetic preference rating decrease (Cantor, 1968; Cantor & Cantor, 1966; Cantor & Kubose, 1969; Erdogan et al., 2013; Faw & Nunnally, 1971; Lemond & Nunnally, 1974). As an example in their study, Erdogan et al. (2013) compared domestic and foreign façades in terms of familiarity, impressiveness, complexity, and liking. They found that domestic façades were rated as more familiar but also unimpressive while foreign façades were rated as less familiar but more impressive and liked more (Erdogan et al., 2013). Another point of view suggests the opposite when familiarity increases aesthetic preference also increases, (Zajonc, 1968; Zajonc, Swap, Harrison & Roberts, 1971). Explanatorily, Berlyne (1970) argued that there is a correlation between stimuli type and familiarity of visual complexity issue. He suggests that in complex stimuli preference and familiarity both increase, on the other hand in simple stimuli preference rating decreases when familiarity decreases (Berlyne, 1970).
Familiarity with visual stimuli also affects aesthetic preference and complexity relationship. Familiarity makes processing easier and for that reason, people perceive
a familiar stimulus fluently (Mielby et al., 2012). This fluency in perception causes a more positive aesthetic respond towards stimulus according to Mielby et al. (2012). Similarly, Whittlesea (1993) also found that familiar objects are preferred more than unfamiliar ones.
When it comes to complexity and familiarity of certain stimuli familiar visuals may appear to be relatively more predictable, therefore less complex (Zajonc, 1968; Wickelgren, 1979). In furtherance, this argument İmamoğlu (2000) stated that if a person is relatively familiar with a scene, even if it is complex, they might not perceive it as overwhelmingly complex. People’s differential familiarity with the scenes may influence both their perceptions of complexity and liking for the scenes. In his study about complexity and the aesthetic preference for traditional and modern house façades İmamoğlu (2000) found that between two stimuli, which have the same amount of familiarity, complex one is preferred more. On the other hand when complexity began to increase more than moderate level both aesthetic preference and familiarity began to decrease (İmamoğlu, 2000). According to Wickelgren (1979), people prefer an optimal level of familiarity and they like complex stimuli when they get familiar with it. The minimum level of complexity may make someone feel bored while maximum level of complexity may make people feel overwhelmed. So it can be inferred from that people tend to prefer complex but predictable stimuli. That inference coincides with Berlyne’s (1970) finding of familiarity and aesthetic preference relationship that is these two contexts have an inverted u shape
relationship. As the familiarity increases, aesthetic preference also increases until a certain point when they both begin to decrease from that peak point.
CHAPTER III
In this chapter methodology of the study is covered. First, research questions that lead this thesis are given. Then, sample group, its distribution to gender, profession, and education level is explained. In the instruments section survey and materials that are used in this study is mentioned. Lastly, in procedure section process that is used in the study is explained in detail.
METHOD OF THE STUDY
3.1 Research Questions
Following from the introduction, the study reported in the present thesis examined the role of complexity on aesthetic preference and their relationship with personal traits. The main question of the thesis is:
What is the relationship between aesthetic preferences for visual complexity and personal traits?
Other research questions were:
What is the relationship between aesthetic preferences for visual complexity and age?
What is the relationship between aesthetic preferences for visual complexity and gender?
What is the relationship between aesthetic preferences for visual complexity and profession?
What is the effect of familiarity on the preference for complexity?
3.2 Sample Group
In this study, the effects of personal traits on aesthetic preferences for visual complexity were examined with 207 respondents. Respondents have a wide diversity. They have different ages and different education levels; they also come from different backgrounds. 144 (70%) women and 63 (30%) men responded to an online survey. Their ages are ranges between 17 and 79 with a mean age of 39,5. Respondents have different professions. Respondents consist of 89 designer/ artists (43%) and 118 people from different backgrounds (57%). They also have different education levels as; 121 (58,5%) respondents have University degree, 49 (23,7%) have master and 12 (5,8%) PhD degree, 24 (11,6%) have a degree from high school and 1 respondent is elementary school graduate (0.5%).
3.3 Instruments
For assessing personal trait and aesthetic preference on complexity relationship three sets of instruments were used. As the first set, a personal trait inventory test created with Big-Five Model Personal Trait Inventory items that have 50 questions were used (See Appendix A, B). According to this inventory, there are 10 statements for each trait group and a 5-point Likert scale exists to evaluate the statements from 1 (very inaccurate) to 5 (very accurate).
A total of nine abstract images with three levels of visual complexity were created as the second set (See Appendix C). These images contained three basic geometric shapes: triangle, square and circle. To eliminate the effect of color, images were black and white and to eliminate issues of familiarity, all images were presented in abstract form. The difference between the variations was that the shapes remained the same, but their numbers and scales were manipulated.
To examine the aesthetic preferences for building façades, 41 façade photographs with different complexities chosen from Becher and Becher (1995)’s book as the third set. Nine graduate students from Bilkent University Interior Architecture and Interior Design department rated the degree of complexity of each photograph. We arranged the photographs according to the ratings from lowest to highest level of complexity and selected three sets of three façades best representing low, medium and high complexity levels.
To assess aesthetic preference, complexity perception and familiarity five-point Likert scale was used to examine aesthetic preference; the scale was from “Do not like it at all” (1) to “like it very much” (5). For complexity perception; the scale was from “not complex at all” (1) to “very complex”. To analyze familiarity; the scale was from “not familiar at all” (1) to “very familiar”.
3.4 Procedure
The study was conducted online using Google forms. It was available to anybody with the web link. The survey, which was in Turkish, consisted of 3 stages. In the first stage the respondents were informed about the study and its purpose, then they answered questions about their demographics. In the second stage, the 50-item representation of the Goldberg (1992) markers for The Big-Five Model used to reveal personal traits of the respondents. This questionnaire is to measure The Big-Five Model of person traits using the items from International Personality Item Pool (IPIP)(Goldberg, 1999; Goldberg, Johnson, Eber, Hogan, Ashton, Cloninger & Gough, 2006). There are 10 statements, negative and positive keyed, and for each factor in a 50-question version of that IPIP offers for each personal trait. To calculate respondents tendency of personal traits each positive keyed statement the responses from “very inaccurate” to “very accurate” given values from 1 to 5. For negatively keyed statements, responses from “very inaccurate” to “very accurate” calculated with giving them values from 1 to 5, respectively. Each value for every respondent was summed up for each factor separately and total scores calculated. During the third stage respondents were asked to look at each image separately in a random order and after each image, their ratings for aesthetic preference, complexity, and
familiarity collected through 5-point Likert scales. To avoid the familiarity effect images and building façades were displayed in a mixed random order using a randomization machine. First 100 respondents did the survey in one random order and the rest of the respondents did the survey in reverse to control for possible order effects.
CHAPTER IV
In this chapter, statistical test results of the study are given. First, statistical tests that are used to analyze data are explained. Secondly, mean and standard deviation results for geometric shapes and building façades is mentioned. Thirdly, factor analysis and internal consistency reliability test results for personal trait data are mentioned. Then correlations of personal trait data and aesthetic preference, complexity and
familiarity ratings of respondents for both geometric shapes and building façades are revealed. Fourthly, correlations between age and aesthetic preference, complexity and familiarity ratings of respondents for both geometric shapes and building façades are mentioned. Lastly, repeated measures ANOVA test results for gender and
profession are explained.
RESULTS
Statistical analyses for these data sets were performed using IBM SPSS 21.0 program. First, all frequencies and descriptive statistics were calculated to have a general understanding of the data. Then to examine the relationship of personal traits aesthetic preference, and familiarity, correlations were calculated. According to
correlation matrices, weak interrelations between personal traits and aesthetic preference, complexity and familiarity ratings were found. To group personal trait data and have stronger relationships by doing this, a factor analysis to group trait data was determined to execute. Two new factors as a result of this factor analyses were found which are stability and plasticity. Then all correlations calculated again to examine the relationships between two factors found and aesthetic preference, complexity, and familiarity. To examine the gender and aesthetic preference and, profession and aesthetic preference relationships for both geometric shapes and façades repeated measures ANOVA tests run separately.
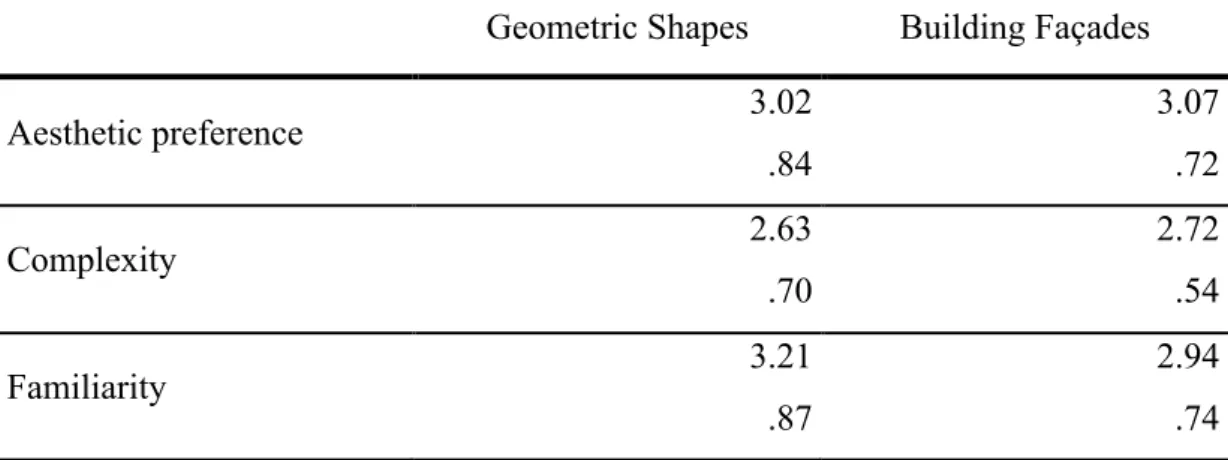
4.1 Mean and Standard Deviations of the Ratings of Respondents on Geometric Shapes and Building Façades
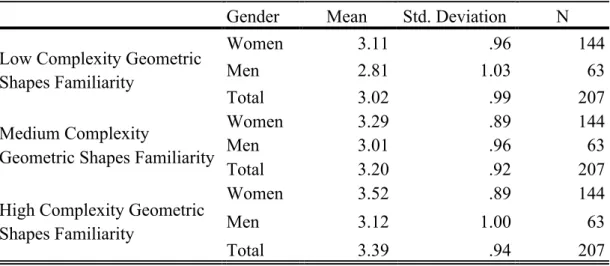
Means and standard deviations according to aesthetic preference, complexity and familiarity ratings of respondents calculated to understand relationships (See Appendix D, Table D 1, D 2, D 3). According to results among geometric shapes, circle is the most preferred one (µTriangle: 2.97, SDTriangle: .95; µCircle: 3.12, SDCircle: .96; µSquare: 2.98, SDSquare: .95). Mean scores show that square was perceived more complex between the other two geometric shapes (µTriangle: 2.56, SDTriangle: .80; µCircle: 2.56, SDCircle: .77; µSquare: 2.77, SDSquare: .78). When it comes to familiarity ratings of respondents, the circle was found the most familiar among the other geometric shapes (µTriangle: 3.11, SDTriangle: .99; µCircle: 3.36, SDCircle: .93; µSquare: 3.14, SDSquare: .98)(See Table 1).
When total aesthetic preference, complexity and familiarity of the building façades taken into consideration High Complexity building façades found the most preferred, most complex and most familiar among all complexity levels (µHigh Complexity Building Façade Preference: 3.39, SD µHigh Complexity Building Façade Preference: .86; µHigh Complexity Building Façades Complexity: 3.29, SDHigh Complexity Building Façades Complexity: .65; µHigh Complexity Building Façades Familiarity: 3.25, SDHigh Complexity Building Façades Familiarity : .72) (See Table 2). The circle is also preferred more than façades (µCircle: 3.12, SDCircle: .96; µFaçades: 3.07, SDFaçades: .72). However when overall aesthetic preference scores are taken into consideration façades preferred more than geometric shapes in total (µFaçades: 3.07, SDFaçades: .72; µGeometric Shapes: 3.02, SDGeometric Shapes: .84) (See Table 3). When total complexity ratings for geometric shapes and façades were compared, we found that façades were rated more complex than geometric shapes (µGeometric Shapes: 2.63, SDGeometric Shapes: .70; µFaçades: 2.72, SDFaçades: .54)(See Table 3). On the other hand, façades were found less familiar than the total familiarity score of geometric shapes (µFaçades: 2.94, SDFaçades: .74; µGeometric Shapes: 3.21, SDGeometric Shapes: .87) (See Table 3).
Table 1. Means and Standard Deviations of the Ratings of Respondents on Triangle, Circle and Square
Triangle Circle Square
Aesthetic preference 2.97 .95 3.12 .96 2.98 .95 Complexity 2.56 .80 2.56 .77 2.77 .78 Familiarity 3.11 .99 3.36 .93 3.14 .98
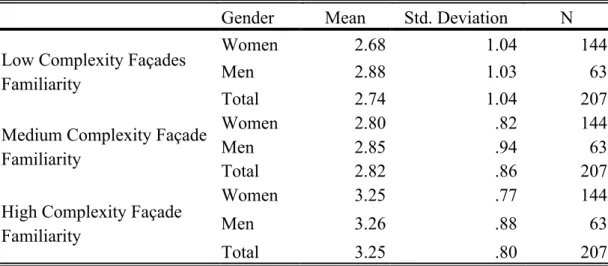
Table 2. Means and Standard Deviations of the Ratings of Respondents on Low, Medium and High Complexity Building Façades
Low Complexity Building Façades Medium Complexity Building Façades High Complexity Building Façades Aesthetic preference 2.81 .95 3.01 .82 3.39 .86 Complexity 2.04 .68 2.84 .71 3.29 .65 Familiarity 2.74 1.04 2.82 .86 3.25 .80
Table 3. Means and Standard Deviations of the Ratings of Respondents on Geometric Shapes and Building Façades
Geometric Shapes Building Façades
Aesthetic preference 3.02 .84 3.07 .72 Complexity 2.63 .70 2.72 .54 Familiarity 3.21 .87 2.94 .74
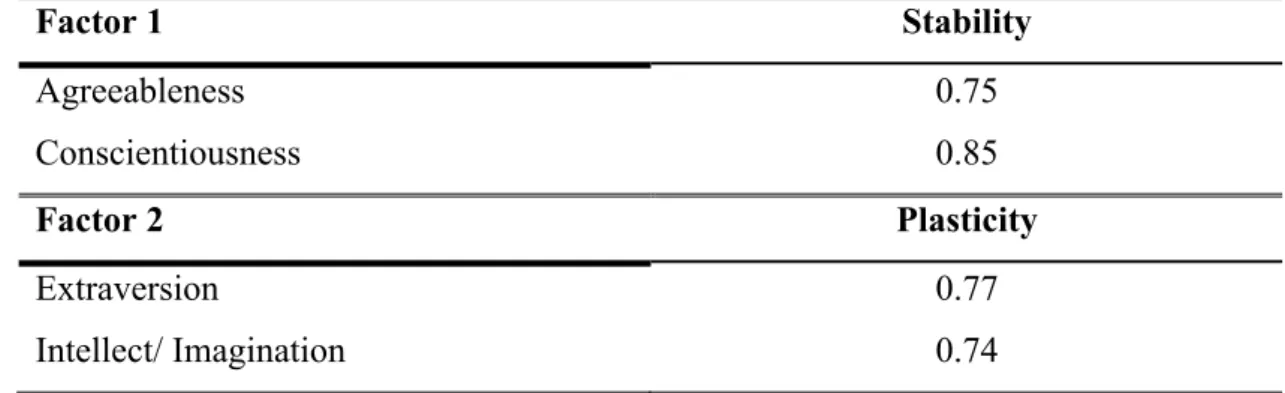
4.2 Factor Analysis of Personal Trait Data
As a further step to finding stronger correlations between personal traits and ratings of the respondents, we conducted a factor analysis test conducted with mean scores of each personal trait. Two factors emerged from five personal traits, Extraversion, Agreeableness, Emotional Stability, Conscientiousness, and Intellect/ Imagination
which accounted for 57.10 (See Table 4) per cent of the variance according to
`eigenvalue greater than one' criterion. In his study about higher order factors for The Big-Five Model, DeYoung (2006) found two higher factors and name them as
stability and plasticity. Accordingly, in the present study, the first factor was named as the Stability, and the items loaded on this factor were Agreeableness and
Conscientiousness with an eigenvalue of 1.469 and accounted for 29.37 per cent of the variance. The second factor was named as Plasticity. This factor consists of the items Extraversion and Intellect/ Imagination with an eigenvalue of 1.39 and
accounted for 27.72 per cent of the total variance (See Appendix D, Table D 4, D 5).
Table 4. Higher-order Factor Analysis for The Big-Five Model of Personal Traits
Factor 1 Stability Agreeableness 0.75 Conscientiousness 0.85 Factor 2 Plasticity Extraversion 0.77 Intellect/ Imagination 0.74
Interval validity test was conducted for each personal trait on each factor. For Factor 1, statements that used for decision of agreeableness and conscientiousness personal traits added to the reliability test. Then each statement for extraversion and intellect/ imagination personal traits put into a reliability test for factor 2 (See Table 5).
Cronbach’s alpha value was calculated 0.81 for the first factor named Stability. It includes twenty statements to decide personal trait scores for agreeableness and
conscientiousness. The scale was reliable. Cronbach’s alpha value calculated 0.78 for the first factor named Plasticity. It includes twenty statements to decide personal trait scores for extraversion and intellect/ imagination. The scale was reliable.
Table 5. Items of Factor 1 and Factor 2
Items of Factor 1: Stability Items of Factor 2: Plasticity I get chores done right away. I use difficult words. I am exacting in my work. I start conversations. I follow a schedule. I am full of ideas. I pay attention to details. I have excellent ideas.
I am always prepared. I don't mind being the center of attention. I like order. I have a rich vocabulary.
I sympathize with others' feelings. I talk to a lot of different people at parties. I take time out for others. I feel comfortable around people.
I feel others' emotions. I spend time reflecting on things. I make people feel at ease. I have a vivid imagination. I have a soft heart. I do not have a good imagination. I am interested in people. I am quiet around strangers. I am not really interested in others. I keep in the background. I feel little concern for others. I don't talk a lot.
I insult people. I am not interested in abstract ideas. I am not interested in other people's
problems.
I don't like to draw attention to myself. I leave my belongings around. I have difficulty understanding abstract
ideas.
I shirk my duties. I have little to say. I make a mess of things. I am the life of the party I often forget to put things back in
their proper place.
4.3 Correlations Between Mean Ratings on Personal Traits
A Pearson correlation coefficient was computed to assess the relationship between personal traits and aesthetic preference, complexity and familiarity. In terms of aesthetic preference and geometric shape, relationship results show that correlation between low complexity geometric shape and agreeableness trait is positive and significant at the 0,05 significance level (r: 0,139; n: 207; p: 0,046). Low complexity geometric shapes aesthetic preference and conscientiousness trait is positive and significant at the 0,05 significance level (r: 0,139; n: 207; p: 0,046). Correlation between Medium complexity geometric shapes aesthetic preference and
conscientiousness trait is positive and significant at 0,05 significance level (r: 0,160; n: 207; p: 0,022)(See Appendix D, Table D 6).
There is a positive and statistically significant correlation between complexity ratings of low complexity geometric shapes and conscientiousness trait at 0,01 significance level (r: 0,218; n: 207; p: 0,002). There is a positive and statistically significant correlation between complexity ratings of medium complexity geometric shapes and conscientiousness trait at 0,01 significance level (r: 0,196; n: 207; p: 0,005). The correlation between complexity ratings of high complexity geometric shapes and agreeableness trait is positive and statistically significant at 0,05 significance level (r: 0,138; n: 207; p: 0,047)(See Appendix D, Table D 7).
Correlation between low complexity geometric shape familiarity and intellect/ imagination trait is positive and statistically significant at 0,05 significance level (r: 0,140; n: 207; p: 0,044). There is a positive and statistically significant correlation
between medium complexity geometric shape familiarity ratings and
conscientiousness at the significance level of 0,05 (r: 0,137; n: 207; p: 0,049). High complexity geometric shapes familiarity and intellect/ imagination trait have a positive and statistically significant correlation at the 0,001 significance level (r: 0,185; n: 207; p: 0,007) (See Appendix D, Table D 8).
There is a positive and statistically significant correlation between medium
complexity façade preference and intellect/ imagination trait at 0,05 significant level (r: 0,175; n: 207; p: 0,012). Correlation between high complexity façade preference and emotional stability trait is positive and statistically significant at 0,05
significance level (r: 0,146; n: 207; p: 0,035). Also between high complexity façade preference and intellect/ imagination trait, there is a positive and statistically
significant correlation exist at 0,01 significance level (r: 0,238; n: 207; p: 0,001) (See Appendix D, Table D 9).
There are negative correlations between complexity ratings for medium complexity façades and extraversion trait at 0,05 significance level (r: -0,142; n: 207; p: 0,041), and complexity ratings for medium complexity façades and intellect/ imagination trait at 0,05 significance level (r: -0,143; n: 207; p: 0,040) (See Appendix D, Table D 10).
Negative and statistically significant correlation exists at 0,05 significance level between familiarity ratings for low complexity façades and agreeableness trait (r: -0,153; n: 207; p: 0,028). Between conscientiousness trait and familiarity ratings for low complexity façades a negative and statistically significant correlation exists at
0,01 significance level (r: -0,185; n: 207; p: 0,008). The correlation between familiarity ratings for low complexity façades and intellect/ imagination trait is positive and significant at 0,05 significance level (r: 0,165; n: 207; p: 0,017). Familiarity ratings for high complexity façades and conscientiousness trait have a positive and statistically significant correlation at the 0,05 significance level (r: 0,141; n: 207; p: 0,042). There is a positive and statistically significant correlation exist between emotional stability trait and familiarity ratings for high complexity façades at 0,05 significance level (r: 0,156; n: 207; p: 0,025)(See Appendix D, Table D 11).
Previously aesthetic preference, complexity and familiarity scores of respondents had some significant correlations between some of the personal traits, but their
relationships were not strong enough. For that reason a factor analysis conducted and as a result, two new factors created as stability and plasticity. This time correlations between the ratings for aesthetic preference, complexity, and familiarity and these two factors examined.
A Pearson correlation coefficient was computed with these two new factors. In terms of aesthetic preference and geometric shape relationship results shows that
correlation between low complexity geometric shape and stability is positive and significant at the 0.05 significance level (r: .166; n: 207; p: .017) while medium complexity geometric shape and stability is positive and significant at the 0.05 significance level (r: .160; n: 207; p: .021) (See Table 6).
Table 6. Correlation Between Stability, Plasticity and Aesthetic Preference Ratings Plasticity Stability Low Complexity Geometric Shapes Preference Medium Complexity Geometric Shapes Preference High Complexity Geometric Shapes Preference Low Complexity Façades Preference Medium Complexity Façades Preference High Complexity Façades Preference Plasticity 1 .228** .071 .075 .068 .117 .122** .138 Stability .228** 1 .166* .160* .045 -.075** .023 -.075*
Low Complexity Geometric Shapes
Preference .071 .166
* 1 .800** .563** .317** .267** -.030
Medium Complexity Geometric
Shapes Preference .075 .160
* .800** 1 .739** .269** .278** .020
High Complexity Geometric Shapes
Preference .068 .045 .563
** .739** 1 .270** .296** .165*
Low Complexity Façades Preference .117 -.075 .317** .269** .270** 1 .615** .310**
Medium Complexity Façades
Preference .122 .023 .267
** .278** .296** .615** 1 .600**
In terms of complexity ratings for geometric shapes of the respondents and
complexity ratings; a positive and statistically significant correlation found between low complexity geometric shape complexity rating and stability (r: .200; n: 207; p: .004); medium complexity geometric shape complexity rating and stability (r: .193; n: 207; p: .005) at the 0.01 significance level. For high complexity geometric shape complexity and stability a positive and statistically significant relationship found at the 0.05 significance level (r: .137; n: 207; p: .048) (See Appendix D, Table D 12).
A positive and statistically significant correlation found between high complexity façade preference and plasticity at the 0.05 significance level (r: .138; n: 207; p: .048) (see Table 6). There is a negative and statistically significant relationship between medium complexity façade complexity ratings and plasticity at the 0.05 significance level (r: -.178; n: 207; p: .010) (See Appendix D, Table D 13). For the low complexity façade familiarity and stability relationship, a negative and
statistically significant relationship found at the 0.01 significance level (r: -.203; n: 207; p: .003) (See Appendix D, Table D 14).
4.4 Correlations Between Mean Ratings of Age, Aesthetic Preference, Complexity and Familiarity Ratings
A Pearson correlation coefficient was computed to assess the relationship between age and aesthetic preference, complexity and familiarity. In terms of age and aesthetic preference ratings of geometric shapes, relationship results show that correlation is positive and significant at the 0,01 significance level (r: 0,235; n: 207; p: 0,001). In age and complexity ratings of geometric shapes, relationship results
show that correlation is positive and significant at the 0,01 significance level (r: 0,266; n: 207; p: 0,001) (See Appendix D, Table D 15).
When it comes to age and aesthetic preference ratings of building façades, there is a negative and statistically significant relationship exist at the 0,05 significance level (r: -0,165; n: 207; p: 0,017). Correlation between age and familiarity ratings of building façades, the relationship is negative and statistically significant at 0,05 significance level (r: -0,162; n: 207; p: 0,019)(See Appendix D, Table D 15).
4.5 Effect of Gender on Aesthetic Preference, Complexity and Familiarity
As a sixth step, a repeated measures ANOVA test was conducted to understand the effect of gender on aesthetic preference, complexity, and familiarity. Data of the aesthetic preference ratings for geometric shapes were analyzed by repeated
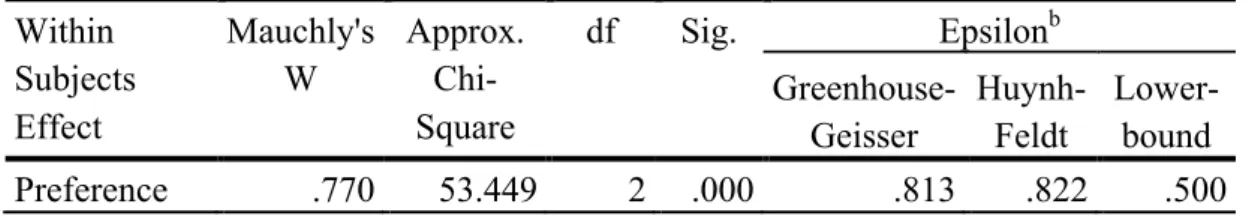
measures ANOVA for 2 (gender) x 2 (profession: designer, other) x 3 (manipulated complexity levels: low, medium, high complexity). First, data were analyzed with a within-subjects factor of aesthetic preference for manipulated complexity of
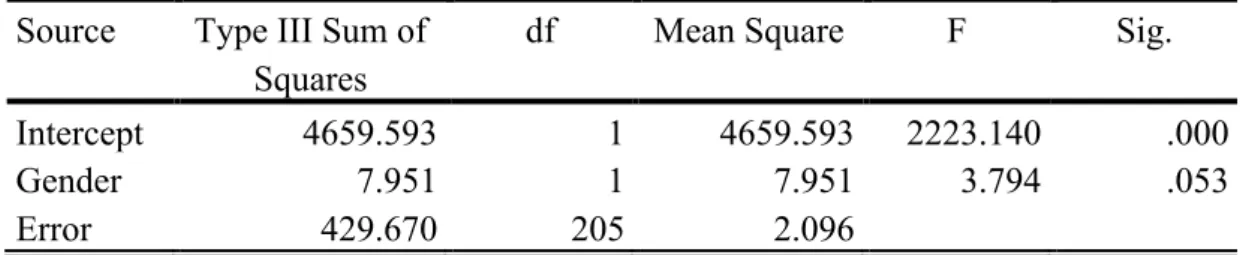
geometric shapes (low, medium, high) and a between-subject factor of gender (men, women). Mauchly’s test indicated that the assumption of sphericity had been violated (x2 (2) : 53.44, p: .0001); therefore degrees of freedom were corrected using
Greenhouse-Geisser estimates of sphericity (ε : 0.813). Main effects of aesthetic preference for complexity, F (1.62, 333.19) : 28.38, p < .001, and gender, F (1, 205) : 3.79, p > .001, were qualified by an interaction between complexity and gender, F (1.62, 333.19) : 0.252, p > .001 (See Appendix D, Table D 16 (a), (b), (c), (d)).
Then, data were analyzed with a within-subjects factor of rated complexity for manipulated complexity of geometric shapes (low, medium, high) and a between-subject factor of gender (men, women). Mauchly’s test indicated that the assumption of sphericity had been violated (x2 (2) : 44.56, p: .0001); therefore degrees of
freedom were corrected using Greenhouse-Geisser estimates of sphericity (ε : 0.836). Main effects of rated complexity for manipulated geometric shapes, F (1.67, 342.74) : 94.5, p < .001, and gender, F (1, 205) : 2.28, p > .001, were qualified by an
interaction between complexity and gender, F (1.67, 342.74) : 0.28, p > .001 (See Appendix D, Table D 17 (a), (b), (c), (d)).
Same data were analyzed to understand gender and familiarity of geometric shape relationship with a within-subjects factor of rated familiarity for manipulated
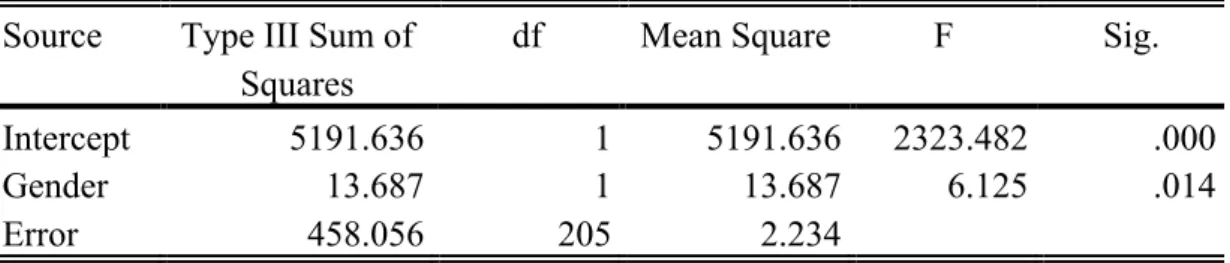
complexity of geometric shapes (low, medium, high) and a between-subject factor of gender (men, women). Mauchly’s test indicated that the assumption of sphericity had been violated (x2 (2) : 23.34, p: .0001); therefore degrees of freedom were corrected using Greenhouse-Geisser estimates of sphericity (ε : 0.902). Main effects of rated familiarity for manipulated geometric shapes, F (1.80, 369.99) : 26.9, p < .001, and gender, F (1, 205) : 6.125, p > .001, were qualified by an interaction between
familiarity and gender, F (1.80, 369.99) : 0.963, p > .001 (See Appendix D, Table D 18 (a), (b), (c), (d)).
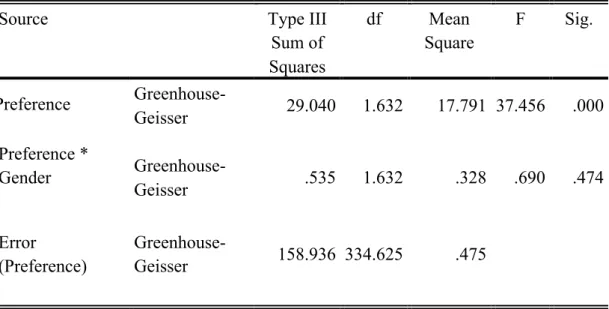
Same analyses were conducted to understand gender and façade relationship. Data were analyzed with a within-subjects factor of aesthetic preference for manipulated complexity of façades (low, medium, high) and a between-subject factor of gender (men, women). Mauchly’s test indicated that the assumption of sphericity had been
violated (x2 (2) : 52.06, p: .0001); therefore degrees of freedom were corrected using Greenhouse-Geisser estimates of sphericity (ε : 0.816). Main effects of aesthetic preference for façades with manipulated complexity, F (1.63, 334.62) : 37.45, p < .001, and gender, F (1, 205) : 0.084, p > .001, were qualified by an interaction
between aesthetic preference for façades and gender, F (1.63, 334.62) : 0.69, p > .001 (See Appendix D, Table D 19 (a), (b), (c), (d)).
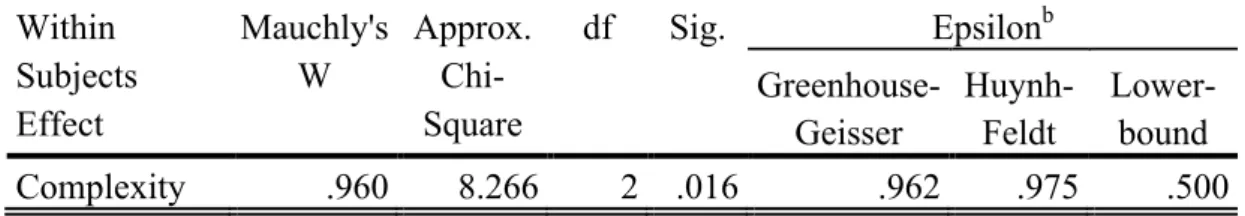
Later, data were analyzed with a within-subjects factor of rated complexity for manipulated complexity of façades (low, medium, high) and a between-subject factor of gender (men, women). Mauchly’s test indicated that the assumption of sphericity had not been violated (x2 (2) : 8.26, p: .016). Main effects of rated complexity for manipulated façades, F (2, 410) : 275.8, p < .001, and gender, F (1, 205) : .161, p > .001, were qualified by an interaction between complexity and gender, F (2, 410) : .147, p > .001 (See Appendix D, Table D 20 (a), (b), (c), (d)).
Data were analyzed to understand gender and familiarity of façades relationship with a within-subjects factor of rated familiarity for manipulated complexity of façades (low, medium, high) and a between-subject factor of gender (men, women).
Mauchly’s test indicated that the assumption of sphericity had been violated (x2 (2) : 81.59, p: .0001); therefore degrees of freedom were corrected using Greenhouse-Geisser estimates of sphericity (ε : 0.752). Main effects of rated familiarity for manipulated façades, F (1.50, 308.35) : 28.7, p < .001, and gender, F (1, 205) : .617, p > .001, were qualified by an interaction between familiarity and gender, F (1.50, 308.35) : 1.163, p > .001 (See Appendix D, Table D 21 (a), (b), (c), (d)).
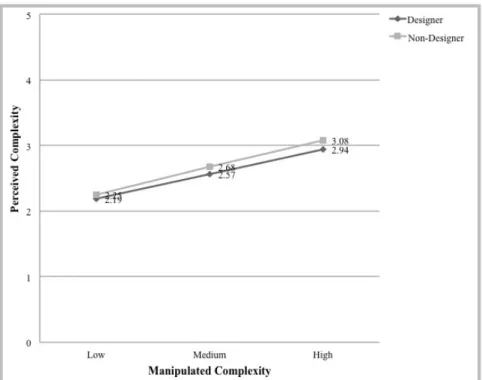
4.6 Effect of Profession on Aesthetic Preference Complexity and Familiarity
To understand the effect of the profession on aesthetic preference, complexity, and familiarity rating data were analyzed with repeated measures ANOVA test. A within-subjects factor of aesthetic preference for manipulated complexity of geometric shapes (low, medium, high) and a between-subject factor of the profession (design, other) was put in the analysis. Mauchly’s test indicated that the assumption of sphericity had been violated (x2 (2) : 54.37, p: .0001); therefore degrees of freedom were corrected using Greenhouse-Geisser estimates of sphericity (ε : 0.810). Main effects of aesthetic preference for geometric shape complexity, F (1.62, 332.25) : 38.11, p < .001, and profession, F (1, 205) : .016, p > .001, were qualified by an interaction between aesthetic preference and profession, F (1.62, 332.25) : 3.86, p > .001 (See Appendix D, Table D 22 (a), (b), (c), (d)).
A within-subjects factor of complexity ratings for manipulated complexity of geometric shapes (low, medium, high) and a between-subject factor of profession (design, other) were put in analysis. Mauchly’s test indicated that the assumption of sphericity had been violated (x2 (2) : 44.70, p: .0001); therefore degrees of freedom were corrected using Greenhouse-Geisser estimates of sphericity (ε : 0.836). Main effects of complexity ratings for geometric shape complexity, F (1.671, 342.58) : 103.20, p < .001, and profession, F (1, 205) : 1.18, p > .001, were qualified by an interaction between complexity and profession, F (1.671, 342.58) : .292, p > .001 (See Appendix D, Table D 23 (a), (b), (c), (d)).