Origin and spread of human
mitochondrial DNA haplogroup U7
Hovhannes Sahakyan
1,2,*, Baharak Hooshiar Kashani
3,†,*, Rakesh Tamang
4,
Alena Kushniarevich
1,5, Amirtharaj Francis
6, Marta D Costa
7,8, Ajai Kumar Pathak
1,9,
Zaruhi Khachatryan
2, Indu Sharma
10, Mannis van Oven
11, Jüri Parik
1,9, Hrant Hovhannisyan
2,12,
Ene Metspalu
1,9, Erwan Pennarun
1, Monika Karmin
1, Erika Tamm
1,9, Kristiina Tambets
1,
Ardeshir Bahmanimehr
2,‡, Tuuli Reisberg
1,9, Maere Reidla
1,9, Alessandro Achilli
3, Anna Olivieri
3,
Francesca Gandini
3,$, Ugo A. Perego
3, Nadia Al-Zahery
3, Massoud Houshmand
13,
Mohammad Hossein Sanati
13, Pedro Soares
8,14, Ekta Rai
10, Jelena Šarac
1,15, Tena Šarić
1,15,
Varun Sharma
10, Luisa Pereira
8,16, Veronica Fernandes
7,8,16, Viktor Černý
17, Shirin Farjadian
18,
Deepankar Pratap Singh
6, Hülya Azakli
19, Duran Üstek
20, Natalia Ekomasova
(Trofimova)
1,21,22, Ildus Kutuev
1,21, Sergei Litvinov
1,21, Marina Bermisheva
21,
Elza K. Khusnutdinova
21,22, Niraj Rai
6, Manvendra Singh
6, Vijay Kumar Singh
6, Alla G. Reddy
6,
Helle-Viivi Tolk
1, Svjetlana Cvjetan
15,23,24, Lovorka Barac Lauc
15,25, Pavao Rudan
15,26,
Emmanuel N. Michalodimitrakis
27, Nicholas P. Anagnou
28,29, Kalliopi I. Pappa
29,30,
Maria V. Golubenko
31, Vladimir Orekhov
32, Svetlana A Borinskaya
32, Katrin Kaldma
1,#,
Monica A. Schauer
33, Maya Simionescu
33, Vladislava Gusar
34,§, Elena Grechanina
34,
Periyasamy Govindaraj
6, Mikhail Voevoda
35,36,37, Larissa Damba
35, Swarkar Sharma
10,
Lalji Singh
6,¶, Ornella Semino
3, Doron M. Behar
1,38, Levon Yepiskoposyan
2,
Martin B. Richards
7,39, Mait Metspalu
1, Toomas Kivisild
1,9,40, Kumarasamy Thangaraj
6,
Phillip Endicott
41, Gyaneshwer Chaubey
1, Antonio Torroni
3& Richard Villems
1,9,421Evolutionary Biology Group, Estonian Biocentre, Tartu 51010, Estonia. 2Laboratory of Ethnogenomics, Institute
of Molecular Biology of National Academy of Sciences, Yerevan 0014, Armenia. 3Dipartimento di Biologia e
Biotecnologie “L. Spallanzani”, Università di Pavia, Pavia 27100, Italy. 4Department of Zoology, University of
Calcutta, Kolkata 700 019, India. 5Institute of Genetics and Cytology, National Academy of Sciences, Minsk 220072,
Belarus. 6CSIR-Centre for Cellular and Molecular Biology, Hyderabad 500 007, India. 7Faculty of Biological Sciences,
University of Leeds, Leeds LS2 9JT, UK. 8Instituto de Patologia e Imunologia Molecular da Universidade do Porto
(IPATIMUP), Porto 4200-135, Portugal. 9Department of Evolutionary Biology, Institute of Molecular and Cell Biology,
University of Tartu, Tartu 51010, Estonia. 10Human Genetics Research Group, Department of Biotechnology, Shri
Mata Vaishno Devi University, Katra 182320, India. 11Utrecht 3523 GN, The Netherlands. 12Russian-Armenian
University, Yerevan 0051, Armenia. 13Department of Medical Genetics, National Institute of Genetic Engineering
and Biotechnology, Tehran 14965/161, Iran. 14Departamento de Biologia, CBMA (Centro de Biologia Molecular e
Ambiental), Universidade do Minho, Braga 4710-057, Portugal. 15Institute for Anthropological Research, Zagreb
10000, Croatia. 16Instituto de Investigação e Inovação em Saúde, Universidade do Porto (i3S), Porto 4200-135,
Portugal. 17Department of Anthropology and Human Genetics, Faculty of Science, Charles University, Prague
128-43, Czech Republic. 18Department of Immunology, Allergy Research Center, Shiraz University of Medical Sciences,
Shiraz 71348-45794, Iran. 19Genetic Department, Institute of Experimental Medicine, Istanbul University, Istanbul
33326, Turkey. 20Department of Medical Genetics and REMER, Faculty of Medicine, Medipol University, Istanbul,
34810 Turkey. 21Institute of Biochemistry and Genetics, Ufa Scientific Center of the Russian Academy of Sciences, Ufa
450054, Russia. 22Department of Genetics and Fundamental Medicine of Bashkir State University, Ufa 450076, Russia. 23Department of Molecular Biology, Ruđer Bošković Institute, Zagreb 10000, Croatia. 24Mediterranean Institute for
Life Sciences, Split 21000, Croatia. 25Croatian Science Foundation, Zagreb 10000, Croatia. 26Anthropological Centre
of the Croatian Academy of Sciences and Arts, 10000 Zagreb, Croatia. 27Department of Forensic Sciences and
Toxicology, University of Crete, School of Medicine, Heraklion 71110, Greece. 28Laboratory of Biology, University of
Athens, School of Medicine, Athens 115 27, Greece. 29Foundation for Biomedical Research of the Academy of Athens
(IIBEAA), Athens 115 27, Greece. 30First Department of Obstetrics and Gynecology, University of Athens, School of
Medicine, Athens 115 27, Greece. 31Research Institute of Medical Genetics, Tomsk National Research Medical Center
of the Russian Academy of Sciences, Tomsk 634050, Russia. 32Vavilov Institute of General Genetics, Russian Academy
Received: 01 December 2016 Accepted: 07 March 2017 Published: 07 April 2017
www.nature.com/scientificreports/
Human mitochondrial DNA haplogroup U is among the initial maternal founders in Southwest Asia and Europe and one that best indicates matrilineal genetic continuity between late Pleistocene hunter-gatherer groups and present-day populations of Europe. While most haplogroup U subclades are older than 30 thousand years, the comparatively recent coalescence time of the extant variation of haplogroup U7 (~16–19 thousand years ago) suggests that its current distribution is the consequence of more recent dispersal events, despite its wide geographical range across Europe, the Near East and South Asia. Here we report 267 new U7 mitogenomes that – analysed alongside 100 published ones – enable us to discern at least two distinct temporal phases of dispersal, both of which most likely emanated from the Near East. The earlier one began prior to the Holocene (~11.5 thousand years ago) towards South Asia, while the later dispersal took place more recently towards Mediterranean Europe during the Neolithic (~8 thousand years ago). These findings imply that the carriers of haplogroup U7 spread to South Asia and Europe before the suggested Bronze Age expansion of Indo-European languages from the Pontic-Caspian Steppe region.
Ancient DNA (aDNA) studies in the last decade or so have substantially broadened our knowledge of prehis-toric human demography, revealing major population turnovers in Europe during the Holocene1–3 and the late
Pleistocene4,5. Out of two pan-Eurasian mitochondrial DNA (mtDNA) founder lineages (M and N)6, the majority
of contemporary Europeans and Southwest Asians cluster into macro-haplogroup N (including its major sub-clade R)7,8. Haplogroup (hg) U – a sub-branch of hg R – shows a wide distribution in both regions. Its Upper
Palaeolithic presence in Europe was initially recognized on the basis of modern-day population data7,9,10, and
confirmed by aDNA studies, which revealed that various subclades of hg U encompassed the vast majority of European mitogenomes during the Palaeolithic and Mesolithic, and that most of the other (non-U) mtDNA lineages appeared only later in the Holocene1,2,4,5. On the other hand, phylogeographic surveys of modern
mitog-enomes of hgs I, W, J and T have identified signals of Late Glacial/postglacial expansions from the Near East to Europe, thus implying that the presence in Europe of these Near Eastern haplogroups predated the Neolithic11–13,
but these haplogroups have not been detected so far in pre-Neolithic human remains.
Hg U is subdivided into U1, U5, U6, and a fourth subclade, which further divides into U2, U3, U4′ 9, U7, and U8 (including hg K). Many of these U subclades display region-specific frequency patterns in present-day populations: hgs U1 and U3 are largely restricted to the Near East14–16, U4 and U5 to Europe7,9,17,18, U6 to the
circum-Mediterranean region, with a frequency peak in North Africa19–21, while U8 is more prevalent in the Near
East and Europe7,22–25 and U9 is rare with only sporadic occurrences in Arabia, Ethiopia and India26,27. Hg U2
harbours frequency and diversity peaks in South Asia, whereas its subclades U2d and U2e are confined to the Near East and Europe25,28–30.
Compared to other subclades of hg U, both the phylogenetic structure and the ancestral origin of hg U7 are rather obscure. This haplogroup is characterized by generally low population frequencies and limited sequence diversity, despite a geographic distribution ranging from Europe to India14,16,25,27,30–33. Recently, it has been
detected in skeletal remains from Southwest Iran dated ~six thousand years ago (kya)34 as well as in remains from
the Tarim Basin in Northwest China (3.5–4.0 kya)35.
It has been previously shown that low-frequency mitochondrial haplogroups with relict distributions, similar to hg U7, can be disproportionately informative about ancient human dispersal events36–38. Although, mtDNA
itself, as a single locus, often does not reflect the whole complexity of past demographic processes39–42, detailed
phylogenies and phylogeographic surveys based on a large number of thoroughly collected and sequenced mitog-enomes might provide unique insights on gender-specific gene flows, not always obvious from genome-wide studies, and on contrasting patterns of patri- and matrilineal heritage, as well as reliable time estimates. To eval-uate whether high-resolution phylogeographic data from hg U7 could provide new clues on the prehistory and ancestral origins of the modern-day populations that currently harbour this haplogroup, we first assembled a large number (1141) of control-region sequences (Supplementary Table S1) and then sequenced 267 U7 mitoge-nomes from its entire distribution range.
of Sciences, Moscow 119333, Russia. 33Institute of Cellular Biology and Pathology “Nicolae Simionescu”, Bucharest
PO Box 35-14, Romania. 34Kharkiv Specialized Medical Genetic Centre (KSMGC), Kharkiv 61022, Ukraine. 35Institute
of Internal and Preventive Medicine, SB RAS, Novosibirsk 630089, Russia. 36Institute of Cytology and Genetics SB
RAS, Novosibirsk 630090, Russia. 37Novosibirsk State University, Novosibirsk 630090, Russia. 38Clalit National
Cancer Control and Personalized Medicine Program, Carmel Medical Center, Haifa 3436212, Israel. 39Department of
Biological Sciences, School of Applied Sciences, University of Huddersfield, Huddersfield HD1 3DH, United Kingdom.
40Department of Archaeology and Anthropology, University of Cambridge, Cambridge CB2 1QH, United Kingdom. 41Musée de l’Homme, Paris 75116, France. 42Estonian Academy of Sciences, Tallinn 10130, Estonia. †Present
address: Institute for Medical Immunology, Université Libre de Bruxelles, Gosselies B-6041, Belgium. ‡Present
address: Thalassemia and Haemophilia Genetic PND Research Center, Dastgheib Hospital, Shiraz University of Medical Sciences, Shiraz 71456–83769, Iran. $Present address: Department of Biological Sciences, School of Applied
Sciences, University of Huddersfield, Huddersfield HD1 3DH, United Kingdom. #Present address: Department of
Zoology, Institute of Agricultural and Environmental Sciences, Estonian University of Life Sciences, Tartu 51014, Estonia. §Present address: Research Center for Obstetrics, Gynecology and Perinatology, Moscow 117997, Russia. ¶Present address: Genome Foundation, Hyderabad 500 076, India. *These authors contributed equally to this work.
Results and Discussion
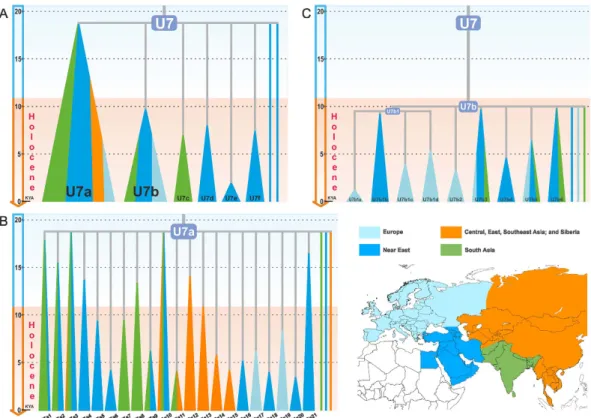
The maximum-parsimony reconstruction of 367 sequences of hg U7 yielded a tree with a basal hard polytomy that cannot be resolved (to a dichotomous one) at the level of whole-mtDNA sequence data: we identified eight independent branches that coalesce at the root of U7 (Fig. 1A and Supplementary Figure S1). Consistent with pre-vious studies, we found that three major branches, U7a–c, capture most (96%) of the U7 mitogenomes. Besides these three previously known branches, we identified three additional clades, hereby designated as U7d, U7e, and U7f (Table 1). These were exclusively seen in Iran and the Caucasus. Finally, two mitogenomes – also from Iran and the Caucasus – did not cluster with any of hgs U7a–f and remained as unlabelled single lineages.
In agreement with previous observations16, U7c appears to be restricted to South Asia (Fig. 1A and
Supplementary Figure S1). In contrast, U7a is the dominant branch of U7 throughout the Near East and South Asia with subclades specific to Central Asia (U7a12–15), Mediterranean and Southeast Europe (U7a17 and U7a19; Figs 1B and 2B, Supplementary Figure S1). U7b exhibits a higher frequency than U7a in Europe with elevated levels of diversity in the Mediterranean and southeastern regions (Figs 1C and 2C and Supplementary Figure S1). It is distributed also in the Near East, South and Central Asia.
We estimated a coalescence time for hg U7 at ~15.6–18.6 kya (Table 1), in agreement with previous maximum-likelihood estimates31. This confirms that U7 is the youngest major clade within the macro-hg U
and the only one with the most recent common ancestor after the Last Glacial Maximum (LGM), presumably resulting from a severe glacial bottleneck. All other hg U subclades (U1, U2, U3, U4′ 9, U5, U6, and U8) display considerably older ages (~30–43 kya)31. This loss of genetic diversity of the ancestral U lineage, which eventually
led to the formation of hg U7 is consistent with the survival of a small number of founders during the LGM; a pattern similar to that observed for mtDNA hgs N1a3 (previously N1c), N3, W, R2, HV, and within hgs M1 and U611,16,20,21,43–45.
The hg U7 Bayesian skyline analysis (Fig. 3) shows a clear signal for an overall demographic expansion after the LGM. U7a drives the early stages of this demographic expansion, whereas the signal for U7b (the predomi-nantly European subclade of hg U7) occurs much later, ~8–5 kya (Table 1 and Fig. 3). The subclades of U7a that are common in the Near East and South Asia (U7a1, U7a2, U7a3, and U7a10) are characterized by coalescence dates and a growth phase prior to the Holocene (Supplementary Figure S1 and Supplementary Table S4). Among those, U7a3 is both the oldest (~19 kya) and most frequent throughout these two areas, whilst U7a1, U7a2 and U7a10 are older than 12 kya. Clades U7a2, U7a3 and U7a10 have individual components, specific to the Near East and South Asia, suggesting that U7a was already differentiated in both regions by the end of the Pleistocene.
Central Asia has four regionally specific clades (U7a12–15), whilst U7a11 is shared with South Asia (Fig. 1B and Supplementary Figure S1). U7 is distributed unevenly in Central Asia; it is most frequent in its southern
Figure 1. Schematic Representations of the U7, U7a and U7b Phylogenies. Subclades are represented by
triangles, while single lineages are represented by lines. Subclades and single linage lines are colored according to their geographic origin, as shown in the map (lower right corner). (A) U7 tree. (B) U7a tree. (C) U7b tree. KYA – thousand years ago. Map was generated with Surfer program (version 8, Golden Software, Inc., Golden, CO, USA, https://www.goldensoftware.com/).
www.nature.com/scientificreports/
areas adjacent to the Near East and South Asia (Fig. 2), with Afghanistan forming a “buffer zone”. Despite this geographical proximity, there are very few instances of shared lineages among the three regions, which, combined with the early coalescence date for U7a12 (~12 kya) (Supplementary Table S4), is consistent with a regional dif-ferentiation prior to the Holocene.
In contrast to U7a, U7b shows signs of a significantly (t-test p < 0.001) later expansion and is characterized by low frequencies in the Near East, South Asia, and Central Asia, while it has a higher frequency in Europe (Table 1, Supplementary Tables S3 and S4). This differentiation is also reflected in the number of U7b sub-clades that are restricted to Europe – four out of nine subsub-clades identified in the current phylogeny (Fig. 1C and Supplementary Figure S1). In addition, many single lineages (eight out of eighteen) in U7b are from Europe. The major sub-branches of U7b are characterized by star-like radiations and growth ~8–5 kya (Fig. 3). Subclades U7b1c and U7b1d, which are exclusive to Europe, expanded ~5 kya (Supplementary Figure S1). Hence, we con-sider this time as a minimum age for the presence of U7b in Europe. Taking into account the U7b coalescence age in Europe (Table 1), we think that U7b may have appeared there between 5 and 10 kya. This timeframe overlaps significantly with the time of the Neolithic demographic transition in Europe.
Expansions within this timeframe are also observed for the European-specific clades U7a17 and U7a19, whose distributions are centred on Mediterranean and Southeast Europe, along one of the preferred routes for the initial dispersal of farming46–49. Elevated frequencies in the Mediterranean area are also witnessed for many
subsets of U7b (Fig. 2C), and the age of U7b in Europe (5–10 kya) is incompatible with its presence there prior to the Holocene. To date, aDNA studies have not found any example of U7 in either Neolithic or pre-Neolithic contexts1,4,5,50–58. In contrast, other clades of hg U were common during the postglacial re-expansion period,
including U8a, which is extremely rare today24. However, the number of analysed ancient samples from the
Mediterranean area, where U7b has elevated frequencies today, is still rather small.
The reduction in frequency of U7 in Europe from south to north is mirrored by the main components of hg K (a sister clade of U8b1). These have also been argued to have arrived into Europe during the early Neolithic from the Near East2,59–61, and display a clear northward frequency cline23,62. According to aDNA evidence, Neolithic
populations in Europe display a distinct mtDNA lineage make-up, argued to be derived from Near Eastern sou rces1,5,50–52,55–58,63. This early colonisation was probably followed by a complex process of assimilation of
autoch-thonous hunter-gatherer diversity, seen most clearly in the autosomes. Notably, the distribution of nuclear genetic variants from Neolithic migrants among modern-day European populations3,55,64–71 resembles the
phylogeogra-phy of hg U7 in Europe today.
Another major episode of gene flow affecting the European gene pool appears to have occurred during the Late Neolithic and Early Bronze Age, from a source in the Pontic-Caspian Steppe region north of the Caucasus3,54,66,72.
It has been suggested that this migration resulted in a further substantial shift in the genetic profile of Europeans and was a major vehicle for the movement of Indo-European languages to Europe3,72, and likely also to South
Asia54. Interestingly, the autosomal genetic component in Europeans considered to derive from the Steppe is
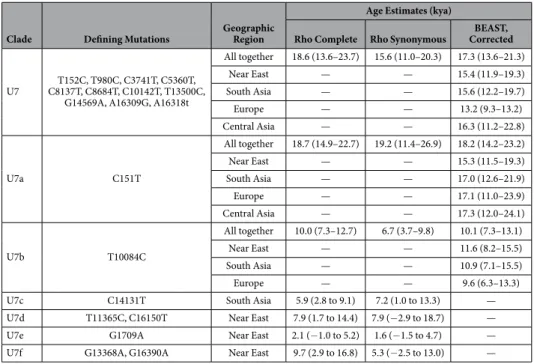
Clade Defining Mutations Geographic Region
Age Estimates (kya)
Rho Complete Rho Synonymous CorrectedBEAST,
U7 C8137T, C8684T, C10142T, T13500C, T152C, T980C, C3741T, C5360T, G14569A, A16309G, A16318t
All together 18.6 (13.6–23.7) 15.6 (11.0–20.3) 17.3 (13.6–21.3) Near East — — 15.4 (11.9–19.3) South Asia — — 15.6 (12.2–19.7) Europe — — 13.2 (9.3–13.2) Central Asia — — 16.3 (11.2–22.8) U7a C151T All together 18.7 (14.9–22.7) 19.2 (11.4–26.9) 18.2 (14.2–23.2) Near East — — 15.3 (11.5–19.3) South Asia — — 17.0 (12.6–21.9) Europe — — 17.1 (11.0–23.9) Central Asia — — 17.3 (12.0–24.1) U7b T10084C All together 10.0 (7.3–12.7) 6.7 (3.7–9.8) 10.1 (7.3–13.1) Near East — — 11.6 (8.2–15.5) South Asia — — 10.9 (7.1–15.5) Europe — — 9.6 (6.3–13.3) U7c C14131T South Asia 5.9 (2.8 to 9.1) 7.2 (1.0 to 13.3) — U7d T11365C, C16150T Near East 7.9 (1.7 to 14.4) 7.9 (− 2.9 to 18.7) — U7e G1709A Near East 2.1 (− 1.0 to 5.2) 1.6 (− 1.5 to 4.7) — U7f G13368A, G16390A Near East 9.7 (2.9 to 16.8) 5.3 (− 2.5 to 13.0) —
Table 1. Age Estimates, Defining Mutations, and Distribution Ranges of Haplogroup U7 and Its
Subclades. Mutations were scored relative to the root of haplogroup U. Coalescence times were estimated with
three methods – ρ whole-mtDNA clock, ρ synonymous clock, and Bayesian estimation. They are expressed in thousand years ago. 95% confidence intervals for ρ -based estimates as well as 95% HPD intervals for BEAST estimates are given in parentheses. For U7, U7a, and U7b Bayesian analyses were carried out also with region-specific sequences.
almost fixed in two pre-Neolithic ancient genomes from the South Caucasus. This component is distributed east-wards toeast-wards South Asia as well54, where it mimics the distribution of U7 (Pearson’s r = 0.65, p = 0.01). Our time
estimates for the expansion and differentiation of hg U7 in the Near East, Central Asia, South Asia, and Europe, however, predate these putative late Neolithic-early Bronze Age migrations and thereby rule them out as a major vehicle for the spread of U7 to Europe and South Asia. In this respect, it is also noteworthy that Yamnaya herders of the Steppe so far analysed (n = 43) show no traces of U73,55,72,73 – and U7 is rarely found in this region today
(Fig. 2).
The expansion time of hg U7 in the Near East, Central Asia and South Asia is more consistent with autosomal multi-locus estimates for the genetic separation of these regions during the Terminal Pleistocene74, suggesting
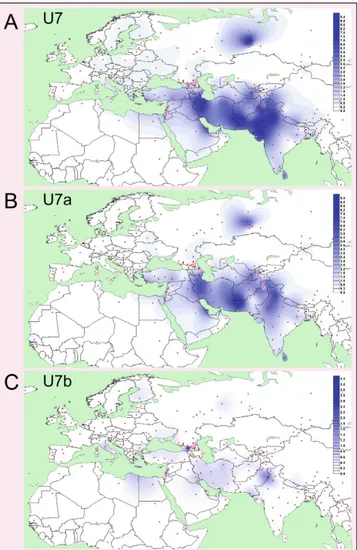
a common demographic process, whose origin was unclear previously. Here, we show that the frequency and distribution of U7b lineages indicate an origin of this clade in the Near East, whilst for U7a these statistics cannot differentiate between South Asia and the Near East (including the Caucasus) as a possible homeland. Within the Near East hg U7 is most frequent and diverse in Iran, whilst in South Asia its frequency and diversity peaks are in the Indus Valley region (Fig. 2 and Supplementary Figure S1). The demographic histories of the Near East and South Asia show marked differences during the LGM with the latter being less affected75. This is consistent with
the long-term high effective population size and deep structure of autochthonous mtDNA haplogroups in South Asia76–78, in striking contrast to the severe population reduction affecting hg U7 during the last glacial period.
Conversely, hg U2 in South Asia dates to more than 35 kya31, indicating its presence prior to the LGM. Moreover,
other haploid (Y chromosomal hg J2)79 and diploid80,81 genetic markers provide support for a post-glacial
disper-sal from the Near East to South Asia before the Bronze Age. Interestingly, recent aDNA studies have revealed a significant shared ancestry between Neolithic populations from the Zagros Mountains in Iran and contemporary populations from South Asia, suggesting eastward migration of people from that region to South Asia already at least in the Neolithic timeframe34,82.
Figure 2. Spatial Frequency Distribution Maps of Haplogroups U7, U7a and U7b. Dots indicate the
geographical locations of the surveyed populations. Population frequencies (%) correspond to those listed in Supplementary Table S3. Note the different frequency scales used in different maps. Maps were generated with Surfer program (version 8, Golden Software, Inc., Golden, CO, USA, https://www.goldensoftware.com/).
www.nature.com/scientificreports/
In conclusion, the Near East is the most likely ancestral homeland of U7. Our analyses reveal two temporally and geographically distinct signals of U7 expansion that disseminated from this region. The first signal dates shortly after the LGM and this dispersal is responsible for the spread of U7 towards South and Central Asia prior to the Holocene, while the more recent expansion explains its spread in Mediterranean Europe most probably during the early Holocene. These dispersals of hg U7 towards South Asia and Europe preclude any major asso-ciation of U7 with the putative Bronze Age expansion of the Indo-European language family to these regions.
Materials and Methods
The sampling encompassed the Near East, South Asia, Europe and Central Asia (Supplementary Table S2). For the purposes of this study, both Near East and Southwest Asia refer to the territory that includes the Levant, Anatolia, Caucasus, Iraq, Iran, Arabia, and Lower Egypt. U7 samples were selected from mtDNA databases of the research groups involved in this study. Blood specimens were collected from healthy unrelated adult individuals whose matrilineal ancestors for at least two generations belonged to the populations reported here. Informed consent was obtained from all participants in the study. All experimental procedures were carried out in accordance with the approved guidelines by the Research Ethics Committee of the University of Tartu and the Ethic Committee for Clinical Experimentation of the University of Pavia. All experimental protocols were approved by the Research Ethics Committee of the University of Tartu (252/M-17) and the Ethic Committee for Clinical Experimentation of the University of Pavia (Board minutes of the October 5, 2010). The mitogenome sequencing was carried out fol-lowing published protocols83,84. Mutations were scored relative to the Reconstructed Sapiens Reference Sequence
(RSRS)31 and the Revised Cambridge Reference Sequence (rCRS)85,86. For these tasks as well as for sequence
alignments the following software packages were used – ChromasPro (Technelysium Pty Ltd, South Brisbane QLD 4101, Australia), mtDNACommunity31, and BioEdit87. A maximum-parsimony tree was constructed using a
total of 367 hg U7 mitogenomes (267 new from this study and 100 from the literature), guided by published prin-ciples88 (Supplementary Figure S1 and Supplementary Table S2). In addition, the control region and/or
phyloge-netically informative markers from the coding region were sequenced for 229 samples (Supplementary Table S1). This, together with the re-constructed high-resolution phylogeny, has allowed us to assign into major branches almost 85% of all U7 samples available from the literature and our collection (Supplementary Table S1). Spatial frequency maps were generated with Surfer program (version 8, Golden Software, Inc., Golden, CO, USA), fol-lowing the Kriging algorithm (input data is represented in Supplementary Table S3). Coalescence times were calculated using the rho (ρ ) statistic89 and standard deviations90. Genetic distances were calculated with both the
complete and synonymous clock models and converted into years using the published calculator91. We used this
mutation rate and the calculator because of the evidence of nonlinearity in human mtDNA mutation rate, and the necessity for correction of time estimates for purifying selection91,92. Coalescence time estimates were also
com-puted with the Bayesian MCMC approach implemented in the BEAST v1.7.5 suite of software93, using five
parti-tions of the mtDNA genome: control region, tRNA plus rRNA regions, first, second, and third posiparti-tions of codons
Figure 3. Bayesian Skyline Plots of Haplogroups U7, U7a and U7b. The solid line is the median estimate,
while dashed lines show the 95% highest posterior density (HPD) limits. Means (filled circles) and HPD intervals (pipes) for coalescence times are provided in the figure with corresponding colors. Ne: effective
in the protein coding regions. Good convergence was achieved by applying the HKY94 and strict clock models95;
hence all Bayesian analyses in this study were carried out using these models. A Bayesian skyline model was used as the tree model96. An average value (1.6865E-8 substitutions/site/year) of two published whole-mtDNA
muta-tion rates (1.665E-8 and 1.708E-8)91 was used as a prior in the analyses. Some of the BEAST runs were carried
out in the CIPRES public resource97. Bayesian skyline analyses were carried out with Tracer software v1.6. As the
BEAST v1.7.5 software assumes a linear mutation rate, we corrected time estimates obtained from BEAST v1.7.5 analyses as well as for the Bayesian skyline plots by the published formula91. Updated skyline plots were generated
using the R software (the R project) with the basic packages.
References
1. Bramanti, B. et al. Genetic discontinuity between local hunter-gatherers and central Europe’s first farmers. Science 326, 137–140 (2009).
2. Brandt, G. et al. Ancient DNA reveals key stages in the formation of central European mitochondrial genetic diversity. Science 342, 257–261 (2013).
3. Haak, W. et al. Massive migration from the steppe was a source for Indo-European languages in Europe. Nature 522, 207–211 (2015).
4. Fu, Q. et al. The genetic history of Ice Age Europe. Nature 534, 200–205 (2016).
5. Posth, C. et al. Pleistocene mitochondrial genomes suggest a single major dispersal of non-Africans and a Late Glacial population turnover in Europe. Curr. Biol. 26, 827–833 (2016).
6. Behar, D. M. et al. The dawn of human matrilineal diversity. Am. J. Hum. Genet. 82, 1130–1140 (2008).
7. Richards, M. et al. Tracing European founder lineages in the Near Eastern mtDNA pool. Am. J. Hum. Genet. 67, 1251–1276 (2000). 8. Torroni, A. et al. Classification of European mtDNAs from an analysis of three European populations. Genetics 144, 1835–1850
(1996).
9. Malyarchuk, B. et al. The peopling of Europe from the mitochondrial haplogroup U5 perspective. PLoS One 5, e10285 (2010). 10. Soares, P. et al. The archaeogenetics of Europe. Curr. Biol. 20, R174–R183 (2010).
11. Olivieri, A. et al. Mitogenomes from two uncommon haplogroups mark Late Glacial/Postglacial expansions from the Near East and Neolithic dispersals within Europe. PLoS One 8, e70492 (2013).
12. Pala, M. et al. Mitochondrial DNA signals of late glacial recolonization of Europe from Near Eastern refugia. Am. J. Hum. Genet. 90, 915–924 (2012).
13. Richards, M. B., Soares, P. & Torroni, A. Palaeogenomics: Mitogenomes and migrations in Europe’s past. Curr. Biol. 26, R243–R246 (2016).
14. Al-Zahery, N. et al. Y-chromosome and mtDNA polymorphisms in Iraq, a crossroad of the early human dispersal and of post-Neolithic migrations. Mol. Phylogenet. Evol. 28, 458–472 (2003).
15. Al-Zahery, N. et al. In search of the genetic footprints of Sumerians: a survey of Y-chromosome and mtDNA variation in the Marsh Arabs of Iraq. BMC Evol. Biol. 11, 288 (2011).
16. Derenko, M. et al. Complete mitochondrial DNA diversity in Iranians. PLoS One 8, e80673 (2013).
17. Achilli, A. et al. Saami and Berbers—an unexpected mitochondrial DNA link. Am. J. Hum. Genet. 76, 883–886 (2005). 18. Malyarchuk, B. et al. Mitochondrial DNA phylogeny in Eastern and Western Slavs. Mol. Biol. Evol. 25, 1651–1658 (2008a). 19. Olivieri, A. et al. The mtDNA legacy of the Levantine early Upper Palaeolithic in Africa. Science 314, 1767–1770 (2006).
20. Pennarun, E. et al. Divorcing the Late Upper Palaeolithic demographic histories of mtDNA haplogroups M1 and U6 in Africa. BMC
Evol. Biol. 12, 234 (2012).
21. Secher, B. et al. The history of the North African mitochondrial DNA haplogroup U6 gene flow into the African, Eurasian and American continents. BMC Evol. Biol. 14, 109 (2014).
22. Badro, D. A. et al. Y-chromosome and mtDNA genetics reveal significant contrasts in affinities of modern Middle Eastern populations with European and African populations. PLoS One 8, e54616 (2013).
23. Costa, M. D. et al. A substantial prehistoric European ancestry amongst Ashkenazi maternal lineages. Nat. Commun. 4, 2543 (2013). 24. González, A. M., García, O., Larruga, J. M. & Cabrera, V. M. The mitochondrial lineage U8a reveals a Paleolithic settlement in the
Basque country. BMC Genomics 7, 124 (2006).
25. Quintana-Murci, L. et al. Where West meets East: The complex mtDNA landscape of the Southwest and Central Asian corridor. Am.
J. Hum. Genet. 74, 827–845 (2004).
26. Abu-Amero, K. K., González, A. M., Larruga, J. M., Bosley, T. M. & Cabrera, V. M. Eurasian and African mitochondrial DNA influences in the Saudi Arabian population. BMC Evol. Biol. 7, 32 (2007).
27. Fornarino, S. et al. Mitochondrial and Y-chromosome diversity of the Tharus (Nepal): a reservoir of genetic variation. BMC Evol.
Biol. 9, 154 (2009).
28. Kivisild, T. et al. Deep common ancestry of Indian and western-Eurasian mitochondrial DNA lineages. Curr. Biol. 9, 1331–1334 (1999).
29. Malyarchuk, B., Derenko, M., Perkova, M. & Vanecek, T. Mitochondrial haplogroup U2d phylogeny and distribution. Hum. Biol. 80, 565–571 (2008b).
30. Metspalu, M. et al. Most of the extant mtDNA boundaries in South and Southwest Asia were likely shaped during the initial settlement of Eurasia by anatomically modern humans. BMC Genet. 5, 26 (2004).
31. Behar, D. M. et al. A ‘Copernican’ reassessment of the human mitochondrial DNA tree from its root. Am. J. Hum. Genet. 90, 675–684 (2012).
32. Brisighelli, F. et al. The Etruscan timeline: a recent Anatolian connection. Eur. J. Hum. Genet. 17, 693–696 (2009).
33. Palanichamy, M. G. et al. West Eurasian mtDNA lineages in India: an insight into the spread of the Dravidian language and the origins of the caste system. Hum. Genet. 134, 637–647 (2015).
34. Lazaridis, I. et al. Genomic insights into the origin of farming in the ancient Near East. Nature 536, 419–424 (2016).
35. Li, C. et al. Analysis of ancient human mitochondrial DNA from the Xiaohe cemetery: insights into prehistoric population movements in the Tarim Basin, China. BMC Genet. 16, 78 (2015).
36. Gandini, F. et al. Mapping human dispersals into the Horn of Africa from Arabian Ice Age refugia using mitogenomes. Sci. Rep. 6, 25472 (2016).
37. Haak, W. et al. Ancient DNA from the first European farmers in 7500-year-old Neolithic sites. Science 310, 1016–1018 (2005). 38. Perego, U. A. et al. Distinctive Paleo-Indian migration routes from Beringia marked by two rare mtDNA haplogroups. Curr. Biol. 19,
1–8 (2009).
39. Beaumont, M. A. et al. In defence of model-based inference in phylogeography. Mol. Ecol. 19, 436–446 (2010).
40. Gerbault, P. & Thomas, M. G. In James D. Wright, International Encyclopedia of the Social & Behavioral Sciences 11, 289–296 (Elsevier, 2015).
41. Groucutt, H. S. et al. Rethinking the dispersal of Homo sapiens out of Africa. Evol. Anthropol. Issues News Rev. 24, 149–164 (2015). 42. Kivisild, T. Maternal ancestry and population history from whole mitochondrial genomes. Investig. Genet. 6, 3 (2015).
www.nature.com/scientificreports/
43. De Fanti, S. et al. Fine dissection of human mitochondrial DNA haplogroup HV lineages reveals Paleolithic signatures from European glacial refugia. PLoS One 10, e0144391 (2015).
44. Fernandes, V. et al. The Arabian cradle: Mitochondrial relicts of the first steps along the southern route out of Africa. Am. J. Hum.
Genet. 90, 347–355 (2012).
45. Kushniarevich, A. et al. Uniparental genetic heritage of Belarusians: Encounter of rare Middle Eastern matrilineages with a central European mitochondrial DNA pool. PLoS One 8, e66499 (2013).
46. Gronenborn, D. A variation on a basic theme: The transition to farming in southern central Europe. J. World Prehistory 13, 123–210 (1999).
47. Price, T. D. Europe’s first farmers. (Cambridge University press, 2000).
48. Rowley-Conwy, P. Westward Ho!: The spread of agriculture from Central Europe to the Atlantic. Curr. Anthropol. 52, S431–S451 (2011).
49. Zilhão, J. Radiocarbon evidence for maritime pioneer colonization at the origins of farming in west Mediterranean Europe. Proc.
Natl. Acad. Sci. USA 98, 14180–14185 (2001).
50. Bollongino, R. et al. 2000 years of parallel societies in Stone Age Central Europe. Science 342, 479–481 (2013).
51. Der Sarkissian, C. et al. Ancient DNA reveals prehistoric gene-flow from Siberia in the complex human population history of North East Europe. PLoS Genet. 9, e1003296 (2013).
52. Fu, Q. et al. A revised timescale for human evolution based on ancient mitochondrial genomes. Curr. Biol. 23, 553–559 (2013). 53. Hofmanová, Z. et al. Early farmers from across Europe directly descended from Neolithic Aegeans. Proc. Natl. Acad. Sci. USA 113,
6886–6891 (2016).
54. Jones, E. R. et al. Upper Palaeolithic genomes reveal deep roots of modern Eurasians. Nat. Commun. 6, 8912 (2015).
55. Lazaridis, I. et al. Ancient human genomes suggest three ancestral populations for present-day Europeans. Nature 513, 409–413 (2014).
56. Malmström, H. et al. Ancient DNA reveals lack of continuity between Neolithic hunter-gatherers and contemporary Scandinavians.
Curr. Biol. 19, 1758–1762 (2009).
57. Seguin-Orlando, A. et al. Genomic structure in Europeans dating back at least 36,200 years. Science 346, 1113–1118 (2014). 58. Szécsényi-Nagy, A. et al. Tracing the genetic origin of Europe’s first farmers reveals insights into their social organization. Proc. R.
Soc. Lond. B Biol. Sci. 282, 20150339 (2015).
59. Lacan, M. et al. Ancient DNA reveals male diffusion through the Neolithic Mediterranean route. Proc. Natl. Acad. Sci. USA 108, 9788–9791 (2011a).
60. Lacan, M. et al. Ancient DNA suggests the leading role played by men in the Neolithic dissemination. Proc. Natl. Acad. Sci. USA 108, 18255–18259 (2011b).
61. Fernández, E. et al. Ancient DNA analysis of 8000 B. C. Near Eastern farmers supports an Early Neolithic pioneer maritime colonization of mainland Europe through Cyprus and the Aegean islands. PLoS Genet. 10, e1004401 (2014).
62. Richard, C. et al. An mtDNA perspective of French genetic variation. Ann. Hum. Biol. 34, 68–79 (2007). 63. Kılınç, G. M. et al. The demographic development of the first farmers in Anatolia. Curr. Biol. 0 (2016).
64. Gamba, C. et al. Genome flux and stasis in a five millennium transect of European prehistory. Nat. Commun. 5, 5257 (2014). 65. Günther, T. et al. Ancient genomes link early farmers from Atapuerca in Spain to modern-day Basques. Proc. Natl. Acad. Sci. USA
112, 11917–11922 (2015).
66. Mathieson, I. et al. Genome-wide patterns of selection in 230 ancient Eurasians. Nature 528, 499–503 (2015).
67. Olalde, I. et al. Derived immune and ancestral pigmentation alleles in a 7,000-year-old Mesolithic European. Nature 507, 225–228 (2014).
68. Olalde, I. et al. A common genetic origin for early farmers from Mediterranean Cardial and Central European LBK cultures. Mol.
Biol. Evol. 32, 3132–3142 (2015).
69. Sikora, M. et al. Population genomic analysis of ancient and modern genomes yields new insights into the genetic ancestry of the Tyrolean Iceman and the genetic structure of Europe. PLoS Genet. 10, e1004353 (2014).
70. Skoglund, P. et al. Origins and genetic legacy of Neolithic farmers and hunter-gatherers in Europe. Science 336, 466–469 (2012). 71. Skoglund, P. et al. Genomic diversity and admixture differs for Stone-Age Scandinavian foragers and farmers. Science 344, 747–750
(2014).
72. Allentoft, M. E. et al. Population genomics of Bronze Age Eurasia. Nature 522, 167–172 (2015).
73. Wilde, S. et al. Direct evidence for positive selection of skin, hair, and eye pigmentation in Europeans during the last 5,000 y. Proc.
Natl. Acad. Sci. USA 111, 4832–4837 (2014).
74. Metspalu, M. et al. Shared and unique components of human population structure and genome-wide signals of positive selection in South Asia. Am. J. Hum. Genet. 89, 731–744 (2011).
75. Alves, I. et al. Long-distance dispersal shaped patterns of human genetic diversity in Eurasia. Mol. Biol. Evol. 33, 946–958 (2016). 76. Atkinson, Q. D., Gray, R. D. & Drummond, A. J. mtDNA variation predicts population size in humans and reveals a major southern
Asian chapter in human prehistory. Mol. Biol. Evol. 25, 468–474 (2008).
77. Chandrasekar, A. et al. Updating phylogeny of mitochondrial DNA macrohaplogroup M in India: Dispersal of modern human in South Asian corridor. PLoS One 4, e7447 (2009).
78. Thangaraj, K. et al. In situ origin of deep rooting lineages of mitochondrial macrohaplogroup ‘M’ in India. BMC Genomics 7, 1–6 (2006).
79. Singh, S. et al. Dissecting the influence of Neolithic demic diffusion on Indian Y-chromosome pool through J2-M172 haplogroup.
Sci. Rep. 6, 19157 (2016).
80. Ayub, Q. et al. The Kalash genetic isolate: Ancient divergence, drift, and selection. Am. J. Hum. Genet. 96, 775–783 (2015). 81. Basu Mallick, C. et al. The light skin allele of SLC24A5 in South Asians and Europeans shares identity by descent. PLoS Genet. 9,
e1003912 (2013).
82. Broushaki, F. et al. Early Neolithic genomes from the eastern Fertile Crescent. Science 353, 499–503 (2016).
83. Rieder, M. J., Taylor, S. L., Tobe, V. O. & Nickerson, D. A. Automating the identification of DNA variations using quality-based fluorescence re-sequencing: analysis of the human mitochondrial genome. Nucleic Acids Res. 26, 967–973 (1998).
84. Torroni, A. et al. Do the four clades of the mtDNA haplogroup L2 evolve at different rates? Am. J. Hum. Genet. 69, 1348–1356 (2001). 85. Anderson, S. et al. Sequence and organization of the human mitochondrial genome. Nature 290, 457–465 (1981).
86. Andrews, R. M. et al. Reanalysis and revision of the Cambridge reference sequence for human mitochondrial DNA. Nat. Genet. 23, 147–147 (1999).
87. Hall, T. A. BioEdit: a user-friendly biological sequence alignment editor and analysis program for Windows 95/98/NT. Nucleic Acids
Symp. Ser. 41, 95–98 (1999).
88. van Oven, M. & Kayser, M. Updated comprehensive phylogenetic tree of global human mitochondrial DNA variation. Hum. Mutat.
30, E386–E394 (2009).
89. Forster, P., Harding, R., Torroni, A. & Bandelt, H. J. Origin and evolution of Native American mtDNA variation: a reappraisal. Am.
J. Hum. Genet. 59, 935–945 (1996).
90. Saillard, J., Forster, P., Lynnerup, N., Bandelt, H. J. & Nørby, S. mtDNA variation among Greenland Eskimos: the edge of the Beringian expansion. Am. J. Hum. Genet. 67, 718–726 (2000).
91. Soares, P. et al. Correcting for purifying selection: An improved human mitochondrial molecular clock. Am. J. Hum. Genet. 84, 740–759 (2009).
92. Loogväli, E.-L., Kivisild, T., Margus, T. & Villems, R. Explaining the imperfection of the molecular clock of Hominid mitochondria.
PLoS One 4, e8260 (2009).
93. Drummond, A. J., Suchard, M. A., Xie, D. & Rambaut, A. Bayesian phylogenetics with BEAUti and the BEAST 1.7. Mol. Biol. Evol.
29, 1969–1973 (2012).
94. Hasegawa, M., Kishino, H. & Yano, T. Dating of the human-ape splitting by a molecular clock of mitochondrial DNA. J. Mol. Evol.
22, 160–174 (1985).
95. Zuckerkandl, E. & Pauling, L. Molecules as documents of evolutionary history. J. Theor. Biol. 8, 357–366 (1965).
96. Drummond, A. J., Rambaut, A., Shapiro, B. & Pybus, O. G. Bayesian coalescent inference of past population dynamics from molecular sequences. Mol. Biol. Evol. 22, 1185–1192 (2005).
97. Miller, M. A., Pfeiffer, W. & Schwartz, T. Creating the CIPRES Science Gateway for inference of large phylogenetic trees. In Gateway
Computing Environments Workshop (GCE) 1–8, doi: 10.1109/GCE.2010.5676129 (2010).
Acknowledgements
We thank all the DNA donors who participated in this study. This study was supported by Estonian Institutional Research grant IUT24–1 (to H.S., E.M., M.R., M.M., T.K., and R.V.); ERC Starting Investigator grant (FP7 - 261213) (to T.K.); EU European Regional Development Fund through the Centre of Excellence in Genomics to Estonian Biocentre; Estonian Research Council grant PUT1339 (to A.K.), PUT1217 (to Kr.T.) and PUT766 (to G.C.); the University of Pavia strategic theme “Towards a governance model for international migration: an interdisciplinary and diachronic perspective” (MIGRAT-IN-G); the Italian Ministry of Education, University and Research: Futuro in Ricerca 2012 (RBFR126B8I) (to A.A. and A.O.) and Progetti Ricerca Interesse Nazionale 2012 (to A.A., O.S., and A.T.); the Council of Scientific and Industrial Research, Government of India (GENESIS: BSC0121) and (BSC 0118) (to Ku.T.); S.S. and E.R. acknowledge the support of National geographic Society through Genographic Project Research Grant (6–13). R.T. and A.K.P. were supported by the European Social Fund’s Doctoral Studies and Internationalisation Programme DoRa. M.B.R. received support from the Leverhulme Trust’s Doctoral Scholarship programme, and F.G. from the University of Huddersfield’s University Research Fund and Research Excellent Staff Scheme. P.S. was supported by the FCT Investigator Programme (IF/01641/2013).
Author Contributions
Study design: H.S., B.H.K., G.C., A.T. and R.V. Frequency data: H.S., B.H.K., R.T, A.K., A.K.P., E.M., E.P., E.T., Kr.T., M.R., J.S., T.S., N.E., I.K., D.M.B., P.E., G.C. Sequencing: H.S., B.H.K., R.T, A.K., A.F., M.D.C., A.K.P., I.S., J.P., E.M., E.P., M.K., E.T., Kr.T., T.R., M.R., F.G., P.S., E.R., J.S., T.S., V.S., L.P., V.F., D.P.S., H.A., D.U., N.E., I.K., M.B., N.R., M.Sg., V.K.S., A.G.R., M.V.G., V.O., K.K., M.A.S., S.S., L.S., D.M.B., M.B.R., M.M., Ku.T., P.E., G.C. Data analyses and interpretation: H.S., B.H.K., A.K., Z.K., M.v.O., H.H., A.A., A.O., P.S., O.S., L.Y., M.M., T.K., P.E., G.C., A.T. and R.V. Provided samples: H.S., B.H.K., A.K., A.K.P., Z.K., J.P., E.M., E.P., Kr.T., A.B., M.R., U.A.P., N.A.Z., M.H., M.H.S., J.S., T.S., V.C., S.F., N.E., I.K., S.L., M.B., E.K.K., A.G.R., H.V.T, S.C., L.B.L., P.R., E.N.M., N.P.A., K.I.P., M.V.G., S.A.B., M.A.S., M.Sm., V.G., E.G., P.G., M.V., L.D., O.S., D.M.B., L.Y., P.E., G.C. Wrote manuscript: H.S., B.H.K., A.K., M.B.R., M.M., T.K., P.E., G.C., A.T. and R.V. with inputs from all co-authors. H.S. and B.H.K. contributed equally to this work.
Additional Information
Accession codes: The previously unreported 267 mitogenome sequences have been deposited in GenBank
(http://www.ncbi.nlm.nih.gov/genbank/) under accession numbers KY824818-KY825084.
Supplementary information accompanies this paper at http://www.nature.com/srep Competing Interests: The authors declare no competing financial interests.
How to cite this article: Sahakyan, H. et al. Origin and spread of human mitochondrial DNA haplogroup U7.
Sci. Rep. 7, 46044; doi: 10.1038/srep46044 (2017).
Publisher's note: Springer Nature remains neutral with regard to jurisdictional claims in published maps and
institutional affiliations.
This work is licensed under a Creative Commons Attribution 4.0 International License. The images or other third party material in this article are included in the article’s Creative Commons license, unless indicated otherwise in the credit line; if the material is not included under the Creative Commons license, users will need to obtain permission from the license holder to reproduce the material. To view a copy of this license, visit http://creativecommons.org/licenses/by/4.0/