DOI 10.1007/s10404-015-1628-7
RESEARCH PAPER
Numerical analysis of mixing performance in sinusoidal
microchannels based on particle motion in droplets
Alican Özkan1 · E. Yegân Erdem1
Received: 26 March 2015 / Accepted: 12 August 2015 / Published online: 22 August 2015 © Springer-Verlag Berlin Heidelberg 2015
Keywords Droplet-based microfluidics · Dispersion
length · Mixing performance · Microfluidics · Droplet formation · Level set method
List of symbols
deffective Effective droplet diameter
Fdrag Drag force on spherical particle Fst Surface tension force
h Length of the droplet
u Flow velocity
urel Relative velocity of particle
t Time
tcorr. Corresponding time for maximum dispersion
length occurrence P Pressure
P1 Particle 1 P2 Particle 2 r Particle radius
ri Inner radius of sinusoidal channel rc Central radius of sinusoidal channel ro Outer radius of sinusoidal channel
ldiff,3D Three-dimensional dispersion length
ldiff,max Maximum dispersion length difference between
particles
φ Level set function
ǫ, γ Numerical stabilization parameters of level set function
ρ Density
µ Dynamic viscosity 1 Introduction
Mixing in microscale is limited to the diffusion of fluids, and this makes it difficult to achieve fast and effective
Abstract This numerical study was conducted to analyze
and understand the parameters that affect the mixing per-formance of droplet-based flow in sinusoidal microfluidic channels. Finite element analysis was used for modeling fluid flow and droplet formation inside the microchannels via tracking interface between the two heterogeneous flu-ids along with multiple particle trajectories inside a droplet. The solutions of multiphase fluid flow and particle trajec-tories were coupled with each other so that drag on every single particle changed in every time step. To solve fluid motion in multiphase flow, level set method was used. Para-metric study was repeated for different channel dimensions and different sinusoidal channel profiles. These results were compared with mixing in droplets inside a straight microchannel. Additionally, tracking of multiple particles inside a droplet was performed to simulate the circulating flow profile inside the droplets. Based on the calculation of the dispersion length, particle trajectories, and velocities inside droplets, it is concluded that having smaller chan-nel geometries increases the mixing performance inside the droplet. This also shows that droplet-based fluid flow in microchannels is very suitable for performing chemical reactions inside droplets as it will occur faster. Moreover, narrower and sinusoidal microchannels showed better dis-persion length difference compared to straight and wider microchannels.
* Alican Özkan
[email protected]; [email protected] E. Yegân Erdem
1 Department of Mechanical Engineering, Bilkent University,
mixing in continuous flow microfluidics. Utilizing sinusoi-dal or meandering microchannel geometry to mix multiple substances is one of the most common techniques in micro-reactors (Dogana et al. 2009; Fries et al. 2008; Wu and Tsai 2013). Another method to improve mixing in continuous flow is chaotic mixing. In a steady chaotic flow, fluid form changes exponentially as it moves in the axial direction, which increases the mixing effect (Stroock 2002; Song et al. 2003). On the other hand, droplet-based microfluidic systems have several advantages over continuous flow sys-tems due to the circulating flow profile inside the droplets as opposed to parabolic flow profile, which increases the diffusion and therefore the speed of mixing (Song et al. 2003; Huebner et al. 2011; Erdem et al. 2014).
Experimental investigation of mixing performance of multiple reagents inside droplets using dyes proved that it is a rapid method for mixing without dispersion (Tice et al. 2009). Another study on mixing includes chaotic advection introduced by a variety of winding geometries for folding, stretching, and reorienting bulk fluid which accelerates mixing rate of the high Péclet number systems (Bringer et al. 2004). Moreover, some studies are conducted for real-time monitoring of droplet-based mixing in microchan-nels using Fluorescence Lifetime Imaging (Srisa-Art et al. 2008; Song et al. 2003).
Even though it was shown experimentally that the mix-ing in droplets is faster compared to continuous flow, it is necessary to understand how each parameter (chan-nel dimensions, size of droplets, position-based disper-sion length, etc.) affects the mixing performance. Some of the previous numerical work on mixing includes a study on chaotic mixing inside rotating droplets (Chabreyrie et al. 2010), mixing performance in droplets with induced steady and unsteady flow inside (Chabreyrie et al. 2009). Additionally, droplet motion over obstacles and spacing of droplets and generation algorithms were studied by dif-ferent research groups to understand physics of droplet motion in the computational manner (Lee and Son 2013; Maddala and Rengaswamy 2014). Previous computational fluid dynamics (CFD) simulations were based on either lattice Boltzmann method (Wu et al. 2008), boundary ele-ment method (Wanga et al. 2014), or finite elements with level set method (Chung et al. 2009; Yan et al. 2012; Bashir et al. 2011). Finite element method combined with level set method was used more frequently among the other numeri-cal approaches.
This study was conducted to understand the effect of geometry of the channel on the mixing performance in a droplet-based system using numerical techniques. Utilizing finite element analysis, droplet formation was simulated, and flow profile inside droplets was visualized via particle tracking. To understand the mixing performance, different parameters such as dispersion length, particle trajectories in
vertical direction, and particle velocities inside the droplets were calculated. This study was iterated for different chan-nel cross sections and mixing zone profiles.
2 Theory and modeling
Among the various droplet formation methods, one of the most common methods of forming droplets in microchan-nels is to use a T-junction. In a T-junction, droplets are generated by shear stress applied by the immiscible car-rier fluid. In order to increase the efficiency of mixing, sinusoidal channel profile is used so that distortion on the droplet surface will provide additional reduction in disper-sion length inside the droplet, eventually reducing the time required for mixing.
In this study, in order to simulate droplet motion, level set method, which is an iterative, numerical technique to track interfaces and shapes, was used. By combining gov-erning equations, momentum transport equation, and level set method, one can simulate multiphase fluid motion con-sidering fluid interface by using finite elements. The fol-lowing Eqs. (1), (2), and (3) (Sussman and Puckett 2000) represent Reynolds momentum transport, continuity, and level set equations, respectively.
where ρ is density, u is velocity, t is time, µ is dynamic viscosity, P is pressure, Fst is the surface tension force, φ
is level set function, γ , and ǫ are numerical stabilization parameters. Level set function determines the density and viscosity at the interface between the droplet and the carrier fluid by using Eqs. 4 and 5 below.
Equations given above were implemented in Comsol Multiphysics® to simulate droplet generation and particle
motion. To test mixing in microchannels, 17 identical 90° arcs were added after droplet formation zone to form the sinusoidal mixing channel. For all simulations, number of arcs was kept constant. The schematic of the computational domain of the simulation is shown in Fig. 1.
As shown in Fig. 1, our domain has two separate sec-tions that are the mixing zone and the formation zone. In
(1) ρ∂u
∂t +ρ(u · ▽)u = ▽ · −pI + µ ▽u + (▽u)
T + F st (2) ▽ ·u =0 (3) ∂φ ∂t +u · ▽φ = γ ▽ · −φ (1 − φ) ▽φ | ▽φ| +ǫ ▽ φ (4) ρ = ρ1(1 − φ) + ρ2φ (5) µ = µ1(1 − φ) + µ2φ
the formation zone, droplets were generated at the T-junc-tion. In the mixing zone, the mixing performance of sinu-soidal channels according to different parameters was analyzed. Boundary conditions were chosen as “wetted wall boundary condition” at the channel walls and “zero pressure boundary condition” at the exit. Flow rates were defined at the inlets. In order to reduce the computational expense of the simulation, only one half of the domain was solved since the problem is symmetric in the y-direction. As a result, formation and circulation of half droplet was simulated. Once the simulation was completed, results were mirrored in y-direction to visualize the whole domain. Flow parameters of the simulations are given in Table 1.
In order to analyze motion within the droplet, we intro-duced multiple spherical nanoparticles in flow so that trac-ing their motion would give an idea about the efficiency of the mixing. Particle movement inside droplets represents the mixing rate in the flow. Motion of a spherical particle in fluid medium with low Reynolds number flow is formu-lated as (Zaidi et al. 2012);
Additionally, to determine the mixing performance in microchannels, different parameters were used. First one was the dispersion length which is denoted in the following equation (Bruss 2008):
Dispersion length, or in other words mixing length, is defined as the representative of the Péclet number of a numerical scheme, where dispersion of a bulk fluid is taken into consideration. Different from other mixing terms such as diffusivity, dispersion length, which is representative of diffusion and convection of the fluid, is measured in terms of the characteristic geometric length (Zimmerman and
(6)
Fdrag=6π µrurel
(7)
ldiff,3D2 = x2+y2+z2
Homsy 1991; Bruss 1992). This equation was used to deter-mine the particle dispersion length with respect to its initial release position in Cartesian coordinates (x, y, z). In each case, particles were released from the same initial position. For higher mixing performance, wider difference between two dispersion lengths of different particles was expected. Oppositely, if there were no hydraulic mixing inside the droplet, dispersion length difference between two particles would be expected not to change through the simulation.
Particle velocity and displacement in vertical direction are the other parameters that determine mixing perfor-mance. Simulations were repeated for different dimensions of the microchannel in the mixing zone. Those geometri-cal variations, inner (ri), central (rc), and outer (ro) radius
of mixing zone for different cross section, are shown in Table 2, and representation of these parameters on compu-tational domain is given in Fig. 2.
3 Results and discussion
To determine the fluid flow and particle movement, Com-sol Multiphysics®, which is a finite element analysis
soft-ware, was used. Since fluid flow equation is independent of particle movement in the flow field, first level set, Reyn-olds momentum transport, and governing equations were
Fig. 1 Schematic of the computational domain of the simulation
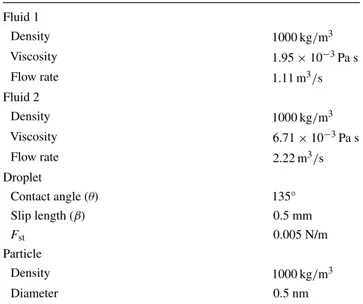
Table 1 Simulation parameters Fluid 1 Density 1000 kg/m3 Viscosity 1.95 × 10⁻³ Pa s Flow rate 1.11 m3/s Fluid 2 Density 1000 kg/m3 Viscosity 6.71 × 10⁻³ Pa s Flow rate 2.22 m3/s Droplet Contact angle (θ) 135◦ Slip length (β) 0.5 mm Fst 0.005 N/m Particle Density 1000 kg/m3 Diameter 0.5 nm
Table 2 Mixing zone
dimensions for different cases Case (mm) 100 µm × 100 µm 120 µm × 120 µm
1 2 3 4 5 6
ri 0.02 0.05 0.07 0.02 0.05 0.07
rc 0.07 0.10 0.12 0.08 0.11 0.13
solved, and later, particle movement was solved. Fluid was assumed to be incompressible and Newtonian.
In order to check the accuracy of the model, effective droplet diameter and volume were compared with numeri-cal and experimental studies in the literature (van der Graaf et al. 2006). Results of this comparison are shown in Table 3.
As it is shown in Table 3, our model result matches with the experimental and other simulation results from the lit-erature. Reason of this error difference between literature and our simulations is due to the difference in the applied numerical methods. However, showing only droplet diam-eter is not sufficient for validating the reliability of the results. Phase leakage is also an issue in level set method, where mass of fluids is not conserved due to the leakage from one liquid to the other. Moreover, high contrast in density and viscosity increases the possibility of this leak-age. On the other hand, in the literature, it was denoted that for two liquid phases, phase leakage is a minor prob-lem (Zimmerman 2006; Deshpande and Zimmerman 2006, 2006). Nevertheless, we calculated the phase leakage as well as the effective droplet volume change in every time step to show that phase leakage is not very significant in our model.
From Fig. 3, we can see that the effective volume of the droplet increased in the first 0.035 s, which was the time during which the droplet was formed. After the droplet was formed, it entered the mixing zone, and it can be seen that the volume of the droplet was steady and therefore phase leakage did not affect the volume of the droplets signifi-cantly. For a similar leakage case discussed in (Zimmerman 2006), this was considered as a minor leakage. Therefore, in our simulations, phase re-injection was not implemented,
and we can state that the simulation results are consistent and reliable.
In this study, six different cases with varying channel dimensions were tested. These cases are listed in Table 2. In each case, two particles were released from the same location in the droplet. Mixing performance in different channel dimen-sions was analyzed. Droplet motion and differentiation of one fluid from the other was done by using isosurface and volume fraction along with constant density in the volume space. Visu-alization of droplet motion is shown in Figs. 4 and 5.
Fig. 2 Geometric definitions of mixing zone
Table 3 Comparison of model accuracy using effective droplet diam-eter with the literature
Simulation Experiment (lit) Simulation (lit) deffective(µm) 116.451 106.224 101.245 % Error 8.70 13.06 0 0.01 0.02 0.03 0.04 0.05 0.06 0.07 0.08 0 0.005 0.01 0.015 0.02 0.025 Time(s)
Effective Volume of Droplet(mm
3 ) 0 0.1 0.2 0.3 0.4 0.5 0.6 0.7 0.8 0.9 1 1.1 1.2 Phase Leakage
Formation Zone Mixing Zone
Fig. 3 Volume of the droplet and phase leakage calculation in for-mation and leakage zones. Volume of the droplet was calculated by V = h4π/3(deffective/2)2. Phase leakage was calculated by Comsol
Multiphysics®. The mesh domain consists of 222,817 domain
ele-ments, 29,665 boundary eleele-ments, 2209 edge eleele-ments, and number of degrees of freedom is 1,349,253
Fig. 4 Droplet formation in microchannels using isosurface
As shown in Fig. 4, droplets, indicated in blue color, were successfully formed, carried in the carrier fluid, and circulated in the sinusoidal channel without any dissipation from droplet to the carrier fluid. Moreover, green lines in the microchannel indicate streamlines of the flow. Volume fractions of fluids 1 and 2 are shown in Fig. 5. Green con-tour around the droplet indicates the interface around the droplet.
The results of the first set of simulations, particle dis-placement, velocity profile, and dispersion length of first three cases are represented in Figs. 6, 7, and 8. Accord-ing to the results in Fig. 6, each particle circulates in the sinusoidal channel as expected. Due to the channel’s geometric difference in each case, the highest and low-est particle displacements in vertical direction vary. The
irregularities in the formation zone are due to the initial formation of the droplet. This is effective in distinguish-ing two different particles which were released very close to each other. At t = 0.03 s, formation ends and droplet begins to cycle in the straight part of the channel. At
t =0.45, it enters the mixing channel with sinusoidal shape. According to these results, we observed that the vertical displacement between each particle varied with time. Furthermore, in channels with larger central radius, vertical displacement of two different particles had sim-ilar trajectories which is not desired for mixing. As the channels scale down, trajectory variation between two particles released at the same location increased, which validates the experimental results in the literature that show faster mixing in sinusoidal channels with smaller central radius (Naher et al. 2011). In straight channels, particle path in droplets did not change significantly in vertical direction which proves the necessity of the sinu-soidal shape to increase the mixing rate.
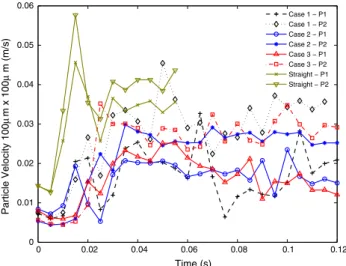
When we check the velocity profiles in Fig. 7, we can see that the velocity of particles in straight channels does not change much since there was no collusion of droplet to side walls or meandering parts of the microchannel. How-ever, in sinusoidal channel profiles, there is a significant velocity variation between particles. Especially in chan-nels with smaller central radius, velocity variation is larger compared to the ones with larger radius. This variation has an important role on hydrodynamic mixing since velocity variation inside the droplet certifies velocity profile varia-tion inside the droplet as indicated in Jiang et al. (2012). That is to say, having more fluctuation in the magnitude of the velocity improves the mixing performance. Therefore, having greater variance between particle velocities inside droplets is more likely in channels with smaller central
0 0.02 0.04 0.06 0.08 0.1 0.12 0 0.05 0.1 0.15 0.2 0.25 0.3 0.35 Time (s)
Particle displacement in z−direction
100 µ m x 100 µ m (mm) Case 1 − P1 Case 1 − P2 Case 2 − P1 Case 2 − P2 Case 3 − P1 Case 3 − P2 Straight − P1 Straight − P2
Fig. 6 Displacement of particles at 100 µm × 100 µm channel cross section and comparison with straight channel profile
0 0.02 0.04 0.06 0.08 0.1 0.12 0 0.01 0.02 0.03 0.04 0.05 0.06 Time (s) Particle Velocity 100 µ m x 100 µ m (m/s) Case 1 − P1 Case 1 − P2 Case 2 − P1 Case 2 − P2 Case 3 − P1 Case 3 − P2 Straight − P1 Straight − P2
Fig. 7 Velocity of particles at 100 µm × 100 µm channel cross sec-tion and comparison with straight channel profile
0 0.02 0.04 0.06 0.08 0.1 0.12 0 0.5 1 1.5 2 2.5 Time (s)
Dispersion length of particle 100
µ m x 10 0µ m (mm) Case 1 − P1 Case 1 − P2 Case 2 − P1 Case 2 − P2 Case 3 − P1 Case 3 − P2 Straight − P1 Straight − P2
Fig. 8 Dispersion lengths of particles at 100 µm × 100 µm channel cross section and comparison with straight channel profile
radius, providing better mixing rates compared to the chan-nels with larger central radius.
Dispersion length variation is the other crucial parameter for determining the mixing performance. As it is explained in the theory part of this article, distance between particles inside the same droplet indicates the mixing rate. Greater dispersion length variation between particles results in bet-ter mixing performance. Figure 8 shows that the dispersion lengths between two particles does not change significantly in channels with 100 µm × 100 µm cross section. Like-wise, in Fig. 6, dispersion length of particles moving in the straight microchannel does not change. Therefore, change in dispersion length in straight microchannel is only due to the regular motion of the droplet which is not sufficient for fast mixing rates. On the other hand, in sinusoidal chan-nels, dispersion length variation increases in each time step since wave-like motion of droplets provides a non-uniform velocity profile inside droplets. So that, location of each particle changes significantly in each time step. Moreover, variation between dispersion length between two particles increases as the curvature radius of meandering channel decreases, which rapids up the mixing inside the droplet. This is also due to the higher non-uniformity of the velocity profile inside the droplets in channels with smaller central radius.
By looking at the results, it can be concluded that chan-nels with smaller central radius show better performance compared to channels with larger central radius based on the following three findings; (1) change in vertical dis-placement of particles in channels with smaller radius is more frequent compared to channels with larger radius; (2) there are more velocity peaks and variations through mix-ing process in channels with smaller radius; (3) dispersion length difference between two particles is larger compared to the channels with larger radius. In the next section, same parameters were used to simulate mixing performance where cross-sectional area of microchannel was increased from 100 µm × 100 µm to 120 µm × 120 µm. Figures 9, 10, and 11 represent particle displacements in vertical direction, velocity variation, and dispersion length of parti-cles in this channel profile, respectively.
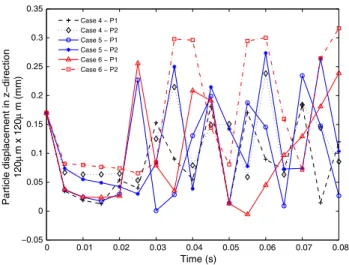
According to the results in Fig. 9, particle motion shows similarities as in the case of 100 µm × 100 µm channel profile (Fig. 6). Similarly, particle displacements in ver-tical direction differ faster compared to channels with wider central radius. In fact, in 100 µm × 100 µm channel
profiles, particles reach mixed conditions in a shorter time. If we compare Figs. 6 and 9, 100 µm × 100 µm channel profile particles of case 1 reaches to opposite locations in t = 0.08 s. In fact, in 120 µm × 120 µm channels of case 4, particle positions do not change frequently during the simulation time which is undesired for mixing inside the droplets.
As shown in Fig. 10, variation in particle velocities is different for different dimensions of channels. In channels
0 0.01 0.02 0.03 0.04 0.05 0.06 0.07 0.08 −0.05 0 0.05 0.1 0.15 0.2 0.25 0.3 0.35 Time (s)
Particle displacement in z−direction
120 µ m x 12 0µ m (mm) Case 4 − P1 Case 4 − P2 Case 5 − P1 Case 5 − P2 Case 6 − P1 Case 6 − P2
Fig. 9 Displacement of particles at 120 µm × 120 µm channel pro-files 0 0.01 0.02 0.03 0.04 0.05 0.06 0.07 0.08 0 0.01 0.02 0.03 0.04 0.05 0.06 0.07 0.08 0.09 Time (s) Particle Velocity 120 µ m x 12 0µ m (m/s) Case 4 − P1 Case 4 − P2 Case 5 − P1 Case 5 − P2 Case 6 − P1 Case 6 − P2
Fig. 10 Velocity of particles at 120 µm × 120 µm channel profiles
Table 4 Maximum dispersion length difference percentage for each case
ldiff,max=0.8884 mm
Case # 1 2 3 4 5 6 Straight
ldiff,max (%) 100 57.10 72.96 58.21 45.78 58.68 19.02
with a larger cross-sectional area, velocity values of parti-cles are larger compared to channels with a smaller cross-sectional area.
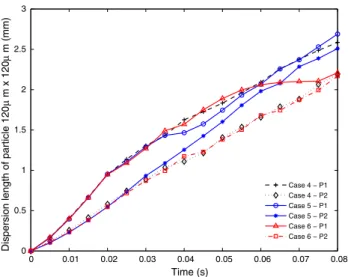
Dispersion length variation between two particles (P1, P2) for different cases is shown in Fig. 11. As it is expected, smaller central radius channel profile provides more dispersion length variation between two particles. Additionally, for channels with larger radius, dispersion length variation decreases. However, cases 5 and 6 do not have much of a difference. Unlike Fig. 8, dispersion length variation in cases 2 and 3 is visually more different than the cases in wider channel geometry. Due to that reason, we can understand that in channels with larger radius, increase in cross-sectional area decreases the mixing performance inside droplets. Furthermore, dispersion length difference between cases 1 and 4 shows a significant variance. If we check the dispersion length difference at t = 0.08 s, for smaller cross-sectional geometry, dispersion length differ-ence is larger than the case for larger cross-sectional area. Therefore, it can be concluded that smaller cross-sectional geometries are more suitable for faster mixing rates. Over-all, maximum dispersion length percent and corresponding time for each case is given in Table 4 as a summary of these results.
According to Table 4, case 1 reaches to maximum dis-persion length toward the end of the simulation, whereas for cases 4, 5, and 6, maximum dispersion length is not reached at the end of the simulation. This means mixing was not very efficient. Moreover, case 1 provides five times greater dispersion length difference between particles than straight microchannels, which proves that sinusoidal chan-nels are better for mixing.
4 Conclusion and future works
In conclusion, we have modeled a sinusoidal microchannel and conducted multiple numerical simulations for drop-let formation and spherical particle movement inside the droplets to predict the performance of hydrodynamic mix-ing inside droplets. Simulations were conducted for six different channel geometries, including change in channel curvature and cross-sectional area, and results were com-pared within each other as well as with droplet motion in a straight channel. Based on the movement of multiple particles inside a droplet, mixing in the microchannels with smaller cross-sectional area and smaller radius pro-vides faster hydraulic mixing. It was concluded that this result is due to the fact that smaller microchannels provide wider dispersion length differences, more frequent velocity change, and vertical trajectory variation between particles. As a future work, a set of simulations can be conducted to understand the effect of droplet size, density, and viscosity on mixing.
References
Bashir S, Rees JM, Zimmerman WB (2011) Simulations of micro-fluidic droplet formation using the two-phase level set method. Chem Eng Sci 66:4733–4741
Bringer MR, Gerdts CJ, Song H, Tice JD, Ismagilov RF (2004) Microfluidic systems for chemical kinetics that rely on cha-otic mixing in droplets. Philos Trans R Soc Lond Ser A 362(1818):1087–1104
Bruss H (1992) Viscous fingering in miscible displacements: Unifica-tion of effects of viscosity contrast, anisotropic dispersion, and velocity dependence of dispersion on nonlinear finger propaga-tion. Phys Fluids A 4(11):2348–2359
Bruss H (2008) Theoretical microfluidics. Oxford University Press, New York
Chabreyrie R, Vainchtein D, Chandre C, Singh P, Aubry N (2009) Robustness of tuned mixing within a droplet for digital microflu-idics. Mech Res Commun 36:130–136
Chabreyrie R, Vainchtein D, Chandre C, Singh P, Aubry N (2010) Using resonances to control chaotic mixing within a translating and rotating droplet. Commun Nonlinear Sci Numer Simulat 15:2124–2132
Chung C, Hyun Ahn K, Lee SJ (2009) Numerical study on the dynam-ics of droplet passing through a cylinder obstruction in confined microchannel flow. J Non-Newton Fluid Mech 162:38–44 Deshpande KB, Zimmerman WB (2006) Simulation of interfacial
mass transfer by droplet dynamics using the level set method. Chem Eng Sci 61:6486–6498
Deshpande KB, Zimmerman WB (2006) Simulations of mass transfer limited reaction in a moving droplet to study transport limited characteristics. Chem Eng Sci 61:6424–6441
Dogana H, Nasb S, Muradoglu M (2009) Mixing of miscible liq-uids in gas-segmented serpentine channels. Int J Multiph Flow 35(12):1149–1158
Erdem EY, Cheng JC, Doyle FM, Pisano AP (2014) Multi-tempera-ture zone, droplet-based microreactor for increased temperaMulti-tempera-ture control in nanoparticle synthesis. Small 10(6):1076–1080
0 0.01 0.02 0.03 0.04 0.05 0.06 0.07 0.08 0 0.5 1 1.5 2 2.5 3 Time (s)
Dispersion length of particle 120
µ m x 120 µ m (mm) Case 4 − P1 Case 4 − P2 Case 5 − P1 Case 5 − P2 Case 6 − P1 Case 6 − P2
Fig. 11 Dispersion length of particles at 120 µm × 120 µm channel profiles
Fries DM, Waelchli S, von Rohr PR (2008) Gas-liquid two-phase flow in meandering microchannels. Chem Eng J 135(1):S37–S45 Huebner AM, Abell C, Huck WTS, Baroud CN, Hollfelder F (2011)
Monitoring a reaction at submillisecond resolution in picoliter volumes. Anal Chem 83:1462–1468
Jiang L, Zeng Y, Zhou H, Qu JY, Yao S (2012) Visualizing millisec-ond chaotic mixing dynamics in microdroplets: a direct compari-son of experiment and simulation. Biomicrofluidics 6:012810 Lee W, Son G (2013) Numerical study of obstacle configuration for
droplet splitting in a microchannel. Comput Fluids 84:130–136 Maddala J, Rengaswamy R (2014) Design of multi-functional
micro-fluidic ladder networks to passively control droplet spacing using genetic algorithms. Comput Chem Eng 60:413–425
Naher S, Orpen D, Brabazon D, Poulsen CR, Morshed MM (2011) Effect of micro-channel geometry on fluid flow and mixing. Simul Model Pract Theory 19:1088–1095
Song H, Bringer MR, Tice JD, Gerdts CJ, Ismagilov RF (2003) Experimental test of scaling of mixing by chaotic advection in droplets moving through microfluidic channels. Appl Phys Lett 83(12):4664–4666
Song H, Tice JD, Ismagilov RF (2003) A microfluidic system for controlling reaction networks in time. Angew Chem Int Ed 42(7):768–772
Srisa-Art M, deMello AJ, Edel JB (2008) Fluorescence lifetime imag-ing of miximag-ing dynamics in continuous-flow microdroplet reac-tors. Phys Rev Lett 101(1):014502
Stroock AD, Dertinger SK, Ajdari A, Mezic I, Stone HA, White-sides GM (2002) Chaotic mixer for microchannels. Science 295(5555):647–651
Sussman M, Puckett EG (2000) A coupled level set and volume-of-fluid method for computing 3D and axisymmetric incompress-ible two-phase flows. J Comput Phys 162:301–337
Tice JD, Song H, Lyon AD, Ismagilov RF (2009) Formation of drop-lets and mixing in multiphase microfluidics at low values of the Reynolds and the capillary numbers. Langmuir 19:9127–9133 van der Graaf S, Nisisako T, Schroen CGPH, van der Sman RGM,
Boom RM (2006) Lattice Boltzmann simulations of droplet for-mation in a T-shaped microchannel. Langmuir 22:4144–4152 Wanga J, Yua D, Jinga H, Tao J (2014) Hydrodynamic control of
droplets coalescence in microfluidic devices to fabricate two-dimensional anisotropic particles through boundary element method. Chem Eng Res Des 92:2223–2230
Wu L, Tsutahara M, Kim LS, Ha M (2008) Three-dimensional lattice Boltzmann simulations of droplet formation in a cross-junction microchannel. Int J Multiph Flow 34:852–864
Wu CY, Tsai RT (2013) Fluid mixing via multidirectional vortices in converging–diverging meandering microchannels with semi-elliptical side walls. Chem Eng J 217:320–328
Yan Y, Guo D, Wen SZ (2012) Numerical simulation of junction point pressure during droplet formation in a microfluidic T-junction. Chem Eng Sci 84:591–601
Zaidi AA, Tsuji T, Tanaka T (2012) A new relation of drag force for high Stokes number monodisperse spheres by direct numerical simulation. Adv Powder Technol 25:1860–1871
Zimmerman WB (2006) Multiphysics modelling with finite element methods, vol 18. World Scientific Series on Stability, Vibration and Control of Systems, Singapore
Zimmerman WB, Homsy GM (1991) Nonlinear viscous fingering in miscible displacement with anisotropic dispersion. Phys Fluids A 3(8):1859–1872