KADİR HAS UNIVERSITY
GRADUATE SCHOOL OF SCIENCE AND ENGINEERING PROGRAM OF INDUSTRIAL ENGINEERING
DETECTION OF FRAUDULENT ACTIVITIES IN
MOBILE DISPLAY ADVERTISING
SAFİYE ŞEYMA KAYA
MASTER’S THESIS
S afiye Ş eyma K AY A M.S . The sis 2018 S tudent’ s F ull Na me P h.D. (or M.S . or M.A .) The sis 2011
DETECTION OF FRADUALENT ACTIVITIES IN
MOBILE DISPLAY ADVERTISING
SAFİYE ŞEYMA KAYA
MASTER’S THESIS
Submitted to the Graduate School of Science and Engineering of Kadir Has University in partial fulfillment of the requirements for the degree of Master’s in the Program of
Industrial Engineering
ii
TABLE OF CONTENTS
ABSTRACT ... i ÖZET ... ii ACKNOWLEDGEMENTS ... iii DEDICATION ... iv LIST OF TABLES ... v LIST OF FIGURES ... vi 1. INTRODUCTION ... 11.1 Working Mechanism of Mobile Advertising ... 2
1.2 Problem Definition ... 4
2. PREVIOUS WORK ... 6
3. MULTIPLE TESTING ... 10
3.1 Šidák Correction Method ... 14
3.2 Bonferroni Correction Method ... 14
3.3 Method of Successive Runs ... 15
3.4 Accuracy Test for Method of Successive Runs ... 18
4. DETECTION OF FRAUD USING MULTIPLE TESTING ... 24
4.1 Detection of Click Spamming ... 25
4.2 Detection of Click Injection ... 29
5. EXPERIMENTS AND RESULTS ... 33
6. CONCLUSION ... 40
REFERENCES ... 42
APPENDIX A ... 45
A.1 Matlab Code for Sign Test for Click Spamming ... 45
A.2 Matlab Code for Sign Test for Click Injection ... 49
A.3 Matlab Code for Counting Positive Values for Sign Test... 54
A.4 Matlab Code for Counting Negative Values for Sign Test ... 54
A.5 Matlab Code for Counting Rejected Test ... 54
iii
A.7 Matlab Code to Detect Click Spamming ... 59
A.8 Matlab Code to Detect Click Injection ... 60
APPENDIX B ... 62
i
DETECTION OF FRAUDULENT ACTIVITIES IN MOBILE DISPLAY ADVERTISING
ABSTRACT
Most of the marketing expenditures in mobile advertising are conducted through real-time bidding (RTB) marketplaces, in which ad spaces of the sellers (publishers) are auctioned for the impression of the buyers’ (advertisers) mobile apps. One of the most popular cost models in RTB marketplaces is cost per install (CPI). In a CPI campaign, publishers place mobile ads of the highest bidders in their mobile apps and are paid by advertisers only if the advertised app is installed by a user. CPI cost model causes some publishers to conduct some infamous fraudulent activities, known as click spamming and click injection. A click spamming publisher executes clicks for lots of users who haven’t made them. If one of these users hears about the advertised app organically (say, via TV commercial) and installs it, this installation will be attributed to the click spamming publisher. In click injection, the fraudulent publisher’s spy app monitors the user’s activities in the app market to detect when a mobile app is downloaded on her device, and triggers a click attributed to the fraudster right before the installation completes. In this study, we propose a novel multiple testing procedure which can identify click spamming and click injection activities using the data of click-to-install time (CTIT), the time difference between the click of a mobile app’s ad and the first launch of the app after the installation. In a sample set of publishers, we show that our procedure has a false-positive error rate of at most 5%. Finally, we run an experiment with 15263 publishers. According to the results of the experiment, a total of 1474 fraudulent publishers are successfully detected.
Keywords: Mobile Advertising, Fraud Detection, Click Spamming, Click Injection,
ii
MOBİL GÖRÜNTÜLEME REKLAMCILIĞINDA YAPILAN SAHTEKARLIK AKTİVİTELERİNİN BELİRLENMESİ
ÖZET
Mobil reklamcılıkta pazarlama harcamalarının çoğu gerçek zamanlı ihaleler aracılığı ile gerçekleştirilmektedir. Gerçek zamanlı ihalelerde, satıcıların (reklam yayınlayıcılarının) reklam alanları, alıcıların (reklam verenlerin) mobil uygulamalarına ait reklamlarının kullanıcı tarafından görüntülenebilmesi için ihaleye çıkartılır. Gerçek zamanlı ihalelerde en çok kullanılan fiyatlandırma modeli indirme başına fiyatlandırmadır. Bu modelde en yüksek fiyatı veren reklam verenin uygulaması yayınlayıcının uygulamasında gösterilir. Yayınlayıcıya ödeme bir kullanıcının bu yayınlanan reklamı tıklayarak indirmesi şartıyla yapılır. Bu model bazı yayınlayıcıların tıklama bombardımanı (click spamming) ve tıklama enjeksiyonu (click injection) olarak bilinen sahtekâr aktivitelerde bulunmasına neden olur. Tıklama bombardımanında yayınlayıcı gerçekte kullanıcı tarafından yapılmamış birçok tıklama üretir. Bu durumdan habersiz olan kullanıcı, reklamı yapılan uygulamayı farklı bir reklam kanalı (televizyon reklamı gibi) aracılığı ile öğrenip indirirse tıklama bombardımanını yapan yayınlayıcı bu indirmeden haksız yollarla para kazanmış olur. Tıklama enjeksiyonunda ise sahtekâr bir uygulamayı indirmek üzere olan bir kullanıcıyı takip edip, indirmeyi tamamlamadan hemen önce o kullanıcı üzerinden reklama tıklama gönderebilir. Dolayısıyla da bu indirme işlemi üzerinden haksız kazanç elde etmiş olur. Bu çalışmada çoklu test etme yöntemini kullanarak bu sahtekârlıkların belirlenebileceği bir yöntem önerdik. Bu yöntemde indirme ve ilk kez uygulamanın açılması arasında geçen zaman üzerinden istatistiksel karar verme yöntemleri kullanılarak sahtekârlar tespit edilmeye çalışıldı. Kullanılan yöntemde yanlış pozitif hata oranının en kötü ihtimalle %5 olması sağlandı. Önerilen yöntem 15263 yayınlayıcının üzerinde test edildi ve 1474 tanesinin sahtekârlık yaptığı tespit edildi.
Anahtar Sözcükler: Mobil Reklamcılık, Sahtekârlık Tespiti, Tıklama Bombardımanı,
iii
ACKNOWLEDGEMENTS
There are many people who helped to make my years at the graduate school most valuable. First, I would like to thank Asst. Prof. Dr. Burak ÇAVDAROĞLU, my major professor and thesis advisor. Having the opportunity to work with him over the years was intellectually rewarding and fulfilling. He has always encouraged me and recommended me to trust myself. He has always shown me the right path to reach success in my research.
Many thanks to other professors in my department, who patiently answered my questions and problems. I would also like to thank to my graduate student colleagues who helped me all through the years that are full of class work and exams. My special thanks go to Elif and Sirun whose friendship I deeply value.
The last words of thanks go to my family. I thank my parents for their patience and encouragement.
iv
DEDICATION
v
LIST OF TABLES
Table 3.1 The descriptive statistics of CTIT values …...……….……..12
Table 3.2 Family-wise error rates for Šidák and Bonferroni methods…..………..……..15
Table 3.3 The family-wise error rates respectively the values of m………...…..……..17
Table 3.4 The rule of multiple testing procedure ..…….………..……..17
Table 3.5 Accuracy test results ...………..20
Table 3.6 Summary of the accuracy test results...………..22
Table 5.1 The list of fraudulent publishers who made click injection ..………..35
Table 5.2 The sample of spammers table from Appendix B……..………..…………..39
vi
LIST OF FIGURES
Figure 1.1 Working mechanism of mobile advertising ………03
Figure 3.1 The distribution of CTIT values..………...………….………...10
Figure 3.2 The distribution of CTIT values ……….………...11
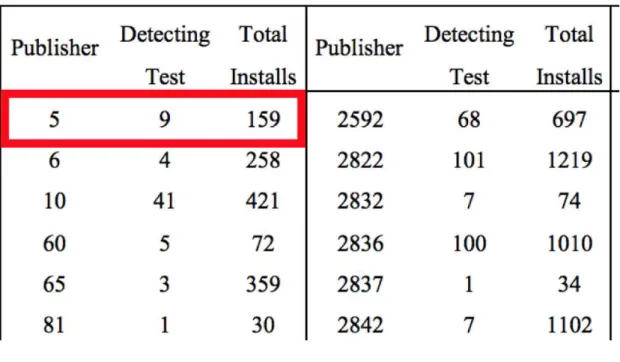
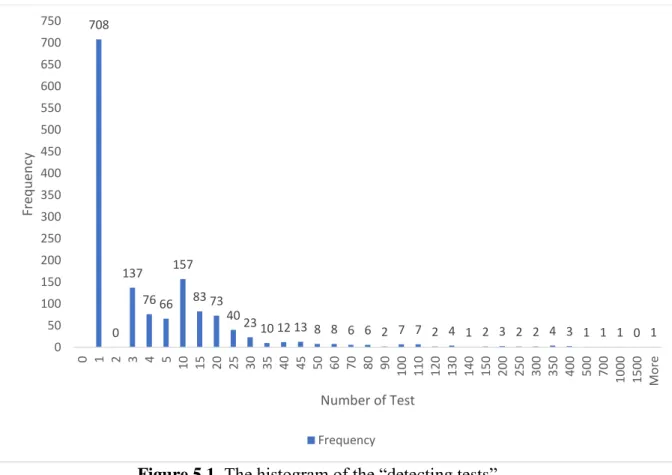
Figure 5.1 The histogram of the “detecting tests”……….………...36
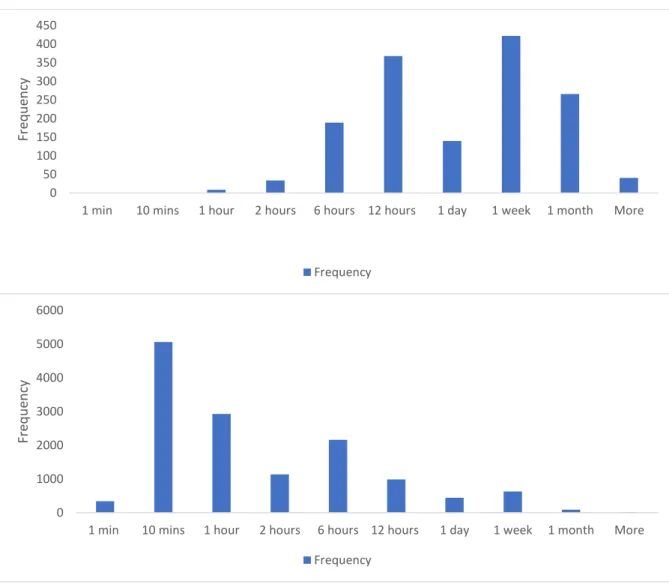
Figure 5.2 The histograms of mean of CTIT values ...……….……….………...37
1
1. INTRODUCTION
The time spent on mobile devices increased drastically in recent years and a significant portion of this time is spent in mobile applications. The widespread usage of both smartphones and mobile applications (apps) has led to the rapid growth of mobile advertising. Mobile display advertisements are displayed as banner images that are shown on mobile devices. They can appear in either web browsers or applications. If a mobile ad is designed for only mobile applications, it is called in-app advertising. Most of the marketing expenditures in mobile advertising are conducted through real-time bidding (RTB) marketplaces, in which the main objective of the buyers (advertisers) is to acquire the most app installation from the audience at the lowest cost and the main goal of the sellers (publishers) is to sell their ad spaces at the highest price. An advertiser decides the bid in the RTB marketplace and the attributes of the targeted users (such as the geolocation and demographics of the target users). Besides, ad agencies can be utilized for dissemination of these ads. An ad agency is a company that runs an ad campaign of a specific product with a predefined budget and campaign duration on behalf of clients. A publisher, which is usually the owner of a mobile app, on the other hand, sells the ad space of the app to advertiser at the winning price of an RTB auction. RTB marketplaces finalize an auction in milliseconds according to the bids of the advertisers. Thus, RTB allows advertisers and publishers to buy and sell ad space through real-time auction.
There are two main platforms in which RTB marketplaces are operated: ad exchanges and ad networks. An ad network, the RTB platform we focus on in this study, allows advertisers to publish their mobile advertising campaigns with a predetermined budget, campaign duration and a desired bid rate. Meanwhile, ad networks collect inventory of ad space from a range of publishers and sell it to advertisers with the highest bid offers in its RTB marketplace. Also, it allows advertisers to target desired customers. Ad networks usually offer different pricing models to the advertisers, such as cost per action, cost per install, cost per click, or cost per impression. In cost per impression model, advertiser is
2
charged when the advertisement appears on the screen. In cost per click model, bid price is paid, if the user just clicks advertising that is shown in an application by user. In cost per action model, a predetermined action by used will be required to charge the advertiser. In the cost per install model (CPI), the bid price is paid after installing the application that is shown as a display ad. The most popular pricing model among advertisers is CPI (Nieborg, 2016).
Even though mobile advertising is a billion-dollar industry, millions of dollars are lost because it is subjected to fraudulent activities. Mobile ad fraud is an attempt by fraudulent publishers to defraud advertisers for gaining undeserved profit. It is a popular subject in mobile marketing industry. In this study, we use statistical analysis to detect mobile frauds to prevent financial losses in mobile display advertising campaigns that prefer CPI pricing models.
1.1 Working Mechanism of Mobile Advertising
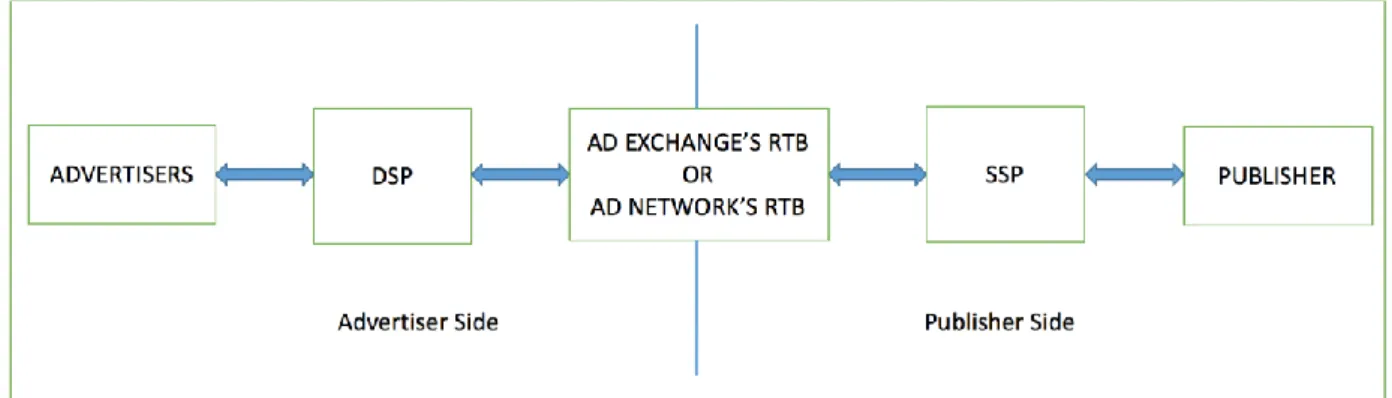
RTB landscape can be separated into two sides naturally; publisher side (supply side) and advertiser side (demand side). Demand side platform (DSP) is a software that is utilized to buy advertising in an automatic fashion by advertisers and ad agencies. In the advertiser side, DSP is requested by advertiser to run and manage an ad campaign. In the publisher side, process is started with a user interaction on publisher application. User preferences, context, location, and the mobile device information are sent by the mobile app to supply side platform (SSP) which is a software to sell mobile ads in an automatic fashion on behalf of publishers. Firstly, previous contracts are checked to send a request to an available contract of an advertiser. If there is not a contract or the advertisers who have contract are not interested in the impression, ad request is sent to ad exchange or ad network for RTB. Then, bid request is generated by RTB exchange or SSP for incoming ad requests and is sent to all subscribed DSPs. A bid request includes a couple of information such as a unique id of the request which is provided by RTB, the time of bid initiated, the current geographic location of the device, etc. The bid price is decided by DSP according to the ad campaign of the ad agency. The bid prices and bid responses are sent by all DSPs. A bid response contains information about id, price, currency, etc. After
3
the auction ends, RTB decides the winner of the auction based on bid prices. The winning note is sent to the winning DSP with the winning price which is the second highest offer (second price auction). The ad is requested from ad agency and sent to RTB. Finally, ad is forwarded to the publisher and user can see the ad on mobile application. The interactions among the involved parties can also be seen in Figure 1.1.
Figure 1.1. Working mechanism of mobile advertising
After that point, if the user clicks the ad and installs the advertised application, the advertiser has to pay the bid price according to the cost per install pricing model. In a CPI campaign, publishers place mobile ads of the highest bidders in their mobile apps in an effort to attract installation of the advertised application. The advertiser is charged the winning bid rate only when the advertiser’s application is installed by the user.
After installation is verified by both the ad network and the advertiser, the ad network receives a portion of the CPI price for finding the publisher that grants the installation, and the publisher receives the rest. Verification of an installation takes place with the help of a system known as mobile ad attribution. Attribution is used to track the details of each mobile ad transaction such as the time stamp of the ad click and the ad installation. Attribution is also used to keep track of the publisher whom a succeeding installation should be attributed to. Each click by a user is associated with the publisher’s app in which the click occurs. If there exist multiple clicks by a user before the installation of the advertised app, the latest attributed publisher will be paid by the advertiser due to the regulations of CPI pricing model.
4
1.2 Problem Definition
All these transaction and tracking activities are accomplished almost instantaneously in RTB marketplaces and they generate billions of dollars of revenue annually for mobile advertising industry. On the other hand, millions of dollars are lost because of the fraudulent activities of publishers receiving undeserved gain (Shields, 2016). Three main types of fraud in mobile advertising are (i) fake installations with bots and emulators, (ii) click injection, and (iii) click spamming. In the first type, using bots, fraudster tries to make fake installations more and more similar to genuine installations. In the second fraud type, fraudster’s spy app detects when other apps are downloaded on a device and trigger clicks right before the installation completes, which inequitably attributes the installation to the fraudster’s app. In the last type of fraud, fraudster executes clicks for lots of users who haven’t made them. If a user installs the advertised app organically after hearing about the app in another advertising channel (for instance, a TV commercial), this installation will still be attributed to the fraudulent publisher according to the working mechanism of attribution system. Click spamming is the most common fraud type in app marketing and its most apparent harm is lost campaign budget of advertisers, by paying to the click spammer publishers for users who have never generated impressions in the publisher’s app (Monasterio, 2017). Since click spamming captures organic traffic and then claims the credit for these users, it is also known as organic pouching.
Conversion Rate (CR) is a standard metric in app marketing that is calculated by dividing the total number of installations by the total number of clicks. A common characteristic of click spamming publishers is that their conversion rate is much lower than usual since spamming generates lots of false clicks which never end up with an installation. Although low CR is a good indicator for click spamming, a meaningful conversion rate emerges only after a significant campaign duration is completed and hundreds of thousands of clicks are attributed to the publisher. The lack of an early warning mechanism for click spamming causes the loss of considerable amount of campaign budgets for advertisers.
5
Another well-known way of identifying click spamming is to analyze the distribution of click-to-install times (CTIT) (Monasterio, 2017). Click-to-install time refers to the time difference between the click of a mobile app’s ad by a user and the first launch of the app on the mobile device of the same user after the installation. It is easy to note that the spamming publisher can trigger false clicks but cannot trigger an installation. This makes click and installation events independent from each other and causes the click-to-install times of installations coming from a click spamming publisher to be distributed uniformly over time. Because click injection is more a sophisticated version of click spamming, CTIT can also be a good indicator for injection. In click injection, the fraudster can monitor a user by the help of a spy app and capture the moment when the user starts to install application. Therefore, the fraudster can trigger a click just seconds before the installation is completed. This action causes the distribution of CTIT values to take a uniform shape like in the case of click spamming. Even though CTIT is known to be utilized intuitively by many advertisers for filtering out spamming and/or injecting publishers, to best of our knowledge, a prescribed set of rules for fraud detection with CTIT has not been defined in the literature so far. In this study, we aim to derive a statistical method for the detection of click spamming and/or injecting publishers in real time by analyzing their CTIT data building up over time.
The rest of the paper is organized as follows: In Section 2, we provide a brief literature review on the fraud detection methods in web and mobile advertising and the statistical methods related to our analysis. In Section 3, the method of multiple testing is explained. In Section 4, we discuss the details of how our customized multiple testing approach can be used for the detection of click spamming and/or click injection activities. In Section 5, we present the data set and the experimental results. In section 6, we conclude by summarizing our findings and discussing future research opportunities.
6
2. PREVIOUS WORK
Fraudulent activities in digital advertisement is a research topic that has been widely investigated in the marketing and computer science literature. Soubusta (2008) provides information of analysis on click spamming in online advertising. He explained what click fraud is and how it works. Also, several solutions are offered for click spamming in online advertising. For example, according to Soubusta (2008), price models such as pay per action or pay per percentages of impressions can decrease the loss based on click spamming. Also, this study provides clear understanding on the effects of click spamming on the web. Classification based approach was developed by Daswani et al. (2008) to explain online advertising and online frauds similarly Soubusta. They classify not only the revenue types but type of spam activities in online advertising. They explain syndication and referral deals, besides the well-known revenue models (cost per mille, cost per impression, and cost per action) for online advertising activities. According to Daswani et al. (2008) there are three main type of spams which are impression spam, click spam, and conversion spam. Furter, attack types, some countermeasures, and economics of click fraud are discussed in the same study.
There are different types of fraud. For example, impression fraud is basically caused by pay per view pricing model on the web. Springborn and Barford (2013) describe the characteristic of pay per view ecosystem and developed a method to distinguish fraudulent impressions from non-fraud ones. For developing this method, they made analysis of purchased traffic on websites and collected data from these websites. One of the most prevalent fraud type, which both web and mobile platforms suffer from, is click spamming. A lot of studies are conduced to understand the clicking behaviors. Hill et al. (2014) develops tools and techniques to detect invalid clicks in websites. They provide a system to obtain historical click quality characterization based on web analytic data. In this way, the system identifies click abnormities. Also, Perera et al. (2013) argues that
7
click patterns can be utilized to identify fraudulent activities. They provided an approach to detect fraud by using a set of features which are derived from existing attributes and used learning algorithms to understand differences of click patterns between fraud and legit publishers. The mobile advertising data are complex and include heterogeneous information, and complicated patterns with missing values. Therefore, Fraud Detection in Mobile Advertising (FDMA) 2012 Competition was organized. 127 teams joined the competition from more than 15 countries. Oentaryo et al. (2014) provided information about competition that include data set, task objectives and evaluation of results of competitors ranked in the first three places. According to competition results, data mining based fraud detection can be usable in practice. Immorlica et al. (2005) used machine learning techniques that are based on click through rates to detect click fraud in pay-per-click pricing model. Fraudsters usually conduct pay-per-click spamming on the web by disseminating malicious software (malware) that are capable of generating fake click on behalf of the infected users. Blizard and Livic (2012) outlined an example analysis of a click-spamming malware and showed that the malware can cause a loss on the order of hundreds of thousands of dollars for a 3-week period. Jain and Talwar (2007) argued that dual pricing can reduce the effects of fraudulent activities in real time auctions. Iqbal et al. (2018) presented a method for fighting click‐fraud by detecting botnets with automated clickers from the user side. They also evaluated the performance of their proposed method by integrating it into desktop operating systems. Zingirian and Benini (2018) showed a vulnerability of the pay-per-click model in web advertising and proposed a statistical tradeoff-based approach to manage this vulnerability. There are a lot of patents to find and/or identify click fraud on the web. One of them is provided by Kitts et al. (2008). They developed methods and systems to detect automated click fraud programs. When a request is received for a web page, the probability of being a genuine bot user is determined. A score is determined according to historic behavior of the related user. In this way, user who is human can be separated from the user who is bot. Another patent to prevent click fraud in online adverting is taken out by Linden and Teeter (2012). They provided a method that includes server side and client side codes to achieve their goal which is identification of valid and invalid clicks. Smith et al. (2011) developed systems and methods for detecting click spam in web advertising and patented this methodology.
8
Their system identifies normal users visiting a web site and determines an occurrence of spamming on the web site based on the identified normal users.
Pay-per-click pricing model of web advertising requires instant payment to the publisher upon click. Click spamming has a direct negative effect on the profitability of the advertisers on web advertising whereas in the CPI pricing model of mobile advertising, click spamming can affect an advertiser only if click ends up with an installation. Therefore, fraud in mobile advertising is a relatively new research area when compared with fraud in web advertising.
Mobile application markets have many freely distributed applications that are supported by in-app advertisements. Most of the fraudulent activities are performed by the publishers of these applications. Both placement fraud and bot fraud in these apps cause impression and unintentional clicks from users (Liu et al. 2014). Liu et al. (2014) investigated display fraud by analyzing UI of apps to detect unintentional clicks for increasing ad revenue. However, this technique cannot determine clicks that are triggered in the background. Unintended click can be performed both in foreground and background (Crussell et al. 2014).
Cho et al. (2015) made an automated click generation attack on eight popular ad networks and showed six of them vulnerable to this type of attacks. Cho et al. (2016) expanded their previous study. They suggested defense mechanisms and discussed economic aspect of security failure. Dave et al. (2012) conducted large-scale measurement study on major ad networks about click spamming and proposed a methodology to measure click spamming rate for advertisers. Badhe (2016) suggested a new system which consists of a server side solution for click fraud. Badhe (2016) offered an exchange mechanism that scans the ads before passing them over to the end mobile device. This mechanism provides checking for any auto redirection to different domain from initial domain where all ad assets requested. However, ad exchanges have to deal with billions of ads daily. Checking these ads one by one could be infeasible. This problem can be solved with taking random sampling according to Badhe (2016). Gupta et al. (2014) discloses different types of mobile frauds. They argued the source of requests may be used for
9
distinguishing valid and invalid requests in order to detect frauds. Monasterio (2017) proposed a histogram for the click-to-install time distribution of non-fraudulent publishers and utilizes a fitting test to tag click spamming activities. However, this fitting test method can only be utilized at the end of ad campaign duration and cannot be used in real time.
10
3. MULTIPLE TESTING
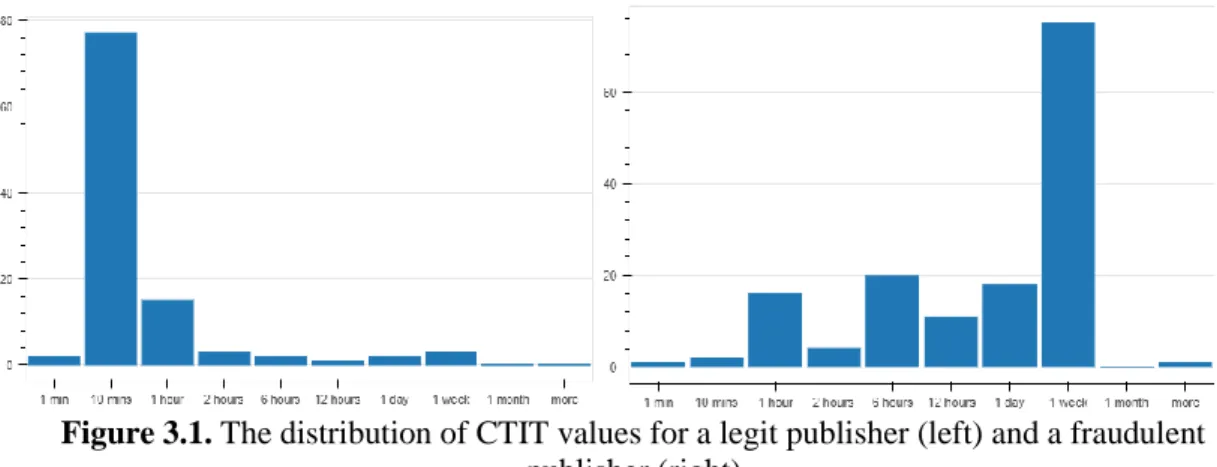
In this chapter, the statistical methods to detect frauds is examined and suitability of multiple testing in our case is discussed. Let us first introduce the histogram of click-to-install time (CTIT) values for two publishers as an example of how the distribution of CTIT values may differ in legit and fraudulent publishers. In Figure 3.1, the histogram on the left shows the distribution of click-to-install times for a legit publisher. It can be noted that most of the installations are accomplished within the first hour after the click event occurs since they decide to install and launch the app shortly after they deliberately click the publisher’s ad. The histogram on the right, on the other hand, demonstrates the distribution of click-to-install times for a fraudulent publisher. This publisher spams lots of users with lots of clicks, and a few users unaware of this click event (and, thus, the advertised app) will occasionally install the app after hearing about it from other marketing channels or via word of mouth. Hence, the time between click and installation events can be weeks, or even months, which results in a hump on the right of the graph of fraudulent publisher.
Figure 3.1. The distribution of CTIT values for a legit publisher (left) and a fraudulent
publisher (right)
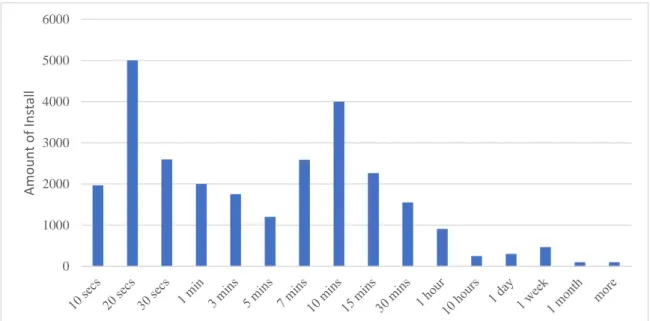
Publishers dealing with click injection can also be distinguished from legit publishers via distribution of CTIT values like in the case of click spamming. In Figure 3.2, the histogram belongs to a publisher who engages in click injection. There is an abnormal hump at the left of the graph (second bar in the histogram) due to the nature of the click
11
injection. A click injection fraudster can trigger a click after the installation. Therefore, the time between click and first launch is usually inclined to be less than 20 seconds. This is the reason of CTIT values accumulated on the left side of the histogram.
Figure 3.2. The distribution of CTIT values for a fraudulent publisher (click injection)
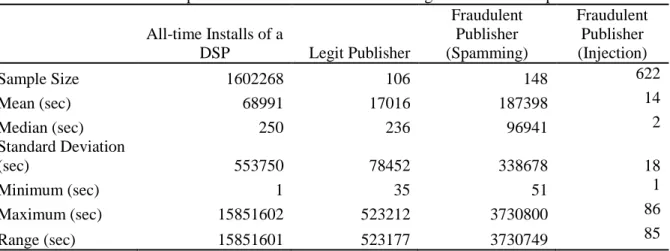
Another interesting fact about the distribution of click-to-install times lies behind the descriptive statistics of these values. Table 3.1 provides the sample size, mean, standard deviation, median, and range for the CTIT values of the same two publishers discussed earlier. The table also shows the statistics for the all-time installations of a DSP company for benchmark purposes. The mean of CTIT vales for a legit publisher can still be very high (approximately 4.75 hours) due to a few installations with very high CTIT values. This situation is not an indicator of click spamming since some users forget to launch a mobile application after the installation and thus even non-fraudulent publishers may rarely run across very high CTIT values. Therefore, “mean” is not a reliable statistic to make any deduction about spamming. The median value of fraudulent publisher, on the other hand, is quite large compared to the medians of DSP and legit publisher according to the table. Indeed, a very large median (approximately 27 hours in this instance) means that at least half of the sample has an unacceptable level of CTIT. A large median value also explains why the histogram of the fraudulent publisher is skewed to the right in Figure 3.1. Further, the median value of the fraudulent publisher who makes click injection is quite small. These results suggest that a statistical test measuring the positive
0 1000 2000 3000 4000 5000 6000 Am o u n t o f I n sta ll
12
deviations from a sufficiently large or small “median” can be confidently used to detect fraud publishers.
The non-parametric sign test for a median (Sprent, 1989) with 𝐻0: 𝜂 = 𝜂0 and 𝐻𝑎: 𝜂 > 𝜂0 (or 𝐻𝑎: 𝜂 < 𝜂0) is an effective way of deciding whether the median of CTIT values for a publisher (𝜂) takes on a particular value (𝜂0) or a value greater (or less) than 𝜂0. The main question here is how to decide 𝜂0. We have to select a sufficiently large value for 𝜂0 such that we can safely accuse the publisher of spamming if the null hypothesis is rejected. Similarly, sufficiently small value has to be selected to accuse publisher of making click injection.
Table 3.1. The descriptive statistics of CTIT values for legit and fraudulent publishers
All-time Installs of a DSP Legit Publisher Fraudulent Publisher (Spamming) Fraudulent Publisher (Injection) Sample Size 1602268 106 148 622 Mean (sec) 68991 17016 187398 14 Median (sec) 250 236 96941 2 Standard Deviation (sec) 553750 78452 338678 18 Minimum (sec) 1 35 51 1 Maximum (sec) 15851602 523212 3730800 86 Range (sec) 15851601 523177 3730749 85
The following sign tests are designed to detect two main types of mobile fraud. While the test (1) is for click spamming, the second test is for click injection.
𝐻0: 𝜂 =𝜂0 seconds 𝐻𝑎: 𝜂 >𝜂0 seconds
𝐻0: 𝜂 =𝜂0 seconds 𝐻𝑎: 𝜂 <𝜂0 seconds
However, our analysis shows that, when the test is applied for the all-time installs of a publisher (all the installations attributed to a publisher during the lifetime of an ad campaign), there is a significant chance of the publisher passing the test even though it is fraudulent (i.e. probability of type-II error is large). This situation occurs mainly because some publishers mix both click spamming and legit activities together in order to disguise
13
their fraud. Therefore, it is possible for a fraudulent publisher to have remarkable number of very large CTIT values even though the median CTIT value is still less than 𝜂0 seconds (or greater than 𝜂0 seconds in click injection case). Besides, conducting the test for the all-time installations of a publisher would mean to evaluate the publisher after an ad campaign has ended. Filtering out a spamming publisher from future campaigns is still beneficial in the long run, but it cannot prevent the advertiser from paying for the installations that are already attributed to the fraudster at the recent campaign.
One way to overcome these challenges is multiple testing, the testing of more than one independent hypothesis. In multiple testing, instead of running a single sign test for a publisher at the end of campaign duration, we periodically run sign tests as new installations arrive from the publisher. This enables us to detect even occasional click spamming activities of fraudulent publishers in earlier stages of the campaign.
However, if one plans to make a decision by applying multiple testing, s/he should be extra cautious about false-positive decision making. Assuming that the type-I error of a single sign test is 𝛼, the probability of not making type-I error is (1 − 𝛼) because they are complementary events. For instance, if significance level 𝛼 = 0.10, then not making type-I error is (1 − 𝛼) = (1 − 0.10000) = 0.90000. Let say we have two independent tests with 𝛼 = 0.10000. Probability of not making type-I error for both of them is 0.90000 ∗ 0.90000 = 0.81000. For three independent tests, the probability will be 0.90000 ∗ 0.90000 ∗ 0.90000 = 0.72900. The probability of not making type-I error for m independent tests is calculated with (1 − 𝛼)𝑚. Therefore, the probability of at least one false positive error among 𝑚 independent sign tests (family-wise error rate) is 𝛼̅ = 1 − (1 − 𝛼)𝑚. This means that the probability of having at least one rejected null hypothesis converges to 1 as the number of tests increases. In other words, if we assume one rejected null hypothesis in multiple testing is adequate to accuse a publisher of click spamming, we will falsely blame the publisher for fraud even though it is most probably legit.
In the literature, there are classical multiple testing methods such as Šidák correction (Šidák, 1967), Holm method (Holm, 1979), and Bonferroni correction (Bland and Altman, 1995), which prevent large probability of rejecting some of the true null
14
hypotheses. Also, we developed a new procedure to make sure limited family-wise error rate at acceptable level.
3.1 Šidák Correction Method
The method is utilized to avoid problem of multiple comparisons. It is one of the simple methods to keep family-wise error rate for independent tests under control. The 𝑚𝑡ℎ null hypothesis is rejected, when p-value is less than 𝛼̅ = 1 − (1 − 𝛼)1/𝑚 for each test. If all null hypotheses are true, type-I error will be exactly 𝛼. For example, let’s say we have 3 independent null hypotheses and 𝛼 = 0.05000. Family-wise error is calculated as 0.05000, 0.02532 and 0.01695 respectively. If the p-values of matching tests are greater than the corresponding 𝛼̅, type-I error is equal to 0.05000. In addition, confidence interval is calculated as 100(1 − 𝛼)1/𝑚 for matching test decision.
3.2 Bonferroni Correction Method
This method is used for exactly the same reason as in Šidák method. Holm developed the method originally in 1979. In Holm method, significance level is divided by both total number of the independent tests and the index 𝑘, which is used if the first p-value is not low enough to validate rejection at 𝛼̅ =𝑚+1−𝑘𝛼 . This index is accepted as 1 in Bonferroni Correction. Therefore, the family-wise error controls with 𝛼̅ =𝑚𝛼. This means that if the p-value of 𝑚𝑡ℎ test is less than 𝛼
𝑚, 𝐻0 (𝑚)
that represents the null hypothesis of mth test is rejected, otherwise 𝐻0(𝑚) fails to be rejected. Table 3.2 presents the calculated family-wise error rates by Šidák and Bonferroni methods when 𝛼 is assumed to be 5%. The first column shows the number of tests. The family-wise error rates of Šidák method according to varying total number of tests is shown in the second column, while the rates of Bonferroni method are demonstrated in the third column. As seen in the table, the family-wise error for a single test is the same for both correction methods. However, family-family-wise error rate that is calculated with Bonferroni method is always less than the family-wise
15
error rate of Šidák method after the first test. Šidák method is slightly less stringent than Bonferroni correction.
Table 3.2. Family-wise error rates for Šidák and Bonferroni methods
Number Šidák Bonferroni of Test 1 0,05000 0,05000 2 0,02532 0,02500 3 0,01695 0,01667 4 0,01274 0,01250 5 0,01021 0,01000 6 0,00851 0,00833
3.3 Method of Successive Runs
In this study, we propose a new multiple testing procedure that has an improved ability to detect click spamming fraud compared to these classical methods, while still keeping the confidence of the procedure (i.e. probability of not making false-positive decisions) sufficiently high.
In our multiple testing procedure, we run successive sign tests in real time while the campaign is still running. In other words, we run a sign test given in (1) for every 𝑛 installations of a publisher to monitor the legitimacy of its installations. If we had decided the publisher is fraudulent by only one rejected null hypothesis in multiple testing, as mentioned earlier, we would have made a considerable number of false-positive decisions. Instead, in our procedure, we aim a family-wise error rate of α̅ = 0.05000 in the worst-case.
In our study, the multiple testing procedure for detecting click spamming activity has been implemented in two steps as follows.
STEP 1. We assume the significance level of α = 0.05000 for each sign test for median, whose sample size is selected to be n = 10. Namely, we run the
16
hypothesis test of (1) for every 10 incoming installations and conduct m < ⌈N/10⌉ tests in total, where N is the total number of installations attributed to the publisher during the campaign duration.
STEP 2. We define a rule which identifies the spamming publishers due to the result of m sign tests with a family-wise error rate of α̅ = 0.05000. According to the rule, a publisher is determined to be fraudulent if it fails r successive sign tests, each with a significance level of α, among m tests. We do not have to run these tests till the end of the campaign duration (i.e. m does not have to be equal to ⌈N/10⌉) since we may run across r successive rejected hypotheses in earlier stages of the campaign. Note that the value of r has to be updated as the number of tests (m) increases with the incoming installations. If we set a constant value for r, the family-wise error rate would continuously increase and eventually be much higher than our target value, α̅ = 0.05000, as the number of tests, m, increases.
In order to compute the value of r for varying levels of m, we need to utilize the theory of success runs introduced by Feller (1968). Let r be a positive integer and let ε denote the occurrence of a success run of length r in m Bernoulli trials, each with a success probability of α. According to Feller (1968), the probability of no success run of length 𝑟 in 𝑚 trials (denoted by 𝑞) can be approximated by Eq. (3)
𝑞 ≈ 1 − 𝛼𝑥
(𝑟 + 1 − 𝑟𝑥)(1 − 𝛼)∙ 1 𝑥𝑚+1 where x is the positive root of Eq. (4), which is not equal to 1 − α.
1 − 𝑥 + (1 − 𝛼)𝛼𝑟𝑥𝑟+1 = 0
Hence, the probability of at least one success run of length 𝑟 in 𝑚 trials is given by 𝑝 = 1 − 𝑞.
For example, assume we conclude a publisher's median CTIT is greater than 2 hours (i.e. the publisher is fraudulent) if the null hypotheses of 𝑟 = 3 successive sign tests are rejected among 𝑚 = 300 tests. When we let 𝛼 = 0.05 and 𝑟 = 3 in Eq. (4), 𝑥 can be found as 1.000119. Replacing this value of 𝑥 in Eq (3), the probability of falsely concluding the publisher to be fraudulent (family-wise error rate) can be calculated as 𝛼̅ = 𝑝 = 0.0348.
(4) (3)
17
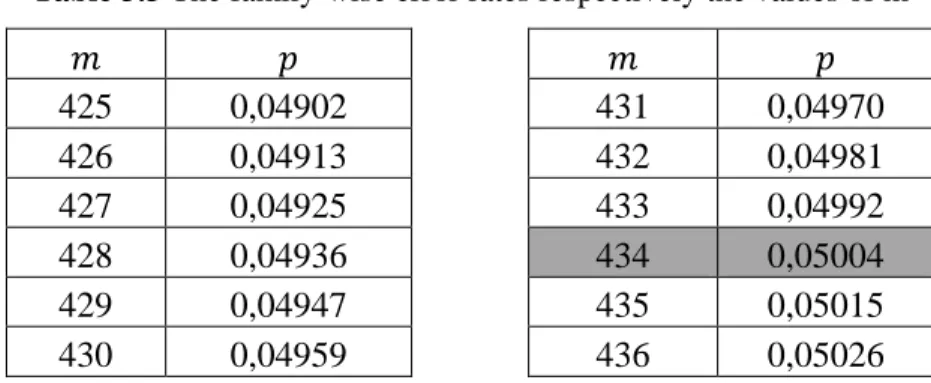
In the second step of our procedure, we determine the rule of how many successive rejected hypotheses are enough for concluding a publisher is a spammer for different numbers of tests. The main objective of this rule is to guarantee that the probability of falsely accusing the publisher does not exceed a family-wise error rate of α̅ = 0.05000. For example, for 𝑟 = 3, we look for the value of “𝑚” which makes 𝑝 close to 𝛼̅ = 0.05000 as much as possible. For varying values of 𝑚 in Eq (3), the value of 𝑝 = 𝑞 − 1 is given in Table 3.3. As it can be noted in the table, 𝑝 can get the value which is closest to 𝛼̅ = 0.05000, when 𝑚 = 434.
Table 3.3 The family-wise error rates respectively the values of m
𝑚 𝑝 𝑚 𝑝 425 0,04902 431 0,04970 426 0,04913 432 0,04981 427 0,04925 433 0,04992 428 0,04936 434 0,05004 429 0,04947 435 0,05015 430 0,04959 436 0,05026
Table 3.4 tabulates how the rule is being applied. 𝑚̅ represents the number of tests required to have a successive rejected hypothesis of length 𝑟 with a probability of α̅ = 0.05. [𝑚𝑙, 𝑚𝑢] denotes the interval for the total number of tests where successively rejected hypotheses of length r are sought for click spamming. According to Table 3.4, our multiple testing procedure works as follows. When the first 10th installation attributed to a publisher is registered, we run the sign test given in (1) for the CTIT values of this sample. If the null hypothesis is rejected, we conclude that the publisher is a click spammer (since 𝑚 = 1 when 𝑟 = 1). Otherwise, we wait until another 10 installations are registered. When the next 10 installations are accumulated, we run the sign test again for the second set of 10 installations. Starting from the 2nd sign test to the 22nd test, we search for 2 successively rejected hypotheses. If we observe any “two rejected hypotheses in a row” until the 22nd test, we conclude that the publisher is a click spammer. Otherwise, we continue to monitor the installations attributed to the publisher. Likewise, we search for 3 successively rejected hypotheses from the 23rd test to the 434rd test, and 4 successively rejected hypotheses from the 435th test to the 8524th test. We have never needed to go beyond the 8524th test, since none of the publishers in our experiment has
18
more than 8524 ∗ 10 attributed installations. If we conclude that a publisher is fraudulent at any point according to this procedure, the decision is guaranteed to have a false-positive error that is at most equal to the family-wise error rate of α̅ = 0.05000. If we do not observe any “𝑟 rejected hypotheses in a row” during the course of our procedure, we can conclude that there has not been enough evidence that the publisher is a click spammer.
Table 3.4. The rule of multiple testing procedure
𝑟 𝑚̅ [𝑚𝑙, 𝑚𝑢]
1 1 [1,1]
2 22 [2,22]
3 434 [23,434] 4 8524 [435,8524]
3.4 Accuracy Test for Method of Successive Runs
We will now discuss the results of our accuracy tests conducted with a data set of app installations attributed to several publishers. This data set was supplied by a DSP company which provides a self-service mobile advertisement platform to its customers for managing their own ad campaigns. In our experiment, we run the tests with 30 publishers from 30 different ad campaigns. Half of the publishers have been blacklisted as click spamming publishers by the DSP company due to prior experience. The remaining 15 publishers are known to be non-fraudulent that always bring in legitimate installations.
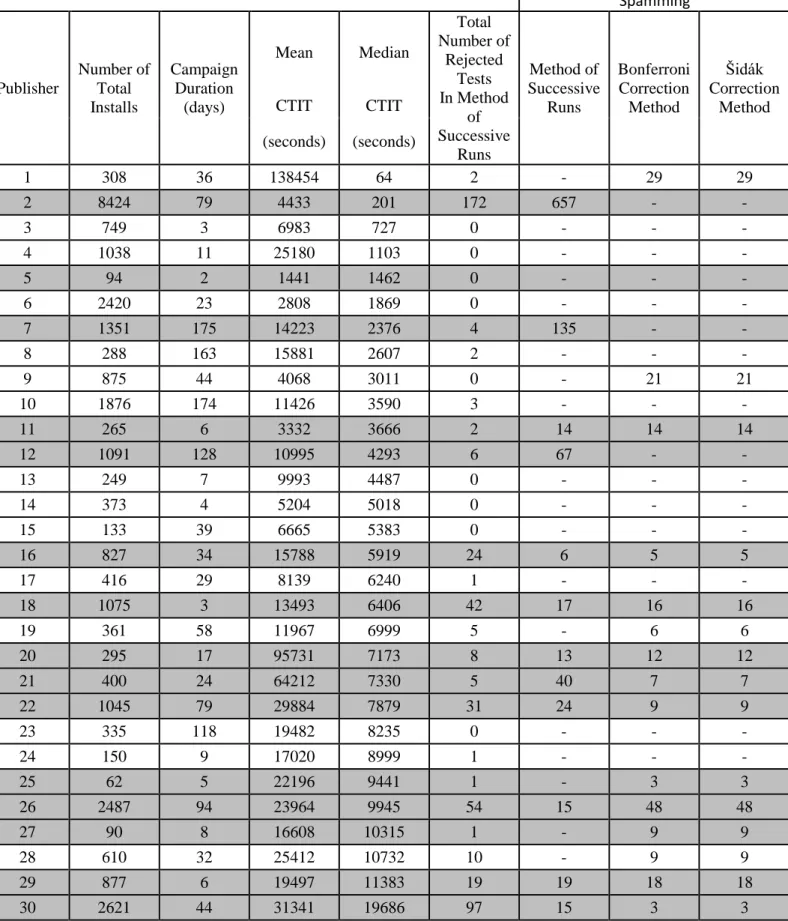
Table 3.5 summarizes the data used and shows the results of our test. Each publisher is represented with a row in the table. The grayed-out rows denote the publishers that are in fact fraudulent. The first five columns provide the publisher ID, the number of total installations during the campaign, the campaign duration, the mean value of all CTITs during the campaign, and the median value of all CTITs, respectively. The sixth column shows the total number of rejected tests during the campaign when we were applying method of successive runs. The number of rejected tests does not have to be zero for a non-fraudulent publisher. For example, first publisher is not identified as fraudulent,
19
although it has a total of 2 rejected tests. The reason it is not marked as a click spammer is that the rejected tests are not successive. The last column which has three parts specifies the order of the first test indicating a click spamming activity. The first part shows our method, the second one represents Bonferroni, and the last one is for Šidák. For instance, the second publisher is accused of click spamming for the first time in its 657 ∗ 10 = 6570th attributed installation with method of successive runs, since r= 4 consecutively rejected tests are observed at the 657th test in our multiple testing procedure. A dash sign (“−”) in the sixth column indicates that any evidence of click spamming has not been found during the campaign.
According to the results of the experiment, our multiple testing procedure does not make any false-positive error. In other words, none of 15 legit publishers is accused of click spamming. Since we design the procedure in such a way that it does not have a false-positive error greater than the family-wise error rate of α̅ = 0.05000, this is an expected outcome. On the other hand, in three tests, we observed false-positive errors which were made by Šidák and Bonferroni Corrections. As seen in the Table 3.5, even though Publisher 1, 9, 19 and 28 are legit publishers in reality, they are marked as fraud by Šidák and Bonferroni Correction methods. For example, the first publisher is found as a spammer in the 29th test by both of them because all ten installations for the test came after the first two-hour period and the p-value of the 29th test is calculated as 0.00098. The family-wise error which belongs to this test is α̅ =0.05
29 = 0.00172 for Bonferroni method, α̅ = 1 − (1 − 0.05)291 = 0.00177. Therefore, 𝐻
0 (29)
, which is the null hypothesis of 29th test is rejected and the publisher looks like a spammer. Even though, 𝐻0(29) was rejected, the publisher was found legit in our method because of our rejection rule. As seen in Table 3.5, there are 2 reject decisions in method of successive runs, 3 successive rejects are needed to accuse someone of being a fraud after the 22nd test. Hence, since at least one of the 28th and 30th, or 30th and 31st tests were not rejected, our procedure decided the publisher is legit correctly.
20
Table 3.5. Accuracy Test Results
The Order of the Test Indicating Click Spamming Publisher Number of Total Installs Campaign Duration (days) Mean Median Total Number of Rejected Tests In Method of Successive Runs Method of Successive Runs Bonferroni Correction Method Šidák Correction Method CTIT CTIT (seconds) (seconds) 1 308 36 138454 64 2 - 29 29 2 8424 79 4433 201 172 657 - - 3 749 3 6983 727 0 - - - 4 1038 11 25180 1103 0 - - - 5 94 2 1441 1462 0 - - - 6 2420 23 2808 1869 0 - - - 7 1351 175 14223 2376 4 135 - - 8 288 163 15881 2607 2 - - - 9 875 44 4068 3011 0 - 21 21 10 1876 174 11426 3590 3 - - - 11 265 6 3332 3666 2 14 14 14 12 1091 128 10995 4293 6 67 - - 13 249 7 9993 4487 0 - - - 14 373 4 5204 5018 0 - - - 15 133 39 6665 5383 0 - - - 16 827 34 15788 5919 24 6 5 5 17 416 29 8139 6240 1 - - - 18 1075 3 13493 6406 42 17 16 16 19 361 58 11967 6999 5 - 6 6 20 295 17 95731 7173 8 13 12 12 21 400 24 64212 7330 5 40 7 7 22 1045 79 29884 7879 31 24 9 9 23 335 118 19482 8235 0 - - - 24 150 9 17020 8999 1 - - - 25 62 5 22196 9441 1 - 3 3 26 2487 94 23964 9945 54 15 48 48 27 90 8 16608 10315 1 - 9 9 28 610 32 25412 10732 10 - 9 9 29 877 6 19497 11383 19 19 18 18 30 2621 44 31341 19686 97 15 3 3
21
Although there are 4 type-I errors that are found by Šidák and Bonferroni Correction methods, publisher 25 is detected by these methods unlike the method of successive runs. Since Šidák and Bonferroni Correction methods slightly stringent than method of successive runs, they detect most of the fraudulent publishers earlier than our method. However, they have much higher type-I error rates. For example, while publisher 21 is detected with the last installation by our method, Šidák and Bonferroni Correction methods detected it earlier with the 7th test. As seen in the table, the orders of all of the test indication click spammers are the same for Šidák and Bonferroni, because values of the family-wise error are close to each other. For instance, the family-wise error of the third test is 0.01695 for Šidák Correction, while it is 0.01667 for Bonferroni method.
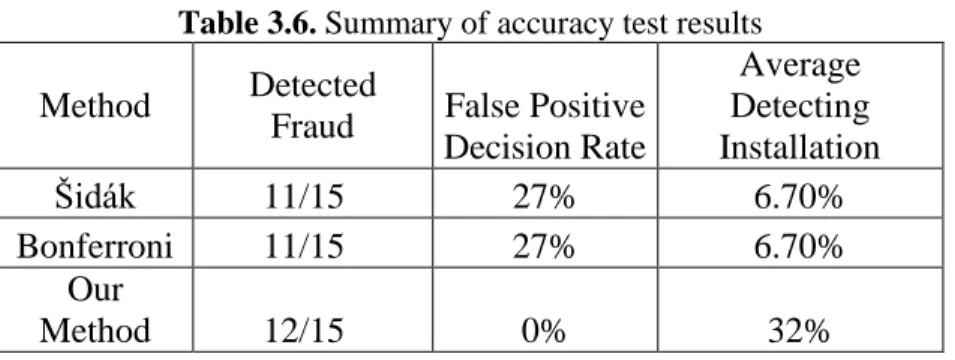
As seen Table 3.6, the results also indicate that while 12 out of 15 fraudulent publishers have been successfully detected with method of successive runs, Šidák and Bonferroni correction methods have detected 11 out of 15 fraudulent publishers. On average, while we detect the click spamming activities before 32% of the entire set of installations have arrived with the method of successive runs, click spamming activities are detected before 6.70% of the total installations have arrived with the other methods. In the best case (Publisher 30), the click spamming is detected before (15 ∗ 10)/2621 = 6% of the total installations have arrived. The best case of the other methods is observed in the case of the same publisher. The spammer is detected before (3 ∗ 10)/2621 = 1.14% of the total installations have arrived. In the worst case for our method (Publisher 21), the click spamming can be detected only after (40 ∗ 10)/400 = 100% of the total installations have arrived. Publisher 27 is detected after the last installation is arrived, being the worst case of Šidák and Bonferroni methods. This result suggests that we have recognized that Publisher 21 and 27 are fraudsters at the very end of the ad campaign. Even though the detection of these spamming publishers does not help us in this experimented campaign, filtering out the publisher from the future campaigns will protect us against its prospective fraud. Apart from these results, Publisher 2 is also worth mentioning because it is blacklisted as click spammer in spite of its relatively low median CTIT value. If we had conducted the sign test for once with the all-time installations of this publisher, we would have concluded it is not fraudulent due to the median CTIT of 201 seconds. This example shows why the multiple testing procedure is superior to single testing.
22
Table 3.6. Summary of accuracy test results
Method Detected
Fraud False Positive Decision Rate Average Detecting Installation Šidák 11/15* 27% 6.70% Bonferroni 11/15* 27% 6.70% Our Method 12/15* 0% 32%
On the other hand, we fail to detect the click spamming activities of the remaining four fraudulent publishers (Publisher 5, 24, 25, and 27) by our method. Publisher 2, 5, 7, 12 could not be detected by the other methods during their campaign period, which makes the false-negative error rate of the experiment to be β̅ = 11/15 = 73%. The common characteristic of all four publishers 5, 24, 25, and 27, whose click spamming activities have not been detected, is the low number of installations due to the short campaign duration. We observe that most of the clicks attributed to these publishers had not ended up with installations at the time point we collected their data for our experiment. Note that the bid price is still paid to publishers, if the click event takes place during the campaign interval regardless of the time of the installation event. Most probably, these clicks will never yield a legit installation, but can still bring in undeserved money for these publishers if any user installs the advertised app organically via another advertising channel. On the other hand, common characteristic of the other publishers whose fraudulent activities are not detected is that their spam attacks started near the end of the campaign durations except Publisher 5. This situation is based on the nature of Šidák and Bonferroni Correction methods. In these methods family-wise errors decrease continuously. However, p-value of tests has a limit to decrease because of the sample size. Hence, if the sample size is 10 for tests, p-value can be 0.00098 in the worst case when all ten installations have arrived after at least 2-hours from the related click. After a certain amount of testing, family-wise error will be always smaller than the p-value. Therefore, null hypothesis will not be rejected after that point because of the reject rule which says that the null hypothesis is rejected, if the p-value is bigger than family-wise error for that test. While family-wise error for Bonferroni method is always smaller than the p-values of tests after the 52nd test whose p-value is 0.00096, limit for Šidák method is 53rd test with 𝛼̅ =0.00097. After 53rd test, p-value of test will consistently be greater
23
than family-wise error independently from CTITs. For example, family-wise error is calculated as 𝛼̅ = 0.00050 with Bonferroni method for the 100th test. The publisher cannot be accused of being fraud even if the CTITs of 10 installations are greater than 2-hours because p-value of 0.00098 is greater than α̅ = 0.00050. Even though Šidák and Bonferroni methods are useful for short-term campaigns, they are useless for long term campaigns and for publishers who have approximately more than 530 installations in a campaign because of their stringency.
Unfortunately, for the short-term campaigns, our multiple testing procedure is not likely to detect the click spamming publishers since high-valued CTITs indicating spamming have not yet been generated at the time we collect the data. Nevertheless, these campaigns are short-dated and usually bring relatively small number of falsely-attributed installations from their publishers. Hence, we can safely assume the total loss due to these installations is still in an acceptable level.
24
4. DETECTION OF FRAUD USING MULTIPLE TESTING
In this section, steps of detecting click spamming and click injection are explained. Insufficiency of using single testing is showed in the previous section. Mean of CTITs is not a useful source to detect frauds. Even median of CTITs which gives a better understanding of the publishers’ actions can mislead the advertisers when they decide fraudulent activities. For example, while having a median that is bigger than 2-hour can be proof of click spamming, having a small median does not guarantee that the publisher is not a spammer. Therefore, using non-parametric single sign test for median of CTITs can cause type-II errors often in the case of small median of CTITs. On the other hand, multiple testing is better than in terms of both type-I and type-II errors. Moreover, multiple testing methods provide an opportunity to test the publisher in real time unlike using fitting test for detection of fraud. The end of campaign duration has to be waited to make fitting test. This causes loss during the campaign durations. On the other hand, fraudsters can be detected during the campaign duration and they can be blocked to prevent financial losses with multiple testing methods through applicability in real time. The method of successive runs is better than other correction methods of multiple comparison because of the limitations of Šidák and Bonferroni methods. These methods do not have ability to detect frauds in long term campaign durations and for the publishers who have more than 530 installations in a campaign. Furthermore, these methods are vulnerable in terms of type-I errors unlike our method. Type-I error is a more dangerous error than type-II. That is because, while type-I error represents accusing a publisher who is legit of being fraud, type-II error means that a publisher who is a fraudster in reality is found legit. Even though a publisher is found legit falsely in a campaign (type-II error), it can be detected in the other campaigns. However, if a publisher is detected as a fraud, it is blocked permanently. Therefore, there is no compensation for making type-I error. This is the reason for selecting method of successive runs to detect fraud types in this chapter instead of other methods. Also, publishers should be evaluated campaign by campaign because legit publishers can decide to start fraudulent activities after a while.
25
Therefore, every installation should be examined for both click spamming and click injection.
4.1 Detection of Click Spamming
In this chapter, detection of click spamming is explained step by step. The method of successive runs is utilized to detect spammers. Pseudocode is shown in below:
Start Campaign 𝑛
Set 𝐼𝑛𝑠𝑡𝑎𝑙𝑙 𝐶𝑜𝑢𝑛𝑡𝑒𝑟 = 0 Set 𝑀𝑖𝑛𝑢𝑠 = 0
For each arriving installation for 𝑛th campaign o 𝐼𝑛𝑠𝑡𝑎𝑙𝑙 𝐶𝑜𝑢𝑛𝑡𝑒𝑟 = 𝐼𝑛𝑠𝑡𝑎𝑙𝑙 𝐶𝑜𝑢𝑛𝑡𝑒𝑟 + 1 o 𝐶𝑇𝐼𝑇𝑖𝑘𝑛= 𝐼𝑛𝑠𝑡𝑎𝑙𝑙 𝑇𝑖𝑚𝑒𝑖𝑘𝑛− 𝐶𝑙𝑖𝑐𝑘 𝑡𝑖𝑚𝑒𝑖𝑘𝑛 o For each test 𝑡 ∈ 𝑇
If 𝐼𝑛𝑠𝑡𝑎𝑙𝑙 𝐶𝑜𝑢𝑛𝑡𝑒𝑟 % 10 = 0 o 𝑆𝑖𝑔𝑛 = 𝐶𝑇𝐼𝑇𝑖𝑘𝑛𝑡 − 7200 o If 𝑆𝑖𝑔𝑛 < 0 𝑀𝑖𝑛𝑢𝑠 = 𝑀𝑖𝑛𝑢𝑠 + 1 Calculate 𝑃𝑣𝑎𝑙𝑢𝑒 of Test 𝑡 𝑃𝑣𝑎𝑙𝑢𝑒(𝑡) = ∑ (𝑠𝑎𝑚𝑝𝑙𝑒 𝑠𝑖𝑧𝑒 𝑘 )𝑝𝑘(1 − 𝑝)𝑠𝑎𝑚𝑝𝑙𝑒 𝑠𝑖𝑧𝑒−𝑘 𝑀𝑖𝑛𝑢𝑠 𝑘=0 If 𝑡 = 1 o If 𝑃𝑣𝑎𝑙𝑢𝑒 (1) < Publisher 𝑘 is a fraudster Block Publisher 𝑘 o Else
Wait for the next ten installs and conduct Test 2
If 𝑡 ≥ 2
26
Publisher 𝑘 is a fraudster Block Publisher 𝑘 o Else
Wait for the next ten installs and conduct Test 𝑡 + 2 If 𝑡 > 22 o If 𝑃𝑣𝑎𝑙𝑢𝑒(𝑡) < & 𝑃𝑣𝑎𝑙𝑢𝑒(𝑡 + 1) < & 𝑃𝑣𝑎𝑙𝑢𝑒(𝑡 + 2) < Publisher 𝑘 is a fraudster Block Publisher 𝑘 o Else
Wait for the next ten installations and conduct Test 𝑡 + 3 If 𝑡 > 434 o If 𝑃𝑣𝑎𝑙𝑢𝑒(𝑡) < & 𝑃𝑣𝑎𝑙𝑢𝑒(𝑡 + 1) < & 𝑃𝑣𝑎𝑙𝑢𝑒(𝑡 + 2) < & 𝑃𝑣𝑎𝑙𝑢𝑒(𝑡 + 3) < Publisher 𝑘 is a fraudster Block Publisher 𝑘 o Else
Wait for the next ten installations and conduct Test 𝑡 + 4 If 𝑡 > 8524 o If 𝑃𝑣𝑎𝑙𝑢𝑒(𝑡) < & 𝑃𝑣𝑎𝑙𝑢𝑒(𝑡 + 1) < & 𝑃𝑣𝑎𝑙𝑢𝑒(𝑡 + 2) < & 𝑃𝑣𝑎𝑙𝑢𝑒(𝑡 + 3) < & 𝑃𝑣𝑎𝑙𝑢𝑒(𝑡 + 4) < Publisher 𝑘 is a fraudster Block Publisher 𝑘 o Else
Wait for the next ten installations and conduct Test 𝑡 + 5
If the publisher 𝑘 passes from all tests o Publisher 𝑘 is legit
27
𝐶𝑇𝐼𝑇𝑖𝑘𝑛: Click-to install time of 𝑖𝑡ℎ installation from publisher 𝑘 for campaign 𝑛 𝑀𝑖𝑛𝑢𝑠: Number of negative values which are calculated from 𝐶𝑇𝐼𝑇𝑖𝑘𝑛=
𝐼𝑛𝑠𝑡𝑎𝑙𝑙 𝑇𝑖𝑚𝑒𝑖𝑘𝑛− 𝐶𝑙𝑖𝑐𝑘 𝑡𝑖𝑚𝑒𝑖𝑘𝑛
𝑇: the set of tests for publisher 𝑘 from 1 to 𝑡𝑜𝑡𝑎𝑙 𝑛𝑢𝑚𝑏𝑒𝑟 𝑜𝑓 𝑖𝑛𝑠𝑡𝑎𝑙𝑙 𝑜𝑓 𝑝𝑢𝑏𝑙𝑖𝑠ℎ𝑒𝑟 𝑘 𝑓𝑜𝑟 𝑐𝑎𝑚𝑝𝑎𝑖𝑔𝑛 𝑛 𝑠𝑎𝑚𝑝𝑙𝑒 𝑠𝑖𝑧𝑒
As mentioned earlier, every installation should be examined one by one for each publisher in each campaign and sub campaign. First of all, a click-to-install time is calculated for each new-coming installation and stored in CTIT(t). This calculation has to be done for every installation. Then it is waited until the number of installations reach the number of sample size to do the testing. Sample size is defined as 10 by the trial and error method. 10 as a sample size is big enough to understand the intention of the publisher and small enough to decide quickly and safely. After the first 10 installations have arrived, first non-parametric sign test is made. As seen in the pseudocode, the first requirement of the sign test is the determination of the sign of the test members. In our procedure, the equation 𝐶𝑇𝐼𝑇𝑖𝑘𝑛𝑡 − 𝑇𝑖𝑚𝑒 is used to define sign of test members. The important matter is defining Time to make the decision correctly. Therefore, we observe the distribution of CTIT values for several publishers and note that, if publisher, 70-75% of app installations typically occur during the first hour, 80-85% of installations during the first two hours and 90-95% of installations in the first 24 hours following a click event. Monasteriao (2017) presents the histogram of CTIT values for one-day worth of installations in a non-fraudulent scenario and arrives at the same conclusion that most of the users’ installations occur in the first hour after the click.
In the light of these facts, we designed the following sign test for the median of CTIT values of a publisher.
H0: η(t) = 7200 seconds Ha: η(t) > 7200 seconds
In this test, η0 = 7200 is adequately large that enables us to safely assume the publisher is fraudulent if the null hypothesis is rejected (i.e. probability of type-I error is small). Hence, Time = 7200 seconds. If CTIT is bigger than Time, the sign will be positive. If CTIT is less than Time, the sign will be negative. If CTIT is equal to Time, the sign will
28
be neutral. For detection of click spamming, only the number of negative ones which is represented with Minus in pseudocode is important because binomial distribution is utilized to calculate the p-value. Cumulative distribution function of binomial distribution is 𝑓(k, n, p) = P(x ≤ k) = ∑ (𝑛𝑖)𝑝𝑖(1 − 𝑝)𝑛−𝑖
𝑘 𝑖=0
where k represents the number of successes occurring among m trials with probability p. In our procedure, the number of successes is number of negative sign (Minus) and number of trials is equal to 10. In addition, the probability is 0.50000 for nonparametric sing test. Thus, p-value is calculated with the formulation ∑𝑀𝑖𝑛𝑢𝑠(10 𝑘)𝑝𝑘(1 − 𝑝)10−𝑘
𝑘=0
. For instance, let us assume 5 out of 10 installations have arrived after 2 hours. The p-value is found as 0.62305. After the calculation of the p-value, the value is compared with the significance level which is 0.05000 in our method. If p-value is less than , null hypothesis is rejected; otherwise the decision is fail to reject. For example, the p-value which was calculated for 6 installations whose CTIT is greater than 2-hour out of 10 is greater than = 0.05000. Therefore, null hypothesis is failed to reject. If the first test is rejected, the publisher is found as a fraud according to our method of successive runs. In contrast, if the first decision is not a rejection, the second test is applied. After 2nd test, 2 successive reject decisions are needed to accuse the publisher of fraudulence. If 2 reject decisions are not made one after another in the range between 2 and 22 tests, the publisher continues to be investigated. However, after 23rd test (230 installations), blaming publisher for spamming requires 3 successive reject decisions until 433rd test (4330 installations). After that point, 4 reject decisions have to be waited to conclude that a publisher is a fraud or not. table 3.4 represents that number of consecutive installations’ range according to the number of tests. If the publisher is figured out to be fraud, it is blocked immediately. For example, let us assume that a publisher is blamed for spamming with 98th test result. It means that 96th, 97th, and 98th null hypothesizes are rejected. Hence, 99th test is unnecessary for that publisher after this point because it is in the list of the blocked spammers. A publisher is tested at most 𝑇ℎ𝑒 𝑇𝑜𝑡𝑎𝑙 𝑁𝑢𝑚𝑏𝑒𝑟 𝑜𝑓 𝐼𝑛𝑠𝑡𝑎𝑙𝑙𝑠 𝑖𝑛 𝑎 𝐶𝑎𝑚𝑝𝑎𝑖𝑔𝑛
10 times. If the publisher passes all tests, the publisher acts legitimate behaviors. In another word, for each null hypothesis that is not rejected, publisher is legit in this campaign. It should not be forgotten that publishers who are found legit in other campaigns can start to commit fraudulent
29
behaviors after some point. Therefore, it is vital to continue to check legitimacy of publishers in the new campaigns.
4.2 Detection of Click Injection
In click injection, fraudulent publisher’s app can detect when other apps are downloaded on the device and trigger clicks right before the installation completes. In this way, they receive undeserved credit for their attributed installations. Click-to-install times of click injecting publishers are typically smaller. However, from the perspective of the advertisers, truncating all installations with small CTIT is not a good idea since not every click that happens shortly before the installation is fraudulent. In this sense, a similar multiple testing procedure can be developed for the detection of injected clicks to prevent advertisers from diverting their budget to fraudsters.
Start Campaign 𝑛
Set 𝐼𝑛𝑠𝑡𝑎𝑙𝑙 𝐶𝑜𝑢𝑛𝑡𝑒𝑟 = 0 Set 𝑃𝑙𝑢𝑠 = 0
For each arriving installation for 𝑛th campaign o 𝐼𝑛𝑠𝑡𝑎𝑙𝑙 𝐶𝑜𝑢𝑛𝑡𝑒𝑟 = 𝐼𝑛𝑠𝑡𝑎𝑙𝑙 𝐶𝑜𝑢𝑛𝑡𝑒𝑟 + 1 o 𝐶𝑇𝐼𝑇𝑖𝑘𝑛= 𝐼𝑛𝑠𝑡𝑎𝑙𝑙 𝑇𝑖𝑚𝑒𝑖𝑘𝑛− 𝐶𝑙𝑖𝑐𝑘 𝑡𝑖𝑚𝑒𝑖𝑘𝑛 o For each test 𝑡 ∈ 𝑇
If 𝐼𝑛𝑠𝑡𝑎𝑙𝑙 𝐶𝑜𝑢𝑛𝑡𝑒𝑟 % 10 = 0 o 𝑆𝑖𝑔𝑛 = 𝐶𝑇𝐼𝑇𝑖𝑘𝑛𝑡 − 20 o If 𝑆𝑖𝑔𝑛 > 0 𝑃𝑙𝑢𝑠 = 𝑃𝑙𝑢𝑠 + 1 Calculate 𝑃𝑣𝑎𝑙𝑢𝑒 of Test 𝑡 𝑃𝑣𝑎𝑙𝑢𝑒(𝑡) = ∑ (𝑠𝑎𝑚𝑝𝑙𝑒 𝑠𝑖𝑧𝑒 𝑘 )𝑝𝑘(1 − 𝑝)𝑠𝑎𝑚𝑝𝑙𝑒 𝑠𝑖𝑧𝑒−𝑘 𝑃𝑙𝑢𝑠 𝑘=0 If 𝑡 = 1 o If 𝑃𝑣𝑎𝑙𝑢𝑒(1) < Publisher 𝑘 is a fraudster Block Publisher 𝑘
30 o Else
Wait for the next ten installations and conduct Test 2 If 𝑡 ≥ 2 o If 𝑃𝑣𝑎𝑙𝑢𝑒(𝑡) < & 𝑃𝑣𝑎𝑙𝑢𝑒(𝑡 + 1) < Publisher 𝑘 is a fraudster Block Publisher 𝑘 o Else
Wait for the next ten installations and conduct Test 𝑡 + 2 If 𝑡 > 22 o If 𝑃𝑣𝑎𝑙𝑢𝑒(𝑡) < & 𝑃𝑣𝑎𝑙𝑢𝑒(𝑡 + 1) < & 𝑃𝑣𝑎𝑙𝑢𝑒(𝑡 + 2) < Publisher 𝑘 is a fraudster Block Publisher 𝑘 o Else
Wait for the next ten installations and conduct Test 𝑡 + 3 If 𝑡 > 434 o If 𝑃𝑣𝑎𝑙𝑢𝑒(𝑡) < & 𝑃𝑣𝑎𝑙𝑢𝑒(𝑡 + 1) < & 𝑃𝑣𝑎𝑙𝑢𝑒(𝑡 + 2) < & 𝑃𝑣𝑎𝑙𝑢𝑒(𝑡 + 3) < Publisher 𝑘 is a fraudster Block Publisher 𝑘 o Else
Wait for the next ten installations and conduct Test 𝑡 + 4 If 𝑡 > 8524 o If 𝑃𝑣𝑎𝑙𝑢𝑒(𝑡) < & 𝑃𝑎𝑙𝑢𝑒(𝑡 + 1) < & 𝑃𝑣𝑎𝑙𝑢𝑒(𝑡 + 2) < & 𝑃𝑣𝑎𝑙𝑢𝑒(𝑡 + 3) < & 𝑃𝑣𝑎𝑙𝑢𝑒(𝑡 + 4) < Publisher 𝑘 is a fraudster Block Publisher 𝑘