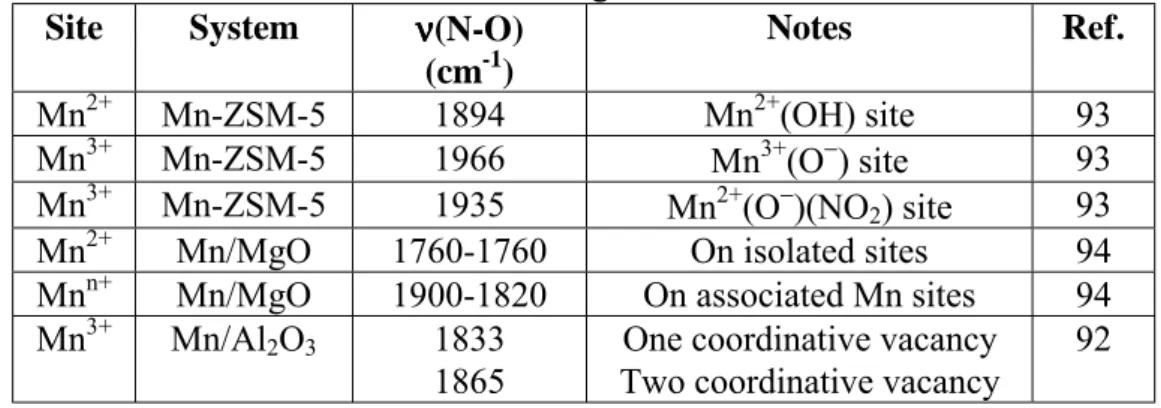
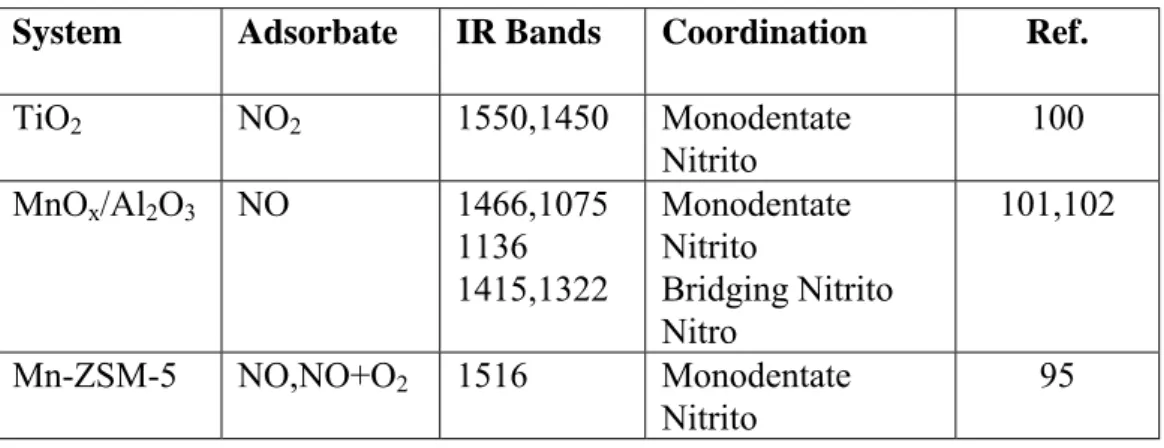
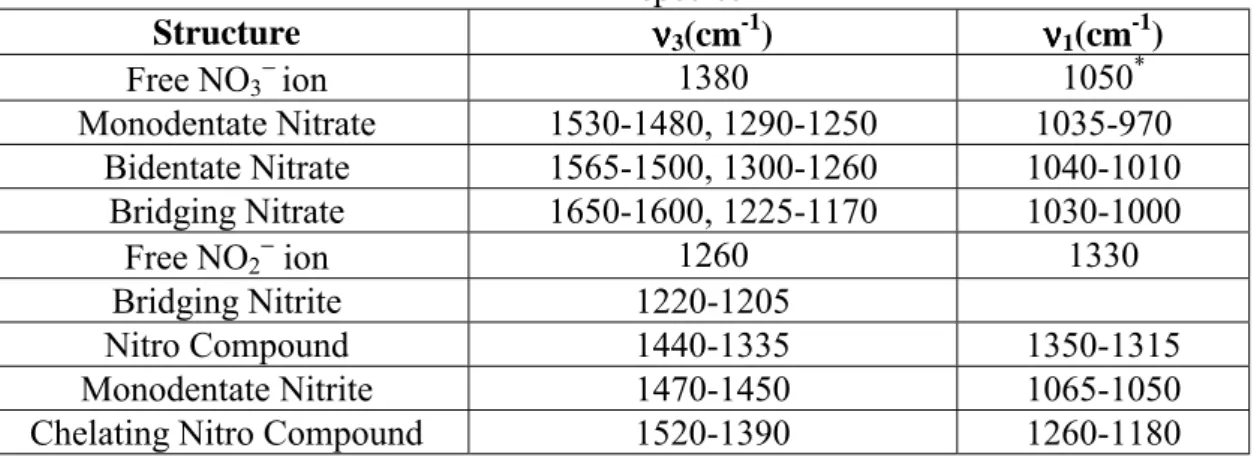
Identification, stability and reactivity of NOx adsorbed species on titania-supported manganese catalysts
Tam metin
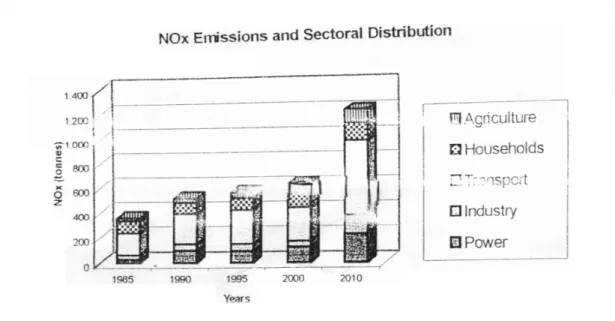
Şekil
Benzer Belgeler
In many Muslim countries like Turkey, Malaysia, Indonesia, and Gulf countries, the omnipresence or resurgence of Islam and religious values in shaping identities and
As predicted, pride tracked the valuation of foreign audiences when the valuations of foreign and local audiences were correlated, but it failed to track foreign audiences for
ill iliis sl.iK.ly, we i)roposc an aiui.lyl.ical model to dctcnniiic the withdrawal cycle length, kanban sizes a.nd number of kanbans simultaneously in a periodic
a) Beyan unsuru : İrade beyanı, idarî işlemin başlıca şartla rından biridir. İdare adına açıklanmış geçerli bir beyan olma dan idarî işlemden bahsedilemez. b)
Türkiye’deki durumun değerlendirilmesine yönelik olarak ise teknik donanım ve ağ bağlantıları açısından bölgeler, iller ve hatta aynı ildeki semtler arasında hem nicel hem
The simple QRS template matching is inadequate in identifying the ectopic beats because supra-ventricular ectopic beats (SVE) and some of ventricular ectopic beats (VE)
Yukarıda saydı˘gımız analitik yöntem- lerden yalnız Hirota yöntemi lineer olmayan kısmi türevli diferansiyel denklemlerin multi soliton çözümlerini bulmak
Bozkırkurdu, insanlara karşıtlığıyla yaşadığı iç çatışmanın sonucu olarak kendini çaresizliğe kapılmış şekilde bulur: “Umarsızlık 27 ve ödleklik
