CHARACTERIZATION OF LARGE
STRUCTURAL VARIATION USING
LINKED-READS
a thesis submitted to
the graduate school of engineering and science
of bilkent university
in partial fulfillment of the requirements for
the degree of
master of science
in
computer engineering
By
Fatih Karaoğlanoğlu
Aug 2018
Characterization of Large Structural Variation Using Linked-Reads By Fatih Karaoğlanoğlu
Aug 2018
We certify that we have read this thesis and that in our opinion it is fully adequate, in scope and in quality, as a thesis for the degree of Master of Science.
Can Alkan(Advisor)
Uğur Güdükbay
Engin Demir
Approved for the Graduate School of Engineering and Science:
Ezhan Karaşan
ABSTRACT
CHARACTERIZATION OF LARGE STRUCTURAL
VARIATION USING LINKED-READS
Fatih Karaoğlanoğlu M.S. in Computer Engineering
Advisor: Can Alkan Aug 2018
Many algorithms aimed at characterizing genomic structural variation (SV) have been developed since the inception of high-throughput sequencing. However, the full spectrum of SVs in the human genome is not yet assessed. Most of the existing methods focus on discovery and genotyping of deletions, insertions, and mobile elements. Detection of balanced SVs with no gain or loss of genomic segments (e.g. inversions) is particularly a challenging task. Long read sequencing has been leveraged to find short inversions but there is still a need to develop methods to detect large genomic inversions. Furthermore, currently there are no algorithms to predict the insertion locus of large interspersed segmental duplications.
Here we propose novel algorithms to characterize large (>40Kbp) interspersed segmental duplications and (>80Kbp) inversions using Linked-Read sequencing data. Linked-Read sequencing provides long range information, where Illumina reads are tagged with barcodes that can be used to assign short reads to pools of larger (30-50 Kbp) molecules. Our methods rely on split molecule sequence signa-ture that we have previously described. Similar to the split read, split molecules refer to large segments of DNA that span an SV breakpoint. Therefore, when mapped to the reference genome, the mapping of these segments would be dis-continuous. We redesign our earlier algorithm, VALOR, to specifically leverage Linked-Read sequencing data to discover large inversions and characterize in-terspersed segmental duplications. We implement our new algorithms in a new software package, called VALOR2.
ÖZET
BÜYÜK YAPISAL VARYASYONLARIN BAĞLI
OKUMALAR KULLANILARAK KARAKTERİZE
EDİLMESİ
Fatih Karaoğlanoğlu
Bilgisayar Mühendisliği, Yüksek Lisans Tez Danışmanı: Can Alkan
Ağustos 2018
Yüksek verimli okuma cihazlarının gelişmesiyle yapısal varyasyonların keşfi için birçok algoritma geliştirilmiştir. Ama insan genomundaki YV’ların birçoğu henüz belirlenememiştir. Mevcut metotlar delesyon, insersiyon ve mobil elemanlar ü-zerinde yoğunlaşmaktadır. Dengeli, DNA miktarını değiştirmeyen varyasyonların tespiti zor bir problemdir. Uzun okuma teknolojileri ile birlikte kısa inversiyon-ların bulunması mümkün olduysa da, büyük genomik inversiyoninversiyon-ların keşfi için yeni metodların geliştirilmesi gerekmektedir. Dahası, şu an büyük segmental duplikasyonların insersiyon lokusunu tahmin eden bir algoritma bulunmamak-tadır.
Bu tezde bağlı okuma teknolojilerini kullanarak ardışık olmayan segmental duplikasyonların ve inversiyonların karakterizasyonu için özgün algoritmalar öne sürüyoruz. Bağlı okuma teknolojisi Illumina okumalarını barkodlar ile işaretle-yerek uzun mesafe bilgisi sağlamaktadır. Tezdeki metotlar ayrık okuma sinyal-lerine benzeyen ayrık molekül sinyalsinyal-lerine dayanmaktadır. Ayrık moleküller varyasyon kesim noktalarına denk gelen ve bu nedenle referansa hizalandığında bölünen moleküllerdir. Daha önce Havuzlanmış Klon Dizileme yöntemi için tasar-lanmış olan VALOR algoritmasını, bağlı okumalar ile ardışık olmayan segmental duplikasyonları ve inversiyonları bulmak için yeniden tasarladık. Bu yeni algo-ritmayı, VALOR2 adıyla yeni bir yazılım paketinde uyguluyoruz.
Anahtar sözcükler: Yapısal Varyasyon, Segmental Duplikasyon, İnversiyon, Bağlı
Acknowledgements
First and foremost I would like to express my sincerest gratitude to my su-pervisor, Asst. Prof. Can Alkan, for his continuous support for my graduate studies.
I would like to express my gratitude to my thesis committee: Prof. Uğur Güdükbay and Asst. Prof. Engin Demir.
I would like to thank current and former members of Bilkent Bioinformatics and Computational Genomics Group: Fatma Kahveci, Mohammed Alser, Arda Söylev, Halil İbrahim Özercan, Alim Gökkaya, Ezgi Ebren, Balanur İçen, Tuğba Doğan, Zülal Bingöl, Marzieh Eslami Rasekh and Can Fırtına.
I would like to thank our collaborators Iman Hajirasouliha and Camir Ricketts from Weill Cornell.
I acknowledge TÜBİTAK 215E172 grant for the financial support of this project.
Last but not least, I would like to my thank family: Nurettin, Serpil and Göksu Karaoğlanoğlu, for their endless love, support and patience.
Contents
1 Introduction 1
1.1 Background Information . . . 2
1.1.1 Sequencing . . . 2
1.1.2 Structural Variation . . . 5
1.1.3 Sequencing Signatures to Detect SVs . . . 6
1.1.4 Currently available structural variation discovery tools . . 7
2 VALOR2 Algorithm to Discover Large SVs using Linked-Reads 9 2.1 Motivation . . . 9
2.2 Challenge . . . 10
2.3 Linked-Read data . . . 12
2.4 Mapping linked-reads . . . 12
2.5 Processing alignments . . . 12
CONTENTS vii
2.5.2 Loading and grouping reads . . . 13
2.6 Recovering molecules . . . 13
2.6.1 Molecule depth signature . . . 15
2.7 Split molecule discovery . . . 16
2.8 Matching split molecules . . . 17
2.9 Filtering predictions with Illumina read pair signatures . . . 18
2.10 Clustering predictions . . . 18
2.10.1 Constructing SV graph . . . 19
2.10.2 Quasi-clique formulation to predict SVs . . . 21
3 Results 23 3.1 Simulated data . . . 23
3.1.1 Linked-Read simulation . . . 23
3.1.2 Inserted variants . . . 24
3.1.3 Simulated results and comparison with other methods . . 24
3.2 Real data . . . 25
3.2.1 NA12878 . . . 25
3.2.2 CHM1 . . . 27
CONTENTS viii
4.1 Works in progress . . . 30
4.1.1 Deletion discovery . . . 30
4.1.2 Inter-chromosomal events . . . 31
4.2 Future directions . . . 33
4.2.1 Structural variation discovery on tumor samples . . . 33
4.2.2 Resolving overlapping events . . . 33
4.2.3 Expanding the range of predictions . . . 33
A Glossary 44
B Data 45
List of Figures
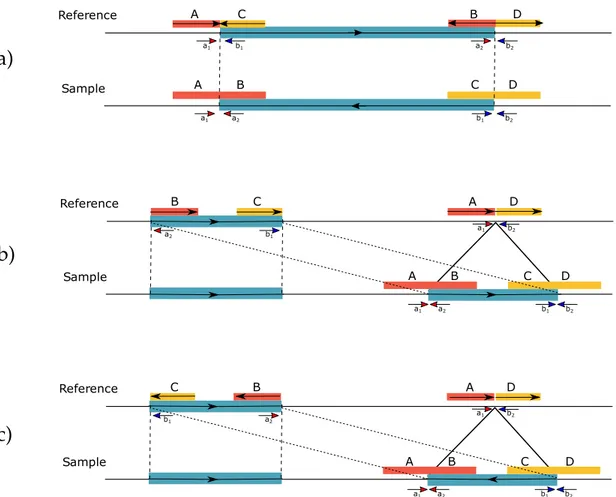
2.1 Read pair signatures for a) inversion, b) interspersed inverted du-plication. Note that both variants show ++ and – read-pair sig-natures. . . 11
2.2 Molecule depth histogram of NA12878 in chr16 of non-zero bins. Data from [1, 2] . . . 15
2.3 Split molecule and read pair sequence signatures used in VALOR2.
a) Inversion, b) interspersed duplication in direct orientation, c) inverted duplication. In each case, the large molecules that span the SV breakpoints are split into two mapped regions. Note that, it is not possible to determine the mapped strand of the split molecules shown here. From the perspective of the reference genome (i.e., mapping), A,B,C,D are defined as submolecules, A/B and C/D pairs are candidate splits, and A/B-C/D quadruple is a
split molecule pair. . . . 17 2.4 Asymmetric variations will have split molecule signatures for a)
forward copy, b) backward copy direct interspersed duplications. 18
2.5 a) SV subgraph of a variant with low mapping ambiguity around the breakpoints. b) SV subgraph of a variant with breakpoints on highly repeated regions. c) SV subgraph of two heterozygous overlapping variants (from simulated data) . . . 22
LIST OF FIGURES x
3.1 Comparison of the inversion predictions (> 80 Kb) by VALOR2,
Long Ranger, DELLY, and LUMPY in the NA12878 genome. . . 27
3.2 Intersection of all inversions reported by InvFEST (validated or predicted) with VALOR2 predictions on CHM1 genome. . . 27
4.1 Split molecule and read pair signature of a deletion. . . 30
4.2 Split molecule and read pair signature of translocation. Where a segment of DNA is copied from chromosome B to A. . . 31
4.3 a and b are molecules with the same barcode in different chromo-somes. c is a discordant read pair with one end near a other end near b. We allow gaps between reads and molecules to cover for low coverage. We allow overlaps to be robust to repeats. . . 32
4.4 A model to discover smaller duplications, where split molecule information is lost due to small size of the duplication. We can look for discordant read pairs which share barcodes with the molecules around the target. AB and CD molecules are on the duplication, B and C are lost due to low coverage. . . 34
List of Tables
1.1 Read pair signatures and corresponding structural variants. for +− signature to be discordant, distance between read pairs should be larger than µ + 3σ. . . . 6
3.1 Simulation statistics as generated by VarSim. . . 24
3.2 Prediction performance evaluation using simulated structural vari-ants. . . 25
3.3 Inversion prediction performance evaluation in the NA12878 genome using InvFEST database. . . 26
3.4 Segmental duplications predicted in the NA12878 genome using VALOR2. . . 28
4.1 Prediction performance evaluation using simulated deletions. . . . 30
4.2 Read pair signatures and corresponding interchromosomal struc-tural variants. Each pair should map to different chromosomes . . 32
Chapter 1
Introduction
Human genome consists of 3 billion base pairs represented with a 4-letter alpha-bet (Σ = {A, C, G, T }), that correspond to chemical bases; Adenine, Cytosine, Guanine and Thymine. Human genome is highly repetitive. Common repeats make up 50%, segmental duplications make up 5% of the human genome. Hu-mans share 99.9% of their genetic material with other huHu-mans, remaining 0.1% is what makes us different. This difference is caused by a variety of genetic events that come in different size and organization. Single nucleotide polymorphisms (SNPs) are the changes of a single base pair of the DNA. Indels are insertions and deletions of base pairs that are smaller than 50 base pairs. Indels and SNPs are the most common genetic events that make up the genetic variation and they are fairly easy to detect. Events that span more than 50 base pairs are called structural variations (SVs) and their length can be as much as millions of base pairs [3]. SVs can be classified into copy number variations (CNVs) and bal-anced rearrangements. Copy number variations are the variations that change the amount of DNA and can be listed as insertions, deletions, tandem and inter-spersed duplications. Balanced rearrangements are inversions and translocations. Since they do not change the amount of DNA in the genome, it is not possible to detect balanced rearrangements with methods that utilize read depth (See Subsection 1.1.3.3 for details).
1.1
Background Information
1.1.1
Sequencing
Sequencing is the process of converting DNA into string of letters. It allows us to read genomes of the organisms. There are several approaches of sequencing, each with its own limitations. We describe some of the sequencing technologies below.
1.1.1.1 Sanger sequencing
For almost 40 years Sanger sequencing [4] also known as chain termination method was the go to method for sequencing. In this method, we start with amplified single stranded DNA fragments and we attach a primers to a known sequence to ensure in the following steps each copy starts at the same position. Then, four vessels are prepared containing DNA polymerase, free nucleotides and a single type of nucleotide (one type for each vessel) lacking an oxygen atom, which stops the synthesis when attached. Then these fragments are sorted by their length/weight using electrical current. Since start positions of each frag-ment are equal, bases will be identified by their order.
In a 2014 review [5] cost of Sanger sequencing stated to be ≈ $500/Mb. If we assume cost came down following the Moore’s Law, today 1× coverage of whole human genome will cost ≈ $40000. While Sanger sequencing is able to generate long reads with low error rate, high cost of the procedure compared to high throughput sequencing methods makes it undesirable for whole genome sequencing. However, it is still useful for smaller projects and validation of the new sequencing methods.
1.1.1.2 Human Genome Project
Human Genome Project aimed to create a reference for the human genome. It launched in 1990 and completed in 2003. It is a consensus gathered from 7-8 in-dividuals, 71% belonging to one person. It covers 99% of the human genome with 99% accuracy (excluding centromeres and telomeres). Cost of Human Genome Project was around $3 Billion. It is still being updated by including more individ-uals and refining repeat and gap regions. Latest version, GRCh38 was released in 2013.
1.1.1.3 High Throughput Sequencing
Since their inception, High Throughput Sequencing (HTS) technologies are widely used to discover SNPs, indels and various types of structural variation, [6, 7, 8, 9, 10, 11, 12]. they can be broadly classified as short read sequencing and long read sequencing techniques.
Short read sequencing
DNA is cut into small pieces and fragments that are in a predetermined size range are selected(≈500 bp for Illumina platform). These fragments are amplified by polymerase chain reaction (PCR). Afterwards, bases are detected from both ends of these fragments by attaching fluorescently labeled bases with DNA polymerase and capturing the emitted lights unique to each type of base. This method can sequence up to 150 bp with high accuracy, but its quality deteriorates for longer read lengths. Produced by various Illumina sequencing platforms, short reads offer very low error rate for a relatively low price. However, short read lengths makes them less effective at the complex, repetitive regions of the genome [13, 14].
Long read sequencing
There are two commonly used approaches to long read sequencing, developed by Pacific Biosciences (PacBio) and Oxford Nanopore Technologies (ONT).
PacBio SMRT platform sequences DNA by observing DNA polymerase while it replicates the DNA fragments. Similar to Illumina sequencing, this is done by observing the fluorescent lights emitted. However instead of fluorescent bases, PacBio uses fluorescent phosphates. With this approach, fluorescent lights are removed when bases attach fragment, thus allowing sequencing of whole fragment. Errors are indel dominated, where runaway bases entering the detection zone causes false insertions and inconsistencies with the polymerase speed cause false deletion errors.
Oxford Nanopore sequencers work by observing the disruptions on the elec-trical current, while DNA fragments passes through a pore. Observed elecelec-trical signals then identified using a recurrent neural network. Errors of Nanopore caused by varying passing speed of the fragments through pores and electrical disruptions caused by adjacent bases.
While they can generate long reads, which are useful at interpretation of com-plex regions of the human genome, their high error rate and relative high cost are prohibitive factors. Despite their high error rate, they are shown to be useful at the characterization of complex structural variants [15, 16, 17, 18].
Linked-read sequencing
Recently Linked-Read sequencing methods such as the 10x Genomics system (10xG) were introduced as an alternative method to generate highly accurate Illumina short reads data with additional long-range information [19]. In the 10xG system, large DNA molecules (typically 10-100 Kbp) are barcoded and randomly separated into over a million partitions (here we term these partitions “pools”). Each pool contains roughly 2-30 large molecules. These pools are then sequenced at very low coverage (∼0.1X) using the standard Illumina platform. Shared barcodes among Illumina read pairs show them as generated from the same pool. Since each pool is diluted to contain only a very small fraction of the input DNA, the probability of barcode collision is negligible [20]. For example,
assuming 20 molecules per pool and an average size of 30 Kbp per molecule, each pool on average contains only 1
5,000 of the haploid human genome. Linked-Reads
then can be used to “reconstruct” large molecules that originate from the same haplotype. Furthermore, Linked-Read sequencing makes it possible to obtain very high physical coverage with the cost of generating moderate sequence coverage data1.
The ability of extracting long range information from accurate and inexpen-sive but short read sequencing data makes Linked-Read sequencing attractive for various applications. It has been used for genome scaffolding [21], haplotype-aware assembly [19, 22, 23], metagenomics [24], single cell transcriptome profil-ing [25, 26] and regulatory network clusterprofil-ing [27], haplotype phasprofil-ing [19, 22, 28], and genome structural variation discovery [29, 30, 31, 20].
Linked-Read techniques for genomic structural variation discovery include VALOR [29], Long Ranger [30] and GROC-SVs [31].
1.1.2
Structural Variation
1000 Genomes Project defines alterations in the DNA that affect more than 50 base pairs as structural variation [32]. Structural variation can be examined in two main categories, copy number variations and balanced rearrangements. Deletions, insertions and duplications are classified as copy number variations. Inversions and translocations are balanced rearrangements. Copy number vari-ations change amount of DNA in the genome, while balanced rearrangements do not influence it. Also, structural variations can involve a single chromosome or a pair of chromosomes, called intrachromosomal and interchromosomal events respectively. Segmental duplications and translocations can be either intrachro-mosomal or interchrointrachro-mosomal.
1.1.3
Sequencing Signatures to Detect SVs
1.1.3.1 Read Pair
Read pair signatures can be used on Illumina sequencing data [33]. Normally we expect one end of the pair to map forward strand, other to reverse strand. However, on structural variation breakpoints this is not the case [7]. Variants and observed read pair signatures are shown in Table 1.1.3.1, where + denotes forward and− denotes the reverse strand.
Table 1.1: Read pair signatures and corresponding structural variants. for +− signature to be discordant, distance between read pairs should be larger than
µ + 3σ.
Mapping Strands Variants
++ Inversions and Inverted Duplications +− Deletions, Interspersed Duplications and
Translocations (Figure 4.2)
−+ Interspersed Duplications and Tandem Duplications
−− Inversions and Inverted Duplications
1.1.3.2 Split read
Split read based methods [3] aim to identify structural variations using reads that map to breakpoints of the events. Long read SV callers extensively use this signature. Since it shortens the sequence length further, this signal less suitable for short read technologies. However, they are useful to refine breakpoints of smaller events and it can provide additional support to read pair signatures.
1.1.3.3 Read depth
Read depth is a simple yet effective method for copy number variations. Whole genome is simply split into bins. For each read bin at the mapping location is
incremented. Some of the sequencing technologies suffer from GC bias, where regions with high G and C base density are less likely to be sequenced. This bias can be corrected statistically [34, 35]. If depth of a bin is smaller than expected range (can be µ−3σ), it signals a deletion. If depth is larger than expected range (µ + 3σ), it signals a duplication. These bins can either be used to identify copy number variations, by checking the depth of bins at non-gap regions, or they can be used to support predictions made by other signatures (e.g., read pairs). If standard deviation of the depth values is high, it will be difficult to distinguish heterozygous variations from the normal. Also, in the complex regions of the genome, mapping ambiguity will render this SV signal less useful [13].
1.1.4
Currently available structural variation discovery
tools
1.1.4.1 Short read based tools
First tool that was developed to discover SVs using HTS was PEMer [6]. It used Roche/454 sequencing, which is mostly abandoned today. The 1000 Genomes Project [32] raised interest on the SV discovery, predominantly for the Illumina platform. First read-pair based method for this platform was VariationHunter [36]. VariationHunter uses read pair signatures with read depth to identify dele-tions, inversions, transposon insertions and small novel sequence insertions. It clusters its predictions by approximating maximum set-cover problem.
Pin-del [37] is another method that uses paired short read data. PinPin-del looks for
potential split reads and tries to map unmapped part of the read around its mate using pattern growth algorithm. DELLY [38] uses read pair signatures together with split read signatures to detect structural variations. It can call deletions, inversion and tandem duplications. It uses maximal cliques to clus-ter its predictions. Even though it has high recall rate in the simulations, it is imprecise for large SV detection. LUMPY [11] uses read pair signatures, read depth signatures and split read signatures together in a probabilistic framework to call structural variants. Although this tool makes precise predictions, it has
relatively low recall rate for large variants compared to other tools.
1.1.4.2 Long read based tools
SMRT-SV [39] collects long reads that show split read signatures and constructs
a de novo assembly. By remapping the assembled reads to the reference, it calls structural variants. Sniffles [16] is another SV discovery tool that utilizes long reads. Developers suggest using their own aligner, NGMLR, to map long reads. NGMLR uses a convex gap-cost scoring scheme, which is stated to be better suited for SV discovery with long reads. Together with improved split detection of NGMLR, Sniffles finds reads that indicate structural variants and cluster them. It can detect complex regions and partially phase the variants.
1.1.4.3 Linked read based tools
LongRanger [30] is a comprehensive software package developed by 10x
Ge-nomics, for the purpose of barcode-aware read alignment and resolving full-scale human germline genome variation. GROC-SV is an optimized tool for somatic and complex SVs in cancer genomes. Both Long Ranger and GROC-SVs employ a novel idea to utilize discordance in expected “barcode coverage” as well as bar-code similarities across distant locations for potential large-scale SV signals. In addition, GROC-SVs [31] performs local assembly on barcoded reads to detect large complex events that are between 10-100 Kbp with breakpoint resolution.
Chapter 2
VALOR
2
Algorithm to Discover
Large SVs using Linked-Reads
2.1
Motivation
Structural variants that are within coding regions of the genome are associated with various syndromes [40, 34, 41, 42, 43]. Accurate detection of SVs can be beneficial to medical diagnosis and personalized treatments. Duplication of a 3.7 Mb segment at the 17p11.2 locus induces Potocki-Lupski Syndrome [44, 45]. Infants with this syndrome likely to show developmental delay, heart defects, dental and skeletal abnormalities. People with this syndrome show features of autism spectrum disorder, affecting social interaction and communication. Dele-tion of the same region causes Smith-Magenis syndrome [46]. Patients with this variation exhibit mild to moderate intellectual disability, delayed language skills, and behavioral problems. Inversions at 15q11-q13 locus causes Angelman Syn-drome [42]. Patients with this synSyn-drome shows delayed development, intellectual disability, severe speech impairment, and problems with movement and balance [47].
Accurate characterization of the structural variants can enhance our under-standing of many genetic medical conditions. Furthermore, better annotation of SVs can benefit genome-wide association studies.
Even if structural variants do not intersect with any coding genes, they can alter 3D structure of chromosomes. 3D organization and folding of a chromosome can close up distances between positions that are distant on the linear sequence. Frequency of interactions between genetic sequences is dependent on the 3D po-sitioning of those sequences. This correlation to proximity introduces Topolog-ically Associating Domains (TADs). TADs are regions in the genome that host sequences with high levels of interaction with sequences within the same TAD and fewer interactions with others. Structural variants are shown to disrupt TAD’s, thus change the 3D structure of the genome. Some of these disruptions to the genome structure shown to cause developmental disorders [48].
There are many algorithms to predict structural variants, yet for large variants (> 100Kb) they have poor precision and/or recall. Moreover, none of the available tools can call interspersed duplications (inverted or direct). Further details on the state-of-the-art algorithms are discussed in Section 1.1.4.
2.2
Challenge
Breakpoints of both inversions and segmental duplications lie on repeated regions [49] [50]. Because of this, mapping quality of reads around the breakpoints of these variants are reduced significantly and this makes it difficult to find these events with adequate accuracy. Recent developments with the long read tech-nologies provided reads with sizes that can span repeated regions. However, high error rates makes it difficult to discover large variants with long reads alone.
Despite there have been studies on discovering existence of segmental dupli-cations with read-depth based methods, pinpointing their insertion locus is a non-trivial task.
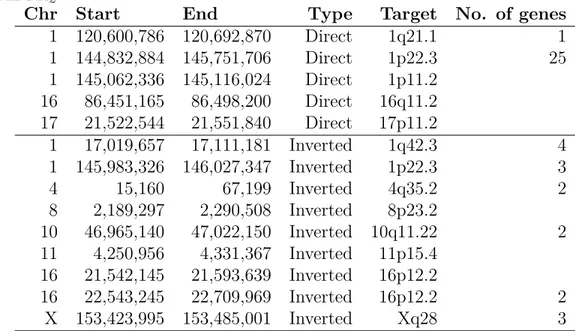
In a recent study, 54% of the previously predicted inversions reported by 1000GP shown to be inverted duplications [51, 32]. This is due to read-pair signatures (Figure 2.1) of inversions and inverted duplications being identical. While ordering of the pairs are different for these variants, in repeated regions (where these events likely to occur) mapping is not precise enough to differentiate them.
a)
b)
Figure 2.1: Read pair signatures for a) inversion, b) interspersed inverted dupli-cation. Note that both variants show ++ and – read-pair signatures.
50% of genome consists of repeated sequences. Some of the reads in the re-peated regions may align hundreds of positions with same alignment score, caus-ing mappcaus-ing ambiguity [14]. BWA-MEM [52] gets around this problem by ran-domly selecting one of the alignments and setting its score to zero. Firtina, et al. shows that many SV discovery tools fail to reproduce their results if input reads to aligner is shuffled [13].
2.3
Linked-Read data
This is a sequencing technique that uses micro-fluids to partition and barcode DNA fragments. This method provides long range information in addition to sequencing information. Large DNA fragments are separated into pools and bar-coded. Each pool contains up to 30 fragments and each molecule sequenced with very low coverage (≈ 0.2X). Sequencing molecules with low coverage achieves high molecule coverage of the genome with relatively low cost, where 40X genome coverage with 0.2X molecule coverage achieves 200X physical coverage of genome with molecules.
2.4
Mapping linked-reads
VALOR2 does not depend on any specific aligner for read mapping. In this
study we used LongRanger aligner of 10x Genomics to map our simulated data. However, it is possible to preprocess reads to extract barcodes and align with any other aligner (e.g., BWA [52]).
2.5
Processing alignments
2.5.1
Determining read fragment size distribution
param-eters
For short reads, we expect fragment sizes to follow a Gaussian distribution. How-ever, distribution mean and variation vary across samples. In order to reveal which range of fragment sizes are indeed concordant, we process a fixed num-ber of reads (we use 1 million in this work) and calculate mean and standard deviation of the fragment size distribution of this sub-sample.
2.5.2
Loading and grouping reads
We separate reads into concordant and discordant read groups, where we define concordant reads to be +− aligned reads on the same chromosome with a size in the range of µ± 3σ. Then, we classify discordant read pairs into eight groups (See Subsections 1.1.3.1 and 4.1.2). Four of the discordant types indicate intra-chromosomal variations (Table 1.1.3.1) and other four indicate interintra-chromosomal variations (Table 4.1.2).
2.6
Recovering molecules
To recover 10xG molecules, we want to merge reads with the same barcode that are in close proximity with each other. VALOR2 recovers 10xG molecules by
merging concordant intervals with the same barcode that are in close proximity with each other. To do this efficiently, we stable sort concordantly mapped inter-vals that are already position sorted with respect to their barcode. Subsequently we can recover molecules with a single pass as shown in the Algorithm 1.
Algorithm 1 Molecule recovery.
Require: Alignments in BAM format with barcodes, look-ahead parameter (Q),
extend parameter (T ).
Ensure: Set of submolecules SM ={M1, M2. . . , Mk} (value of k is unknown and
will be determined by the algorithm)
SM ← ∅ i← 1
for each chromosome c do for each barcode b do
Mi =∅
for l = 1 to length(c) do
if short fragment f with barcode b maps to c[l] then if Mi =∅ then
Mi ← f
s(Mi)← s(f)
e(Mi)← e(f)
else if (s(f ) < s(Mi) + Q) or (s(f ) < e(Mi) + T ) then Mi ← Mi∪ f e(Mi)← e(f) else SM ← SM ∪ Mi i← i + 1 end if end if end for end for end for return SM
s(f ) denotes the map start location and e(f ) denotes the map end location of
2.6.1
Molecule depth signature
Read depth is a strong tool for detecting and verifying copy number variants [34, 35]. We introduce molecule depth signature, similar to barcode depth defined by GROC-SVs [31], while it has the filtering capabilities of read depth signature, it does not suffer from GC bias. We assume that, it follows Gaussian distribution (Figure 2.2), which allows us to make accurate filtering of copy number variation predictions.
Figure 2.2: Molecule depth histogram of NA12878 in chr16 of non-zero bins. Data from [1, 2]
.
For each chromosome, VALOR2allocates an integer array of size(chr)/bin_size.
Then for each recovered molecule, respective bins from its start position to end position are incremented (Algorithm 2). To compute depth of the variations, it simply takes the average of the bins that intersect with the variation.
Algorithm 2 Molecule Depth Computation
Require: Recovered 10xG Molecules, Number of base pairs in the chromosome
(N ), Size of the depth bins (B).
Ensure: A = Integer array of molecule depths with the size of N/B
A← Array[N/B]
for i = 0 to N/B do
A[i]← 0
end for
for m in Molecules do
for i = s(m) to e(m) increment by B do
A[i/B]← A[i/B] + 1
end for end for return A
s(f ) denotes the map start location and e(f ) denotes the map end location of
molecule m.
Molecules that map to gap and satellite regions introduce many false positive signals. We avoid erroneous predictions by removing molecules that overlap with those. Since molecules with a unique barcode cannot possibly be a split molecule, those are removed after read depths are computed.
2.7
Split molecule discovery
Although small set of molecules share same barcode (between 2 and 30 in 10xG data), two different molecules in the same chromosome can share a barcode. This makes split molecule discovery a nontrivial problem. We bypass this problem by generating all candidate split molecules and later filtering the ones with low discordant read support.
2.8
Matching split molecules
Split molecule signatures are simple and useful abstractions to define structural variation with Linked-Reads (Figure 2.3). Yet it is not as straightforward to spot these signatures from mapping information. It is not possible to figure out identities of the sub-molecules (A, B, C or D from Figure 2.3), before they are matched. Reference Sample a1 a2 b1 b2 a2 b1 a1 b2 C A B D B A C D Reference Sample a1 a2 b1 b2 a2 b1 a1 b2 C B D C B D A A Reference Sample a1 a2 b1 b2 a2 b1 a1 b2 C B D C B D A A
a)
b)
c)
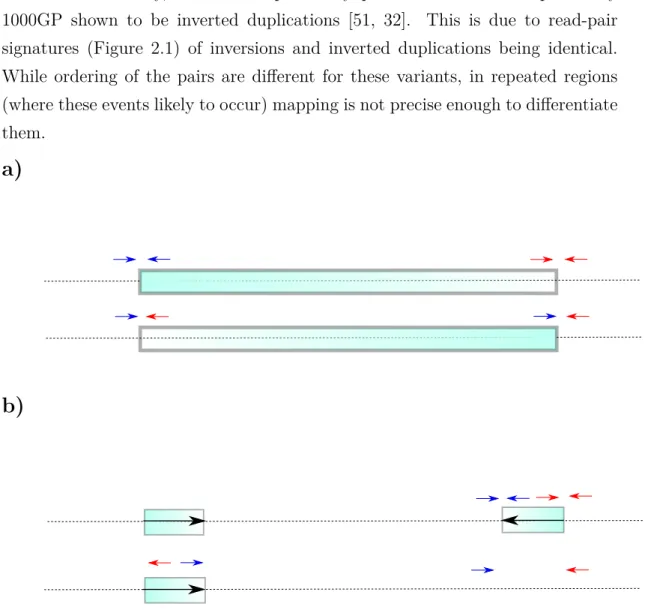
Figure 2.3: Split molecule and read pair sequence signatures used in VALOR2.
a) Inversion, b) interspersed duplication in direct orientation, c) inverted dupli-cation. In each case, the large molecules that span the SV breakpoints are split into two mapped regions. Note that, it is not possible to determine the mapped strand of the split molecules shown here. From the perspective of the reference genome (i.e., mapping), A,B,C,D are defined as submolecules, A/B and C/D pairs are candidate splits, and A/B-C/D quadruple is a split molecule pair.
Segmental duplications are asymmetric variations and their signature change with respect to relative position of the copy position (Figure 2.4). Furthermore, low coverage of the 10xG molecules makes it difficult to distinguish source and target of small duplications. We solve this problem by generating both possible scenarios and filtering them with read pair signatures (Algorithm 3).
a)
Reference Sample A C B Db)
Reference Sample A C B DFigure 2.4: Asymmetric variations will have split molecule signatures for a) for-ward copy, b) backfor-ward copy direct interspersed duplications.
2.9
Filtering predictions with Illumina read pair
signatures
For each split molecule of a SV candidate, read pair support values are calculated with the Algorithm 4. We remove candidates with any split molecules that are not supported. A higher threshold can be set according to coverage of the data.
2.10
Clustering predictions
High coverage of the HTS data allows us to build sensitive variant predictors. However, as a result of this many redundant calls indicating identical variants
Algorithm 3 Split Molecule Matching
Require: S = Sorted array of split molecules, F is the list of variants VALOR2
to discover.
Ensure: V = List of candidate variations
V =∅
for sab in S do
for scd ̸= sab in S do
for f in F do
if sab and scd indicates f then V ← V ∪ f(sab, scd) end if end for end for end for return V
Two split molecules indicate a variant if they show signature of that variant together (Figure 2.3). VALOR2 decides by comparing inner distance of the
sub-molecules with predetermined gap and overlap constants and outer distance with predetermined minimum and maximum SV size constants.
will occur. To avoid reporting hundreds of identical calls we want to cluster our predictions and reduce overlapping variants into one.
Overlap between two structural variants is well defined. This allows us to use graph based clustering methods. Similar to the approach employed by Eslami-Rasekh et al, we decided to use quasi-clique approximation for variation clustering [29]. We added several optimizations specific to generated variant graph to the approximation algorithm to reduce running time.
2.10.1
Constructing SV graph
We construct a graph G(V,E) where V is the predicted variants and there are edges between 2 vertices if those variants overlap. Two variants overlap if, all of their split molecules overlap. Here we accept that two split molecules overlap if there is any intersection between their sub-molecules. This makes SV graph ro-bust to partially recovered molecules due to low coverage and mapping ambiguity
Algorithm 4 Read Pair Support Computation
Require: D = Sorted array of discordant reads of a type, s = A split molecule. Ensure: Read pair support for s is updated
mid← DISCORDANT _BINARY _SEARCH(D, s)
for j=mid to size(D) do if D[j] overlaps with s then
support(s)← support(s) + 1
end if
if e(s.A) < s(D[j].A) then
Break
end if
if support(s) > M AX_SU P P ORT then ▷ Optional
Break
end if end for
s(s) denotes the map start location and e(s) denotes the map end location of
fragment f .
s.A denotes the first fragment and s.B denotes the second fragment of split
molecule or discordant read pair.
DISCORDAN T _BIN ARY _SEARCH(D, s) is a binary search function to
find first discordant read pair that overlaps with a split molecule.
on repetitive regions. Furthermore this method accurately identifies predictions pointing to same variation, since it is unlikely to all four sub-molecules from different variations to intersect.
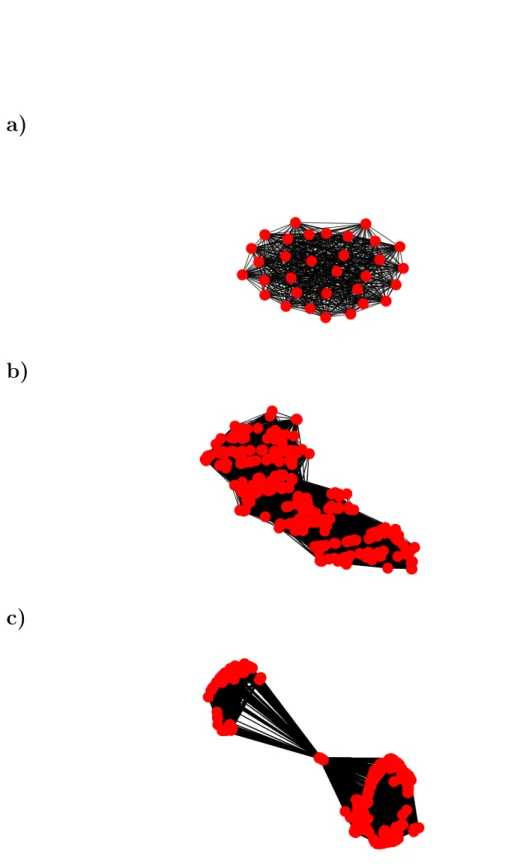
2.10.1.1 Patterns captured by SV graph
When we plot the SV graphs, we observe several patterns that can be used to identify some complex events such as; overlapping heterozygous variants, variants with single breakpoint on repeats and variants with both breakpoints on repeats (Figure 2.5).
2.10.2 Quasi-clique formulation to predict SVs
Ideally, SV graph will have a separate sub-graph for each structural variant. For repeat-free regions of the genome a simple DFS would be adequate to cluster structural variants. However, due to repetitiveness of the DNA there will be many outlier predictions in this graph. In this case if we use DFS to cluster variants, breakpoints will be skewed towards the outliers. In the other extreme if we use clique or an equivalent clustering technique, it will report completely con-nected components with low cardinality [29]. Thus this approach will report many equivalent clusters on the repeated regions. Maximal quasi-clique approximation [53] is able to cluster variants in the SV graph and it is robust to break-point am-biguities caused by repeated regions. VALOR2 uses quasi-clique approximation
together with the DFS to detect SV clusters (Algorithm 5).
Algorithm 5 SV Clustering
Require: G(V, E) = Undirected SV graph. Ensure: P = Clustered variations
C ← DF S_F IND_CONNT ECT ED_COMP ONENT S(G)
for c in C do
initial← size(c)
while initial∗ α ≤ size(c) do
q← MAXIMAL_QUASI_CLIQUE(c) c← c − q
P ← P ∪ RESOLV E_SV _BREAKP OINT (q)
end while end for return P
α is a predetermined value between 0 and 1 to stop quasi-clique mining. α can
be set to 0 to find all clusters, 1 to find only 1 cluster,
size(c) denotes the number of nodes in the subgraph c
M AXIM AL_QU ASI_CLIQU E(c) is maximal quasi-clique approximation
al-gorithm [53]
RESOLV E_SV _BREAKP OIN T (q) resolves breakpoints of clusters by
a)
b)
c)
Figure 2.5: a) SV subgraph of a variant with low mapping ambiguity around the breakpoints. b) SV subgraph of a variant with breakpoints on highly repeated regions. c) SV subgraph of two heterozygous overlapping variants (from simulated data)
Chapter 3
Results
We tested VALOR2 using both simulated and real data sets to compare the
pre-cision and recall rates of VALOR2 with one other tool that use Linked-Read
sequencing (Long Ranger [30], and two tools that use only Whole-genome shot-gun (WGS) data sets (DELLY [38] and LUMPY [11]). However, VALOR2 is
the only tool that can characterize interspersed duplications, therefore we limit our comparison to only inversions, and evaluate VALOR2’s performance on
du-plications using simulations. We find that VALOR2 is complementary to other
methods in inversion calls as VALOR2 aims to find larger (>80Kbp) inversions,
while the other tools focus on smaller (<100 Kbp) SVs.
3.1
Simulated data
3.1.1
Linked-Read simulation
We generated initial variation simulated represented as a VCF (Variation call format) file using VarSim [54]. VarSim does not generate any interspersed dupli-cations by default. Therefore we randomly replaced some of the tandem duplica-tion and inserduplica-tion variants with interspersed duplicaduplica-tions. Then we applied these
variants to a diploid genome and generated Linked-Reads using LRSIM [55].
3.1.2
Inserted variants
In this study we focused on discovery of inversions and interspersed duplications. However, to test the accuracy of VALOR2 in the presence of other variants, we
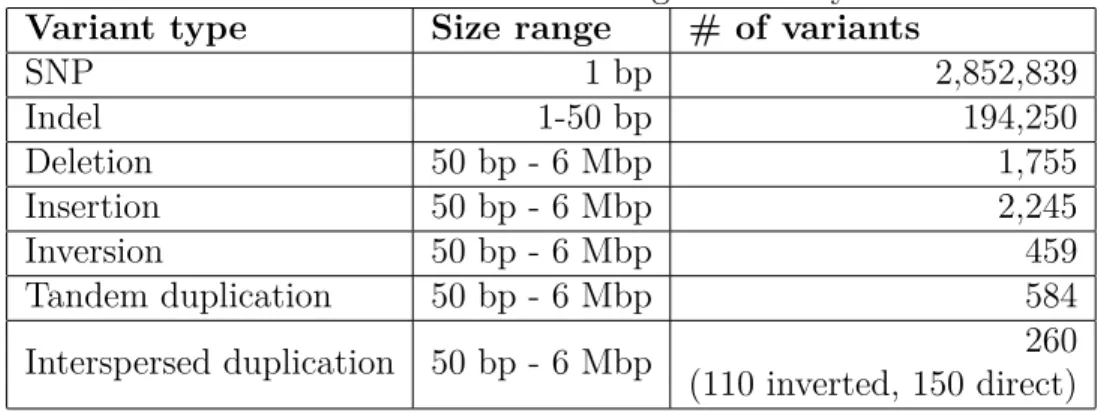
inserted 2,852,839 SNPs, 194,250 indels, 1,755 deletions, 2,225 insertions, 459 inversions, 584 tandem duplications and 260 interspersed duplications with sizes between 50 base pairs to 6 million base pairs (Table 3.1).
Table 3.1: Simulation statistics as generated by VarSim.
Variant type Size range # of variants
SNP 1 bp 2,852,839 Indel 1-50 bp 194,250 Deletion 50 bp - 6 Mbp 1,755 Insertion 50 bp - 6 Mbp 2,245 Inversion 50 bp - 6 Mbp 459 Tandem duplication 50 bp - 6 Mbp 584 Interspersed duplication 50 bp - 6 Mbp 260 (110 inverted, 150 direct)
3.1.3
Simulated results and comparison with other
meth-ods
We present the prediction performance of the tools we tested in Table 3.2. We found that VALOR2 is able to correctly predict >82% of large duplications
(in-verted and direct combined), and 76% of large inversions, while maintaining 92−96% precision for duplications and 98% precision for inversions. Long Ranger, the other algorithm that used Linked-Reads, correctly predicted 72% of the in-versions with 71% precision. Of the WGS-based tools, DELLY achieved high sensitivity for inversions and it was able to correctly predict 84% of large in-versions, however it suffered from very low precision (15%). On the contrary,
Table 3.2: Prediction performance evaluation using simulated structural variants.
Variant Tool # Sim # Calls Precision Recall
Duplication (direct) VALOR2 78 66 0.92 0.78
Duplication (inverted) VALOR2 56 51 0.96 0.88
Inversion VALOR2 94 65 0.98 0.76
LUMPY 42 0.90 0.47
DELLY 896 0.15 0.84
Long Ranger 92 0.71 0.72
We evaluate prediction performance of only large (>80Kbp for inversions,
>40Kbp for duplications) SVs. Note that LUMPY, DELLY, and Long Ranger
are not able to call interspersed duplications, thus we provide only the inversion prediction benchmark. Precision is calculated as T P
T P +F P, and recall is defined as T P
T P +F N, where TP: true positive, FP: false positive, FN: false negative.
LUMPY achieved high precision (90%), but it was able to discover only 47% of the simulated inversions. This is likely because neither DELLY nor LUMPY were optimized to find such large inversion events. Overall, VALOR2 performed the
best in terms of precision and recall balance in the simulation experiment.
3.2
Real data
3.2.1
NA12878
We also compared the performance of VALOR2 with that of Long Ranger on the
NA12878 germline genome, along with other commonly used SV callers (DELLY and LUMPY). NA12878 variant calls were obtained from 10X Genomics on their Chromium platform. From these we extracted 476 large inversions, 14 of which were also present in the InvFEST database (Table 3.3) but only one was exper-imentally validated. When given the same data, VALOR2 was able to call 135
inversions, a higher percentage of which were found in the InvFEST database that also included six experimentally validated inversions. Of the four tools we tested, VALOR2 had the largest number of validated inversions within its call
which only called 7 inversions, has fewer). This result further highlights the su-perior precision and recall of VALOR2. DELLY was able to identify 24 inversions
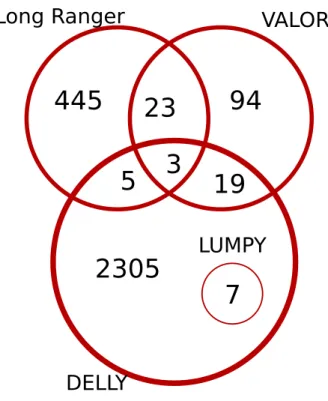
in the NA12878 genome which were also in the InvFEST database but called a total of 2,340 inversions. A majority of these calls were only predicted by DELLY and due to a lack of precision, may signify an over-representation of false positives (Figure 3.1). VALOR2was very useful in identifying large scale
duplica-tions by exploiting linked read information in the NA12878 sequencing data. We predicted multiple direct segmental duplications and inverted duplications with chromosomes 1 and 16 containing both classes of duplications (Table 3.4).
Table 3.3: Inversion prediction performance evaluation in the NA12878 genome using InvFEST database.
Called InvFEST-Valid. InvFEST-Pred. InvFEST-All
VALOR2 135 6 5 17
Long Ranger 476 1 10 14
LUMPY 7 0 0 0
DELLY 2,340 1 6 24
Here we only focus on large (> 80Kbp) inversions in the NA12878 genome. InvFEST-Valid.: validated inversions in the genome of NA12878, InvFEST-Pred.: predicted inversions in the genome of NA12878, InvFEST-All: all inversions re-ported in the InvFEST database [56], except those that are annotated as
VALOR
LUMPY
DELLY
Long Ranger
2305
94
445
23
3
5
19
7
Figure 3.1: Comparison of the inversion predictions (> 80 Kb) by VALOR2, Long
Ranger, DELLY, and LUMPY in the NA12878 genome.
3.2.2
CHM1
VALOR
InvFEST
16
117
84
Figure 3.2: Intersection of all inversions reported by InvFEST (validated or pre-dicted) with VALOR2 predictions on CHM1 genome.
Table 3.4: Segmental duplications predicted in the NA12878 genome using VALOR2.
Chr Start End Type Target No. of genes
1 120,600,786 120,692,870 Direct 1q21.1 1 1 144,832,884 145,751,706 Direct 1p22.3 25 1 145,062,336 145,116,024 Direct 1p11.2 16 86,451,165 86,498,200 Direct 16q11.2 17 21,522,544 21,551,840 Direct 17p11.2 1 17,019,657 17,111,181 Inverted 1q42.3 4 1 145,983,326 146,027,347 Inverted 1p22.3 3 4 15,160 67,199 Inverted 4q35.2 2 8 2,189,297 2,290,508 Inverted 8p23.2 10 46,965,140 47,022,150 Inverted 10q11.22 2 11 4,250,956 4,331,367 Inverted 11p15.4 16 21,542,145 21,593,639 Inverted 16p12.2 16 22,543,245 22,709,969 Inverted 16p12.2 2 X 153,423,995 153,485,001 Inverted Xq28 3
We tested VALOR2 using Linked-Read data set of a haploid human genome cell
line (CHM1 [57, 58, 59]). We used VALOR2 to find inversions and segmental
du-plications. Overall, VALOR2characterized 133 inversions (>80 Kbp), 14 inverted
and 22 direct segmental duplications (>40 Kb). Unfortunately there are no gold standard data sets for segmental duplications for this genome available in the literature, and the largest previously reported inversion in [59] is 36 Kbp, which is less than the smallest inversion that VALOR2predicts. We therefore compared
only with the large inversions in the InvFEST database, and we found that 10% (16/117) of VALOR2 predictions were present in InvFEST (Figure 3.2).
Chapter 4
Discussion and Future Work
In this thesis, we present novel algorithms to effectively utilize the encoded long-range information in Linked-Read data for the purpose of characterizing large-scale structural variations. The current state-of-the-art SV detection techniques using Linked-Read like Long Ranger are optimized for certain range of SV sizes. However, VALOR2 can detect events including segmental duplications of sizes
larger than 100 Kb with high precision.
Downside of the VALOR2 algorithm is that, minimum size of its predictions
is limited by molecule size of the sequencing platform. Furthermore, due to low coverage of the molecules and miss-mappings, it is difficult to assess sizes of the molecules from mapping positions. Another issue that needs improvement in VALOR2 algorithm is low specificity at smaller events.
In general VALOR2 offers precise predictions for large structural variations.
It is robust to mapping ambiguity and there is no theoretical upper bound for the sizes it can discover. It is designed to be complementary to the SV detection algorithms that target smaller variants.
4.1
Works in progress
4.1.1
Deletion discovery
In addition to inversions and segmental duplications, we also implemented a prototype algorithm for deletion discovery in VALOR2. Unlike other
intra-chromosomal variations, deletions show single split molecule and read-pair signa-tures (Figure 4.1). To further improve accuracy of VALOR2 we apply molecule
depth filtering and remove predictions with depth > µ/2 + σ (Figure 2.2).
Reference Sample a1 a2 B A A B a1 a2
Figure 4.1: Split molecule and read pair signature of a deletion.
While in the preliminary simulation results VALOR2 was the most precise, its
recall was lower than other tools (Table 4.1). We’re currently investigating the causes for the low recall rate and cases where VALOR2 overlooks deletions.
Table 4.1: Prediction performance evaluation using simulated deletions. Variant Tool # Simulated # Predicted Precision Recall
Deletion VALOR2 71 54 0.98 0.76
LUMPY 264 0.22 0.83
DELLY 640 0.11 0.89
Long Ranger 168 0.42 0.93
We evaluate prediction performance of only large (>90Kbp) deletions. Precision is calculated as T P
T P +F P, and recall is defined as T P
T P +F N, where TP: true positive,
4.1.2
Inter-chromosomal events
In 10xG Linked-Read data a barcode may be seen in up to 30 different molecules randomly distributed to whole genome. In a single chromosome this corresponds to 2 ~ 5 molecules. VALOR2 exploits the fact that number of false candidate
splits is between(5 2
)
= 10 where there are no splits in any of molecules with that barcode and (5∗2
2
)
= 45 where all molecules of that barcode are split. Even in the worst case, complexity introduced by exhaustive split checking is negligible for intra-chromosomal variations. Also you should note that reaching the upper bound of this range is quite unlikely.
Reference chr A
Sample chr A
Reference chr B
Sample chr B
Figure 4.2: Split molecule and read pair signature of translocation. Where a segment of DNA is copied from chromosome B to A.
Yet, exhaustive trial of split molecules is infeasible for inter-chromosomal events. Since expected number of molecules for each barcode is ~30, for each barcode we are required to check hundreds to thousands of false split candidates. Moreover, split molecule signature of translocations involve 3 splits (Figure 4.2), which further increases the complexity.
Table 4.2: Read pair signatures and corresponding interchromosomal structural variants. Each pair should map to different chromosomes
Mapping Strands Variants
++ Inverted Translocations and Inverted Duplications +− Direct Duplications and Direct Translocations
−+ Direct Duplications and Direct Translocations
−− Inverted Translocations and Inverted Duplications
To resolve this problem, we designed a complementary algorithm to VALOR2
for inter-chromosomal events. For each barcoded read pair with ends on different chromosomes, we search for molecules of the same barcode near each read (Figure 4.3). Since coverage of each molecule is low, only a few of the molecules will contain a discordant read and majority of the split molecules will be overlooked. But we can recover rest of the split molecules by searching molecules around the initially discovered splits. Rest of the algorithm is very similar to original VALOR2, where algorithm is executed for each chromosome pair instead of each
chromosome. chr A chr B a b c
Figure 4.3: a and b are molecules with the same barcode in different chromosomes. c is a discordant read pair with one end near a other end near b. We allow gaps between reads and molecules to cover for low coverage. We allow overlaps to be robust to repeats.
4.2
Future directions
4.2.1
Structural variation discovery on tumor samples
Due to their uncontrolled division, tumor cells mutate frequently. Consequently many structural variations which cannot be observed on germline samples can be found at tumor cells. However, structural variation discovery on somatic samples is not a straight-forward task. Heterogeneous nature of somatic samples makes it difficult predict variations, since coverage of the variants change in proportion to their frequency in the sample cells. Yet, discovery of structural variation on tumor samples is worth exploring as it can enhance our understanding of cancer.
4.2.2
Resolving overlapping events
In a recent study 21% of the previous inversion predictions shown to contain one or more deletions [51]. Overlapping variations are rare on a germline sample of a healthy human (compared to human genome reference). Yet studies on multiple species, ancient humans and cancer can benefit from accurate characterization of overlapping structural variation. While some of the overlapping variations can hide split molecule signatures, VALOR2 can be modified to identify overlapping
variants with visible signatures.
4.2.3
Expanding the range of predictions
Because of the low coverage of 10xG molecules, it is difficult to detect short-range splits. For this reason, we limited VALOR2 to only discover inversions and
dele-tions with size > 2µ and duplicadele-tions with size > µ, where µ is the mean molecule size. Inversion and deletion splits map around variant breakpoints, on the other hand duplication splits map to source and copy positions. Hence, vagueness of small splits influence minimum copy distance, rather than duplication size. Yet we
choose to limit minimum duplication size to ensure that VALOR2can confidently
recover split molecules. While it is not feasible to reduce this limit for inversions and deletions, it is doable for duplications. We can expand split molecule model to allow barcoded discordant reads to form split molecules with other molecules with the same barcode (Figure 4.4).
Reference Sample a1 a2b1 b2 a2 b1 a1 b2 D C B D A A
Figure 4.4: A model to discover smaller duplications, where split molecule infor-mation is lost due to small size of the duplication. We can look for discordant read pairs which share barcodes with the molecules around the target. AB and CD molecules are on the duplication, B and C are lost due to low coverage.
Bibliography
[1] J. M. Zook, B. Chapman, J. Wang, D. Mittelman, O. Hofmann, W. Hide, and M. Salit, “Integrating human sequence data sets provides a resource of benchmark snp and indel genotype calls,” Nat Biotechnol, vol. 32, pp. 246– 251, Mar 2014.
[2] J. M. Zook, D. Catoe, J. McDaniel, L. Vang, N. Spies, A. Sidow, Z. Weng, Y. Liu, C. E. Mason, N. Alexander, E. Henaff, A. B. R. McIntyre, D. Chan-dramohan, F. Chen, E. Jaeger, A. Moshrefi, K. Pham, W. Stedman, T. Liang, M. Saghbini, Z. Dzakula, A. Hastie, H. Cao, G. Deikus, E. Schadt, R. Sebra, A. Bashir, R. M. Truty, C. C. Chang, N. Gulbahce, K. Zhao, S. Ghosh, F. Hyland, Y. Fu, M. Chaisson, C. Xiao, J. Trow, S. T. Sherry, A. W. Zaranek, M. Ball, J. Bobe, P. Estep, G. M. Church, P. Marks, S. Kyriazopoulou-Panagiotopoulou, G. X. Y. Zheng, M. Schnall-Levin, H. S. Ordonez, P. A. Mudivarti, K. Giorda, Y. Sheng, K. B. Rypdal, and M. Salit, “Extensive sequencing of seven human genomes to characterize benchmark reference materials,” Scientific data, vol. 3, p. 160025, June 2016.
[3] C. Alkan, B. P. Coe, and E. E. Eichler, “Genome structural variation dis-covery and genotyping,” Nat Rev Genet, vol. 12, pp. 363–376, May 2011.
[4] F. Sanger and A. Coulson, “A rapid method for determining sequences in dna by primed synthesis with dna polymerase,” Journal of Molecular Biology, vol. 94, no. 3, pp. 441 – 448, 1975.
[5] “Summary of findings – cost-effectiveness of next generation sequencing,” Feb 2014.
[6] J. O. Korbel, A. E. Urban, J. P. Affourtit, B. Godwin, F. Grubert, J. F. Simons, P. M. Kim, D. Palejev, N. J. Carriero, L. Du, B. E. Taillon, Z. Chen, A. Tanzer, A. C. E. Saunders, J. Chi, F. Yang, N. P. Carter, M. E. Hurles, S. M. Weissman, T. T. Harkins, M. B. Gerstein, M. Egholm, and M. Snyder, “Paired-end mapping reveals extensive structural variation in the human genome,” Science, vol. 318, pp. 420–426, Oct 2007.
[7] F. Hormozdiari, C. Alkan, E. E. Eichler, and S. C. Sahinalp, “Combinatorial algorithms for structural variation detection in high-throughput sequenced genomes,” Genome Res, vol. 19, pp. 1270–1278, Jul 2009.
[8] P. Medvedev, M. Stanciu, and M. Brudno, “Computational methods for dis-covering structural variation with next-generation sequencing,” Nat Methods, vol. 6, pp. S13–S20, Nov 2009.
[9] S. Sindi, E. Helman, A. Bashir, and B. J. Raphael, “A geometric approach for classification and comparison of structural variants,” Bioinformatics, vol. 25, pp. i222–i230, June 2009.
[10] I. Hajirasouliha, F. Hormozdiari, C. Alkan, J. M. Kidd, I. Birol, E. E. Eichler, and S. C. Sahinalp, “Detection and characterization of novel sequence inser-tions using paired-end next-generation sequencing,” Bioinformatics, vol. 26, pp. 1277–1283, May 2010.
[11] R. M. Layer, C. Chiang, A. R. Quinlan, and I. M. Hall, “LUMPY: a prob-abilistic framework for structural variant discovery,” Genome Biol, vol. 15, no. 6, p. R84, 2014.
[12] A. Soylev, C. Kockan, F. Hormozdiari, and C. Alkan, “Toolkit for automated and rapid discovery of structural variants,” Methods, vol. 129, pp. 3–7, 2017.
[13] C. Firtina and C. Alkan, “On genomic repeats and reproducibility,”
Bioin-formatics, vol. 32, pp. 2243–2247, Aug 2016.
[14] T. J. Treangen and S. L. Salzberg, “Repetitive DNA and next-generation sequencing: computational challenges and solutions,” Nat Rev Genet, vol. 13, pp. 36–46, Jan 2012.
[15] A. C. English, W. J. Salerno, and J. G. Reid, “PBHoney: identifying ge-nomic variants via long-read discordance and interrupted mapping,” BMC
Bioinformatics, vol. 15, p. 180, 2014.
[16] F. J. Sedlazeck, P. Rescheneder, M. Smolka, H. Fang, M. Nattestad, A. von Haeseler, and M. C. Schatz, “Accurate detection of complex structural vari-ations using single-molecule sequencing.,” Nature methods, vol. 15, pp. 461– 468, June 2018.
[17] M. Jain, S. Koren, K. H. Miga, J. Quick, A. C. Rand, T. A. Sasani, J. R. Tyson, A. D. Beggs, A. T. Dilthey, I. T. Fiddes, S. Malla, H. Marriott, T. Nieto, J. O’Grady, H. E. Olsen, B. S. Pedersen, A. Rhie, H. Richardson, A. R. Quinlan, T. P. Snutch, L. Tee, B. Paten, A. M. Phillippy, J. T. Simpson, N. J. Loman, and M. Loose, “Nanopore sequencing and assembly of a human genome with ultra-long reads.,” Nature biotechnology, vol. 36, pp. 338–345, Apr. 2018.
[18] A. Ritz, A. Bashir, S. Sindi, D. Hsu, I. Hajirasouliha, and B. J. Raphael, “Characterization of structural variants with single molecule and hybrid se-quencing approaches,” Bioinformatics, vol. 30, pp. 3458–3466, Dec 2014.
[19] Y. Mostovoy, M. Levy-Sakin, J. Lam, E. T. Lam, A. R. Hastie, P. Marks, J. Lee, C. Chu, C. Lin, �. Džakula, H. Cao, S. A. Schlebusch, K. Giorda, M. Schnall-Levin, J. D. Wall, and P.-Y. Kwok, “A hybrid approach for de novo human genome sequence assembly and phasing.,” Nature methods, vol. 13, pp. 587–590, July 2016.
[20] L. C. Xia, J. M. Bell, C. Wood-Bouwens, J. J. Chen, N. R. Zhang, and H. P. Ji, “Identification of large rearrangements in cancer genomes with barcode linked reads.,” Nucleic acids research, Nov. 2017.
[21] S. Yeo, L. Coombe, R. L. Warren, J. Chu, and I. Birol, “ARCS: scaffolding genome drafts with linked reads.,” Bioinformatics, vol. 34, pp. 725–731, Mar. 2018.
[22] J.-S. Seo, A. Rhie, J. Kim, S. Lee, M.-H. Sohn, C.-U. Kim, A. Hastie, H. Cao, J.-Y. Yun, J. Kim, J. Kuk, G. H. Park, J. Kim, H. Ryu, J. Kim, M. Roh,
J. Baek, M. W. Hunkapiller, J. Korlach, J.-Y. Shin, and C. Kim, “De novo as-sembly and phasing of a Korean human genome.,” Nature, vol. 538, pp. 243– 247, Oct. 2016.
[23] N. I. Weisenfeld, V. Kumar, P. Shah, D. M. Church, and D. B. Jaffe, “Di-rect determination of diploid genome sequences.,” Genome research, vol. 27, pp. 757–767, May 2017.
[24] D. C. Danko, D. Meleshko, D. Bezdan, C. Mason, and I. Hajirasouliha, “Minerva: an alignment and reference free approach to deconvolve linked-reads for metagenomics,” bioRxiv, 2017.
[25] D. A. Skelly, G. T. Squiers, M. A. McLellan, M. T. Bolisetty, P. Robson, N. A. Rosenthal, and A. R. Pinto, “Single-cell transcriptional profiling re-veals cellular diversity and intercommunication in the mouse heart.,” Cell
reports, vol. 22, pp. 600–610, Jan. 2018.
[26] F. A. Wolf, P. Angerer, and F. J. Theis, “SCANPY: large-scale single-cell gene expression data analysis.,” Genome biology, vol. 19, p. 15, Feb. 2018.
[27] S. Aibar, C. B. González-Blas, T. Moerman, V. A. Huynh-Thu, H. Imrichova, G. Hulselmans, F. Rambow, J.-C. Marine, P. Geurts, J. Aerts, J. van den Oord, Z. K. Atak, J. Wouters, and S. Aerts, “SCENIC: single-cell regulatory network inference and clustering.,” Nature methods, vol. 14, pp. 1083–1086, Nov. 2017.
[28] G. X. Y. Zheng, B. T. Lau, M. Schnall-Levin, M. Jarosz, J. M. Bell, C. M. Hindson, S. Kyriazopoulou-Panagiotopoulou, D. A. Masquelier, L. Merrill, J. M. Terry, P. A. Mudivarti, P. W. Wyatt, R. Bharadwaj, A. J. Makarewicz, Y. Li, P. Belgrader, A. D. Price, A. J. Lowe, P. Marks, G. M. Vurens, P. Hardenbol, L. Montesclaros, M. Luo, L. Greenfield, A. Wong, D. E. Birch, S. W. Short, K. P. Bjornson, P. Patel, E. S. Hopmans, C. Wood, S. Kaur, G. K. Lockwood, D. Stafford, J. P. Delaney, I. Wu, H. S. Or-donez, S. M. Grimes, S. Greer, J. Y. Lee, K. Belhocine, K. M. Giorda, W. H. Heaton, G. P. McDermott, Z. W. Bent, F. Meschi, N. O. Kondov, R. Wilson, J. A. Bernate, S. Gauby, A. Kindwall, C. Bermejo, A. N. Fehr, A. Chan,
S. Saxonov, K. D. Ness, B. J. Hindson, and H. P. Ji, “Haplotyping germline and cancer genomes with high-throughput linked-read sequencing.,” Nature
biotechnology, vol. 34, pp. 303–311, Mar. 2016.
[29] M. Eslami Rasekh, G. Chiatante, M. Miroballo, J. Tang, M. Ventura, C. T. Amemiya, E. E. Eichler, F. Antonacci, and C. Alkan, “Discovery of large genomic inversions using long range information,” BMC Genomics, vol. 18, p. 65, Jan. 2017.
[30] P. Marks, S. Garcia, A. M. Barrio, K. Belhocine, J. Bernate, R. Bharad-waj, K. Bjornson, C. Catalanotti, J. Delaney, A. Fehr, et al., “Resolving the full spectrum of human genome variation using linked-reads,” BioRxiv, p. 230946, 2017.
[31] N. Spies, Z. Weng, A. Bishara, J. McDaniel, D. Catoe, J. M. Zook, M. Salit, R. B. West, S. Batzoglou, and A. Sidow, “Genome-wide reconstruction of complex structural variants using read clouds.,” Nature methods, vol. 14, pp. 915–920, Sept. 2017.
[32] The 1000 Genomes Project Consortium, “A map of human genome variation from population-scale sequencing,” Nature, vol. 467, pp. 1061–1073, Oct 2010.
[33] E. Tuzun, A. J. Sharp, J. A. Bailey, R. Kaul, V. A. Morrison, L. M. Pertz, E. Haugen, H. Hayden, D. Albertson, D. Pinkel, M. V. Olson, and E. E. Eichler, “Fine-scale structural variation of the human genome,” Nat Genet, vol. 37, pp. 727–732, Jul 2005.
[34] C. Alkan, J. M. Kidd, T. Marques-Bonet, G. Aksay, F. Antonacci, F. Hor-mozdiari, J. O. Kitzman, C. Baker, M. Malig, O. Mutlu, S. C. Sahinalp, R. A. Gibbs, and E. E. Eichler, “Personalized copy number and segmen-tal duplication maps using next-generation sequencing,” Nat Genet, vol. 41, pp. 1061–1067, Oct 2009.
[35] A. Abyzov, A. E. Urban, M. Snyder, and M. Gerstein, “CNVnator: an ap-proach to discover, genotype, and characterize typical and atypical CNVs
from family and population genome sequencing,” Genome Res, vol. 21, pp. 974–984, Jun 2011.
[36] F. Hormozdiari, I. Hajirasouliha, P. Dao, F. Hach, D. Yorukoglu, C. Alkan, E. E. Eichler, and S. C. Sahinalp, “Next-generation VariationHunter: com-binatorial algorithms for transposon insertion discovery,” Bioinformatics, vol. 26, pp. i350–i357, Jun 2010.
[37] K. Ye, M. H. Schulz, Q. Long, R. Apweiler, and Z. Ning, “Pindel: a pattern growth approach to detect break points of large deletions and medium sized insertions from paired-end short reads,” Bioinformatics, vol. 25, pp. 2865– 2871, Nov 2009.
[38] T. Rausch, T. Zichner, A. Schlattl, A. M. Stütz, V. Benes, and J. O. Korbel, “DELLY: structural variant discovery by integrated paired-end and split-read analysis,” Bioinformatics, vol. 28, pp. i333–i339, Sep 2012.
[39] J. Huddleston, M. J. Chaisson, K. Meltz Steinberg, W. Warren, K. Hoekzema, D. S. Gordon, T. A. Graves-Lindsay, K. M. Munson, Z. N. Kronenberg, L. Vives, P. Peluso, M. Boitano, C.-S. Chin, J. Korlach, R. K. Wilson, and E. E. Eichler, “Discovery and genotyping of structural varia-tion from long-read haploid genome sequence data,” Genome research, Nov. 2016.
[40] H. C. Mefford and E. E. Eichler, “Duplication hotspots, rare genomic dis-orders, and common disease,” Current opinion in genetics & development, vol. 19, no. 3, pp. 196–204, 2009.
[41] L. R. Osborne, M. Li, B. Pober, D. Chitayat, J. Bodurtha, A. Mandel, T. Costa, T. Grebe, S. Cox, L. C. Tsui, and S. W. Scherer, “A 1.5 million-base pair inversion polymorphism in families with Williams-Beuren syndrome,”
Nat Genet, vol. 29, pp. 321–325, Nov 2001.
[42] G. Gimelli, M. A. Pujana, M. G. Patricelli, S. Russo, D. Giardino, L. Larizza, J. Cheung, L. Armengol, A. Schinzel, X. Estivill, and O. Zuffardi, “Genomic
inversions of human chromosome 15q11-q13 in mothers of Angelman syn-drome patients with class ii (bp2/3) deletions,” Hum Mol Genet, vol. 12, pp. 849–858, Apr 2003.
[43] R. Visser, O. Shimokawa, N. Harada, N. Niikawa, and N. Matsumoto, “Non-hotspot-related breakpoints of common deletions in sotos syndrome are lo-cated within destabilised dna regions,” J Med Genet, vol. 42, p. e66, Nov 2005.
[44] L. Potocki, W. Bi, D. Treadwell-Deering, C. M. Carvalho, A. Eifert, E. M. Friedman, D. Glaze, K. Krull, J. A. Lee, R. A. Lewis, R. Mendoza-Londono, P. Robbins-Furman, C. Shaw, X. Shi, G. Weissenberger, M. Withers, S. A. Yatsenko, E. H. Zackai, P. Stankiewicz, and J. R. Lupski, “Characteriza-tion of potocki-lupski syndrome (dup(17)(p11.2p11.2)) and delinea“Characteriza-tion of a dosage-sensitive critical interval that can convey an autism phenotype,” The
American Journal of Human Genetics, vol. 80, no. 4, pp. 633 – 649, 2007.
[45] C. R. Soler-Alfonso, K. J. Motil, C. L. Turk, P. J. Robbins-Furman, E. M. Friedman, F. Zhang, J. R. Lupski, J. K. Fraley, and L. Potocki, “Potocki-lupski syndrome: a microduplication syndrome associated with oropharyn-geal dysphagia and failure to thrive.,” The Journal of pediatrics, vol. 158 4, pp. 655–659.e2, 2011.
[46] P. Carmona-Mora, C. A. Encina, C. P. Canales, L. Cao, J. Molina, P. Kairath, J. I. Young, and K. Walz, “Functional and cellular character-ization of human retinoic acid induced 1 (rai1) mutations associated with smith-magenis syndrome,” BMC Molecular Biology, vol. 11, p. 63, Aug 2010.
[47] K. Buiting, “Prader–willi syndrome and angelman syndrome,”
Ameri-can Journal of Medical Genetics Part C: Seminars in Medical Genetics,
vol. 154C, no. 3, pp. 365–376.
[48] L. Huynh and F. Hormozdiari, “Contribution of structural variation to genome structure: Tad fusion discovery and ranking,” bioRxiv, 2018.
[49] J. M. Kidd, G. M. Cooper, W. F. Donahue, H. S. Hayden, N. Sampas, T. Graves, N. Hansen, B. Teague, C. Alkan, F. Antonacci, E. Haugen,
![Figure 2.2: Molecule depth histogram of NA12878 in chr16 of non-zero bins. Data from [1, 2]](https://thumb-eu.123doks.com/thumbv2/9libnet/5627498.111611/26.918.195.706.439.844/figure-molecule-depth-histogram-na-zero-bins-data.webp)