' 4 2 Л
ANALYSES
A DISSERTATION
SUBMITTED TO THE DEPARTMENT OF ELECTRICAL AND ELECTRONICS
ENGINEERING
AND THE INSTITUTE OF ENGINEERING AND SCIENCES
OF BILKENT UNIVERSITY
IN PARTIAL FULFILLMENT OF THE REQUIREMENTS
FOR THE DEGREE OF
DOCTOR OF PHILOSOPHY
By
Burak Acar
March 8, 2000
UJ G
(UO • mfor the degree of Doctor of Philosophy.
....
Hayreliin Koyrnen, p l. D. (Supervisor)
I certify that I have read this thesis and that in my opin ion it is fully adequate, in scope and in quality, as a thesis for the degree of Doctor of Philosophy.
( ! )
Orhan Arikan, Ph. D.
I certify that I have read this thesis and that in my opin ion it is fully adequate, in scope and in quality, as a thesis for the degree of Doctor of Philosophy.
I certify that I have read this thesis and that in my opin ion it is fully adequate, in scope and in quality, as a thesis for the degree of Doctor of Philosophy.
ZiyaOder, Ph. D.
Approved for the Institute of Engineering and Sciences:
Prof. Dr. Mehinet
NEW TECHNIQUES FOR VENTRICULAR
REPOLARIZATION AND HEART RATE VARIABILITY
ANALYSES
Burak Acar
Ph. D. in Electrical and Electronics Engineering
Supervisor: Hayrettin Köymen, Ph. D.
March 8, 2000
This thesis is composed of two parts: i) Development of a fully automatic Heart Rate Variability (HRV) analysis method, and ii) development of new methods for ventricular repolarization (T wave) analysis.
The first part of this study deals with fully automatic measurement of heart rate variability (HRV) in short term electrocardiograms. In short, HRV analysis is the spec tral analysis of the heart rate signal. Presently, all existing HRV analysis programs require user intervention for ectopic beat identification which is essential for reliable HRV analysis. This makes HRV studies in large populations problematic.
A fully automatic algorithm to discriminate ventricular and supra-ventricular ectopic beats from normal beats is pre.sented. The method incorporates several approaches and uses three EGG leads. It uses the template matching for the basic morphology check of the QRS complex and the P-wave, the timing information to avoid unnecessary computation and to adjust the thresholds and also looks for a special QRS morphology which is common in ventricular ectopic beats. The method is tested on a set of real
We have obtained 99% specificity and SVE sensitivity and 98% VE sensitivity and thus concluded that fully automatic HRV analysis is feasible.
The second part of this thesis is on ventricular repolarization analysis (T wave anal ysis). It has been shown that heterogeneity in ventricular repolarization is a mark of abnormality and can be used for risk stratification. Several methods have been proposed to measure this heterogeneity, among which the QT interval measurements are the most popular ones. After a short discussion of the existing methods, we propose three new approaches for T wave analysis, which are aimed to overcome the drawbacks of the ex isting methods: The spatial and temporal variations in the T wave morphology and the wavefront direction difference between the ventricular depolarization and repolarization waves.
All of the descriptors are defined in an ECG decomposition space constructed by Singular Value Decomposition. The spatial variation characterizes the morphology dif ferences between standard leads. The temporal variation measures the change in inter lead relations throughout the T wave. The wavefront direction difference quantizes the difference between the progress of the two processes. None of them requires time domain measurements thus avoid the inaccuracies associated with conventional methods.
The new methods are compared with the conventional ones in a set of 1100 normal ECGs. The short-term intra-subject reproducibility of the new and the conventional methods is compared in a set of 760 normal (recorded from 76 normal subjects) and 630 abnormal (recorded from 63 HGM patients) EGGs. The new descriptors’ ability to discriminate normal and abnormal EGGs (both in univariate and multivariate models) is also analyzed on the same data set. A two-way blind study conducted on a set of AMI (Acute Myocardial Infarction) patients have shown that the new methods are able to discriminate the high risk group. The conventional methods were shown to be useless in
We have concluded that the new descriptors do not correlate with the conventional ones, are more reproducible, lead to more significant separation between normal and abnormal ECGs in both univariate and multivariate models.
Keywords : Automatic HRV Analysis, Ectopic Beat Identification, Whitehall II Study, ECG Analysis, T Wave Analysis, Repolarization Heterogeneity, Spatial and Tempo ral Variation, Morphology Variation, Wavefront Direction Characteristics, QT Interval, Singular Value Decomposition
KALP HIZI DEĞİŞKENLİĞİ ANALİZİ
VE
KARINCIKLARIN REPOLARİZASYONUNUN İNCELENMESİ
İÇİN YENİ YAKLAŞIMLAR
Burak Acar
Elektrik ve Elektronik Mühendisliği Doktora
Tez Yöneticisi: Prof. Dr. Hayrettin Köymen
8 Mart 2000
Bu doktora tezi iki bölümden oluşmaktadır; i) Tam otomatik Kalp Hızı Değişkenliği analiz yönteminin geliştirilmesi, ve ii) karıncık repolarizasyonu (T dalgası) analizi için yeni yöntemlerin geliştirilmesi.
İlk bölüm kısa EKG kayıtlarında tam otomatik kalp hızı değişkenliği (KHD) anal izi üzerinedir. KHD analizi kısaca nabzın frekans analizi şeklinde tanımlanabilir. Kul lanılmakta olan KHD analizi sistemleri, analizin güvenilirliği için çok önemli olan ektopik kalp atımlarının ayıklanması için bir kullanıcıya ihtiyaç duyarlar. Bu durum geniş hasta gruplarında KHD analizini zorlaştırır.
Bu bölümde karıncık ve kulakçıklardan kaynaklanan ektopik atımların (VE ve SVE) normal atımlardan ayırdedilmesi için tam otomatik bir algoritma sunulmaktadır. Sunulan yöntem değişik yaklaşımları birleştirmekte ve üç EKG kanalını kullanmaktadır. QRS kompleksi ve P dalgası temel morfoloji analizi için şablon eşleme (template matching)
atım larda sık görülen özel bir morfoloji de kontrol edilmektedir. Sistemimiz gerçek EKG kayıtları üzerinde denenmiş ve duyarlılık/özgüllük (sensitivity/specificity) temelinde is tatistiksel olarak analiz edilmiştir. Sistemin farklı üç EKG kanalı ve tek kanal kul lanıldığındaki performansı da incelenmiştir.
Sistemimizin %99 özgüllüğe, %99 SVE ve %98 V^E duyarlılığına ulaştığı gözlenmiş ve tam otomatik KHD analizinin uygulanabilirliği sonucuna varılmıştır.
İkinci bölüm karıncık repolarizasyonu (T dalgası) analizi üzerinedir. Karıncık repo- larizasyonunun heterojenliğinin bir anormali göstergesi olduğu ve risk değerlendirmesinde kullanılabileceği geçmişte gösterilmiştir. Bu heterojenliğin ölçülmesi için değişik yöntemler ortaya atıldıysa da, QT aralığının ölçümlerine dayananlar popülerlik kazanmıştır. Ancak bu yöntemlerin de pek çok aksayan yönleri vardır. Bu bölümde varolan yöntemlerin kısa bir eleştirisinden sonra, bunlara alternatif üç yöntem sunulmuştur: T dalgası morfolo jisinin zaman ve lokasyona göre değişkenliğinin incelenmesi ile karıncıkların depolariza- syon ve repolarizasyon dalgalarının vektörel olarak yönleri arasındaki farkın incelenmesi.
Bütün yeni parametreler EKG sinyallerinden tekil değer ayrıştırılması yöntemi ile oluşturulan uzayda tanımlanmıştır. Lokasyona göre değişkenlik farklı EKG kanalları arasındaki morfoloji farkını ifade eder. Zamana göre değişkenlik EKG kanalları arasındaki ilişkinin T dalgası süresince değişmesini ifade eder. Karıncıkların depolarizasyon ve repolarizasyon dalgalarının vektörel olarak karşılaştırılması ise bu iki olayın ilerleme sekanslarının karşılaştırılmasını ifade eder. Yeni yöntemlerin hiçbiri zaman boyutunda hassas ölçümlere gerek duymadıklarından, konvansiyonel yöntemlerin hatalarından arın dırılmışlardır.
Yeni ve konvansiyonel yöntemler öncelikle 1100 normal EKG üzerinde test edilmiştir. Bir hastadan arka arkaya yapılan ölçümlerde ölçülen parametrelerin tekrar edilebilirliği ise 760 normal (76 hastadan kaydedilmiştir) ve 630 anormal (63 hastadan kaydedilmiştir)
dial Infarction) hastası üzerinde yaptığımız çift kör çalışma (two-way blind study) ile yeni yöntemler ile yüksek risk grubunun ayırdedilebildiği gösterilmiştir. Konvansiyonel yöntemlerin aynı hasta grubunda benzer bir ayrım yapamadığı literatürde vardır.
Yeni yöntemlerin konvansiyonel yöntemlere göre EKG'deki farklı bilgileri kullandığı (eski ve yeni yöntemler arasında bir örtüşmenin olmadığı), yeni yöntemlerin daha tekrar edilebilir olduğu, normal ve anormal EKG’leri daha iyi ayırabildiği sonucuna varılmıştır.
Anahtar Sözcükler: Otomatik Kalp Hızı Değişkenliği Analizi, Ektopik Atımların Tanın ması, Whitehall I I Projesi, EKG Analizi, T Dalgası Analizi, Repolarizasyon Hetero- jenliği, Uzaysal ve Zamansal Değişkenlik, Morfoloji Değişkeliği, Dalga Cephesi Yönü
I would like to express my sincere gratitude to Dr. Hayrettin Kdymen for his support both technically and in terms of the oppurtunities he provided throughout my study.
I would like to thank to the members of my dissertation jury for reading the manuscript and commenting on the thesis. Special thanks are due to Dr. Orhan Ankan who have guided me whenever I needed and to Dr. Ziya Ider who has helped me a lot during my collaboration with Kardiosis Ltd. In the name of Mustafa Solmaz, I would like to thank all of my colleagues at Kardiosis Ltd. who have supported me technically.
I am indebted to Dr. Marek Malik from St. George’s Hospital Medical School, Lon don, UK, with whom I conducted the major part of this research while working as a research fellow in his group. In the name of Dr. Malik, I thank all of my friends in London for their technical support and friendship during our collaboration.
Thanks to all of my friends I met during my 10 years at Bilkent University, for everything they did and especially for the meaning they added to my life. I might not have pursued a PhD unless they existed.
Lots of thanks to my parents, my brother and my grandmother for all the support they provided throughout my life and their trust in me.
1 INTRODUCTION
2 HEART RATE VARIABILITY ANALYSIS 5
2.1 BACKGROUND 5 2.2 P R O B L E M ... 11 2.3 METHOD 12 2.3.1 Template C re a tio n ... 13 2.3.2 QRS D e te ction ... 16 2.3.3 Preliminary Checks... 16
2.3.4 Ectopic Beat Identification... 17
2.4 IM P LE M E N T A T IO N ... 19
2.5 EXPERIMENTS 19 2.5.1 Data S e t ... 19
2.5.2 Statistical A n alysis... 20
2.6 DISCUSSION 24 2.6.1 L im ita tio n s ... 24
2.6.2 Using A Composite Correlation Coefficient 25
2.6.3 The Effect of Using The Derivatives... 28
2.7 SINGLE LEAD HRV ANALYSIS . . 29
2.7.1 Experiments 29
2.7.2 Discussion 30
2.8 C O N C LU S IO N ... 34
3 VENTRICULAR REPOLARIZATION ANALYSIS 36
3.1 BACKGROUND .36
3.1.1 Basis of Ventricular Repolarization A nalysis... 36 3.1.2 QT Interval A n a lysis... 37
3.1.3 Alternative Approaches 42
3.2 PROBLEM AND APPR O AC H ... 51
3.3 METHOD .53
3.3.1 Mathematical Background... 53 3.3.2 Algorithm - ECG Processing... 55
3.3.3 Algorithm - Descriptors 61
3.4 IM P L E M E N T A T IO N ... 66 3.5 A N A L Y S IS ... 67
3.5.2 Correspondence Between New and Conventional Descriptors . . . 68
3.5.3 Short Term Reproducibility 71
3.5.4 Normal Ranges... 74
3.5.5 Univariate Analysis - Normal vs. HCM 75
3.5.6 Multivariate Analysis - Normal vs. HCM 78
3.5.7 Analysis of ECGs Recorded In Standing Position 81
3.5.8 Mean Values Of T Wave Descriptors In DCM S ubjects... 84
3.6 DISCUSSION 87
3.6.1 Interpretation of the R esults... 87
3.6.2 Relation to Previous M e th o d s ... 89 3.6.3 L im ita tio n s ... 89
3.7 A 2-WAY BLIND STUDY ON AMI GROUP 92
3.7.1 Data S e t ... 93
3.7.2 ECG Analysis... 93 3.7.3 Statistical A n alysis... 93
3.7.4 Discussion 98
3.8 UPGRADE ON TEMPORAL ANALYSIS 100
3.8.1 M e th o d ... 101
3.8.3 Discussion
3.9 CONCLUSION
107 108
4 CONCLUDING REMARKS 110
A COMPARISON OF ID VS 3D HRV ANALYSIS RESULTS 114
B DEMONSTRATION OF THE NEW VENTRICULAR REPOLARIZATION
1.1 A typical heart beat with P, Q, R, S and T w a v e s ... 3
2.1 Typical behaviour of AIC and SNR curves with changing model order. Solid: Computed values. Dashed: Fitted exponential of the form ao x O i+ 09. 10 2.2 The flowchart of the QRS detection and ectopic beat identification algorithm 14
2.3 The frequency response of the numerical d ifferentiation... 15
2.4 Typical correct and incorrect identification cases of normal and ectopic b e a t s ...,... 23 2.5 Statistical comparison of Composite Signal and Composite Correlation
Coefficient Methods. (solid:CCC , d ash ed :C C )... 27
2.6 The normal beat in the third position was missed on VI but detected on
V5 during single channel HRV a n a ly s is ... 32
2.7 The SVE in the third position was missed on V4 but detected on VI
during single channel HRV a n a ly s is ... 32
2.8 The VE in the fourth position was missed on V5 but detected on VI
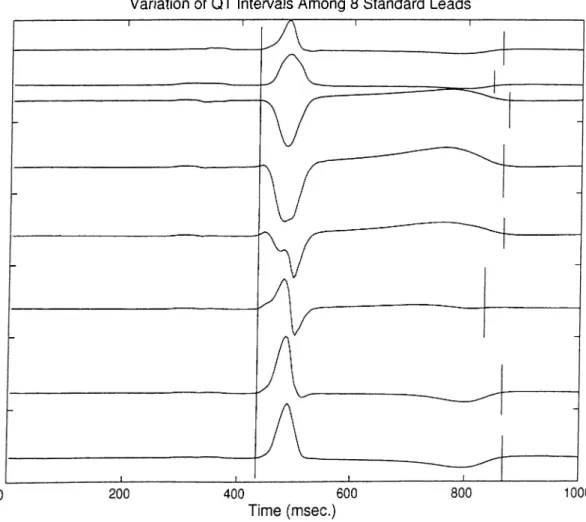
3.1 QT interval starts from the beginning of Q wave and ends at the end of T w a v e ... 3g 3.2 QT dispersion (QTd) is defined in the variation of the QT intervals over
12 standard EGG le a d s ... 38
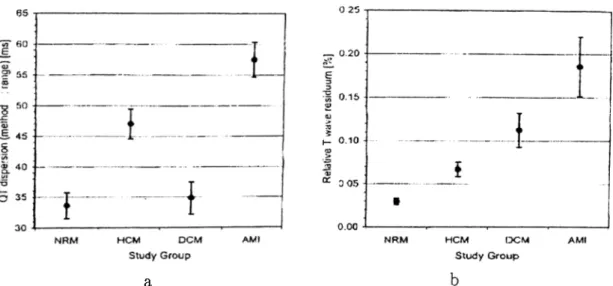
3.3 a)Mean QTd measurements for different groups b) Mean non-dipolar power ratio for different groups 43 3.4 Scatter graph of non-dipolar power ration vs QTd in different patient groups 43 3.5 The flowchart of the T wave analysis algorithm 55 3.6 Input and decomposed EGG sig n a ls... 56
3.7 The approximate QRS complex and T wave detection p o i n ts ... 58
3.8 a)T loop in Ui\i2-plane b) Ordered cell indices ( A ) ... 59
3.9 Decomposed T w a v es... 61
3.10 TM D : Reconstruction vectors of a normal and a HGM case 63 3.11 T C R T : QRS and T loops of a normal and a HGM c a s e ... 64
3.12 The T loop on the plane spanned by and e x p ... 65
3.13 Short-term reproducibility of conventional and new descriptors. Each col umn shows the mean value + the standard deviation. Grey: Normal, Black: H G M ... 72
3.14 Univariate ROG curves of conventional and new descriptors... 77
3.15 Bi-variate (selected by the multiple regression analysis of the a priori clas sification results of the descriptors) ROG curves. The numbers in brackets in the legend indicate the minimum number of positive (abnormal) pre dictions for final positive d e c is io n ... 80
ori classification results of the descriptors)ROC curves. The numbers in brackets in the legend indicate the minimum number of positive (abnor
mal) predictions for final positive decision 82
3.17 Bi-variable (selected by the multiple regression analysis of the measured values of the descriptors) ROC curves. The numbers in brackets in the legend indicate the minimum number of positive (abnormal) predictions for final positive d ecisio n ... 82 3.18 Four-variable (selected by the multiple regression analysis of the measured
values of the descriptors) ROC curves. The numbers in brackets in the legend indicate the minimum number of positive (abnormal) predictions for final positive d ecisio n ... 83 3.19 Kaplan-Meier survival curves of two groups separated with respect to
T C R T values in the AMI g r o u p ... 97 3.20 Kaplan-Meier survival curves of two groups separated with respect to LDi
values in the AMI g r o u p ... 98 3.21 Univariate ROC curves of the upgraded new descriptors...104
2.1 Detection - Identification results of the algorithm using V5, VI and II over a set of 69 5-minute EGG recordings. SVEs and VEs were not dis
tinguished at the output of the program 24
2.2 The effect of using the derivative signals on the performance of the algorithm 28 2.3 Statistical comparison of QRS detection and ectopic beat identification
from single channels and trip le ts... 30
2.4 Statistical comparison of HRV spectral parameters calculated using single
precordial leads and the triplet (II-V1-V5) 31
3.1 Pearson Product-Moment correlation coefficients between the new descrip
tors, the old descriptors and the age of the subjects... 70
3.2 P-values computed by non-parametric Wilcoxon Paired Test, showing the significance of the difference between the reproducibilities of the new and the conventional descriptors in normal and HCM groups, in supine position 73 3.3 Normal ranges of all descriptors calculated over 1100 normal EGG recordings 74 3.4 Normal values of % used in T M D calculations, calculated using 1100
ECGs of normal s u b je c ts ... 75
normal and HCM s u b je c ts ... 77 3.6 P-values at different levels of multivariate regression analysis of a priori
classification of normal and HCM groups with respect to the mean values of the d e sc rip to rs... 80 3.7 P-values of conventional and new descriptors at different levels of mul
tivariate regression analysis performed using the measured values of the descriptors... 81 3.8 Discrimination between normal and HCM subjects using the ECGs recorded
in standing p o sitio n ... 84 3.9 Short-term reproducibility of the conventional and new descriptors in
standing position assessed via the ratio of individual range to the total range of measured values. 10 consecutive measurements from each subject are used... 85 3.10 P-values computed by non-parametric VVilcoxon Paired Test, showing the
significance of the difference between the reproducibilities of the new and the conventional descriptors in normal and HCM groups, in standing po sition ... 86
3.11 The average values of the new T wave descriptors in DCM subjects 87
3.12 T wave descriptors in patients with and without primary endpoints during
follow-up... 95
3.13 T wave descriptors in patients with and without secondary endpoints dur
and T wave morphology descriptors were included initially and in which
the goal was to predict the primary endpoints 99
3.15 The final p-values of the surviving descriptors in a backward stepwdse Cox regression analysis, into which all univariately predictive clinical, Plolter and T wave morphology descriptors were included initially and in which
the goal was to predict the secondary e n d p o in ts ... 99
3.16 Normal ranges of PL.new , PO.new and LD2~new and the correspondence
between the two v ersio n s...102 3.17 Short-term reproducibility of PL.new, PO.new and LDo.new in 10 con
secutive recordings from normal and HCM subjects 102
3.18 Correspondence between the conventional ventricular repolarization de scriptors and P L.new , PO.new and L D ^ -n e w ... 103
3.19 Univariate comparison of PL.new, PO .new and LD2.new on the basis of
discriminating normal and HCM su b je cts...104 3.20 P-values of conventional and new descriptors at different levels of multi
variate regression analysis (performed on the a priori classification results)
with P L.new , PO .new and LD2.n e w ...105
3.21 P-values of com^entional and upgraded descriptors at different levels of multivariate regression analysis performed using the measured values of
the descriptors 106
3.22 Mean values and standard deviations of the upgraded PL.new , PO.new
INTRODUCTION
Electrocardiogram (EGG) signals are the recorded potential differences on the surface of the body due to the electrical currents on the heart itself. The invention of EGG cannot be attributed to a single person, although most of the credit goes to Willem Einthoven, a Dutch physiologist, who won the 1924 Nobel Prize for the invention of EGG.
Here is a short account of the development of EGG:
1842: Italian physicist Garlo Matteucci showed that an electric current accompanied each heart beat [1].
1878: British physiologists .John Burden Sanderson and Frederick Page recorded the heart’s electrical current with a capillary electrometer and showed that it consisted of two phases (later called the QRS complex and the T wave, which correspond to ventricular depolarization and repolarization respectively) [2].
1887: British physiologist Augustus D. Waller of St Mary’s Medical School, London pub lished the first human electrocardiogram [3].
1901; Einthoven modified a string galvanometer for producing electrocardiograms. His string galvanometer weighed 600 pounds (approximately 270kg) [5].
1902: Einthoven published the first electrocardiogram recorded on a string galvanometer
[6].
1906; Einthoven published the first organized presentation of normal and abnormal elec trocardiograms recorded with a string galvanometer. Left and right ventricular hypertrophy, left and right atrial hypertrophy, the U wave (for the first time), notching of the QRS, ventricular premature beats, ventricular bigeminy, atrial flutter and complete heart block were all described [7,8].
1920: Hubert Mann of the Cardiographic Laboratory, Mount Sinai Hospital, described the derivation of a ’monocardiogram’ later to be called the ’vectorcardiogram’ [9]. 1942: Emanuel Goldberger added the augmented limb leads aVR, aVL and aVT to the
Einthoven’s three limb leads (I, II, III) and the six chest leads (VI, ..., V6) making the 12-lead electrocardiogram that is used today.
Figure 1.1 shows a typical heart beat recorded from surface EGG leads. The five deflections correspond to different phases of the heart beat: The P wave is for atrial depolarization, the QRS complex is for ventricular depolarization and the T wave is for ventricular repolarization. A great deal of information is obtained by studying these waves, namely their duration, amplitude and morphology. The dynamism of these qual ities are also being studied, such as the time variation of the inter-beat durations, the T wave amplitude, variation, etc. Although EGG has been being studied for over a century, it still proves to be interesting in terms of research as its new properties are being discovered.
analysis and the Ventricular Repolarization (T Wave) Analysis. HRV analysis deals with the beat-to-beat changes in the inter-beat durations and the T wave analysis studies the properties of the T wave. The questions addressed can be stated as follows: (i) Is fully automatic short-term HRV analysis feasible? (ii) Can the spatial/tem poral variation of the T wave morphology and the wavefront direction characteristics during ventricular repolarization be indicators of ventricular repolarization heterogeneity? Do they have any clinical significance?
This thesis is organized in two parts:
The first part is devoted to HRV analysis. This part starts with some background information on HRV analysis, followed by the definition of the problem. The method and its implementation is explained in detail. The following section is about the experiments conducted. This section starts with the introduction of the data set used, the statistical analysis methods and concludes with the results. A discussion of several aspects of the method is given in the next section. A second version of the method, the associated experiments and their results, together with a discussion is given in the following section. Finally, a conclusion on this part is provided.
and the alternative methods. The problem and our approach is explained in the following section. The method and its implementation are explained in next sections. The analysis section starts with an introduction of the data set used, a comparison of the conventional and new methods is also provided with the reproducibility of the new parameters. The performance of the new methods in discriminating normal and abnormal ECGs is also assessed via statistical methods and reported in this section. The following section provides a discussion of the results, the relation between the conventional and the new methods and the limitations of the new methods. The next section reports a 2-way blind study performed on a group of AMI (Acute Myocardial Infarction) patients. An attem pt to solve some technical problems in some of the new methods is reported in a separate section. This part ends with a conclusion.
The thesis ends with some concluding remarks on the future of ECG analysis in conjunction with the analysis methods proposed in this thesis.
HEART RATE VARIABILITY
ANALYSIS
2.1
BACKGROUND
Autonomic Nervous System (ANS) is the feedback control mechanism of our body. It takes several inputs like blood pressure, body temperature and outputs stimuli to keep them at desired ranges. ANS is composed of two sub-systems: Sympathetic and Parasympathetic Nervous Systems. The sympathetic system is associated with stress responses whereas the parasympathetic system is associated with non-stress responses. The effects of the parasympathetic are generally to counteract the effects of the sympa thetic. For example, the sympathetic system increases the heart rate and the contraction force while the parasympathetic system slows down the heart rate. The two systems op erate as a pair, striking a nearly perfect balance when the body is functioning properly. A significant relation between the ANS and the cardiovascular mortality was noticed in the second half of the 1970’s [10]. Increased experimental evidence for an association between lethal cardiac arrhythmia and increased sympathetic activity led researchers to
On the other hand, clinical significance of HRV was first appreciated in 1965 [11]. They noticed alterations in the inter-beat intervals before any significant change in the heart rate itself. Wolf et al. showed the association between reduced HRV and increased risk of post-infarction mortality [12]. The spectral analysis methods, used today with the time domain parameters, were introduced in 1981 to study the heart rate fluctuations quantitatively [1-3]. In the late 1980’s, HRV was confirmed to be a strong and independent predictor of mortality following acute myocardial infarction [14-16].
The need for a standardization of HRV analysis methods led The European Society of Cardiology and The North American Society of Pacing and Electrophysiology to form a task force. The various HRV parameters and their interpretation can be found in their report [17].
HRV is the oscillation in the inter-beat intervals as well as the oscillations between consecutive instantaneous heart rates. It should be noted that HRV does not assess the changes in the heart rate per second but rather the changes in consecutive time intervals, i.e. it is the analysis of a time series.
The HRV measurements can be grouped in two: The time domain measurements and the frequency domain measurements.
Time Domain Measurements:
A time series of consecutive time intervals between two consecutive normal heart beats (Norrnal-tO-Normal -NN- interval) is formed. This is called the tachogram or the NN- series in general. The following measures are calculated in time domain:
* Mean NN: Average of normal-to-normal heart beat intervals.
* Mean Heart Rate: Average of the reciprocal of normal-to-normal heart beat inter vals.
the night.
* SD N N The standard deviation of the NN intervals. SDNN reflects the power of all of the periodic components responsible for variability. However, its value depends on the length of the ECG record, so care must be paid while comparing two SDNN measurements.
* SD A N N The standard deviation of the average NN intervals calculated over short periods (5 minutes), over 24 hours. It assesses the heart rate changes in periods longer than 5 minutes.
* SDNN Index: The mean of the 5 minute standard deviations of NN intervals calculated over 24 hours. It assesses the heart rate changes in periods shorter than 5 minutes.
* RMSSD: The square root of the mean squared differences of successive NN inter vals. This is an estimate of the short-term changes, like SDNN index.
* NN50: The number of interval differences of successive NN intervals greater than 50ms.
* pNN50: The percentage of NN50 over the total number of NN intervals.
* HRV Triangular Index: It is equal to the integral of the NN intervals’ density distribution (i.e., total number of NN intervals in the tachogram) divided by the maximum of the density distribution (i.e., the number of the most common NN interval). This is also an estimate of the overall HRV, as SDNN is.
* TINN: The Triangular Interpolation of the NN interval histogram is the baseline width of the NN interval distribution measured by using a triangle that approxi mates the shape of this distribution.
* Logarithmic Index: It is the coefficient </? of the exponential curve which best fits to the histogram of absolute differences between consecutive NN intervals.
SDNN, HRV Triangular Index, SDANN and RMSSD are recommended by the Task Force.
Frequency Domain Measurements:
The following measures can be calculated from the tachogram in the frequency domain:
Short-term (5 minute) analysis:
* 5 Minute Total Power. The variance of the NN intervals in a window of 5 minutes.
* VLF: Power in the very low frequency range (f< O.OiHz).
* LF: Power in the low frequency range (0.04ii2 < / < tl.loHz).
* LFnorm: Percentage of LF over the total power.
* HF: Power in the high frequency range [t).loHz < f < 0.411 z). * HFnorm: Percentage of HF over the total power.
* LF/HF: Ratio of LF to HF. 24 hour analysis:
* Total Power. The variance of all of the NN intervals in a 24 hour period. * ULF: Power in the ultra low frequency range (f< O.OOSii^).
* VLF: Power in the very low frequency range {0.003Hz < / < 0.04Hz). * LF: Power in the low frequency range {0.04Hz < f < 0.15Hz).
The LF is associated with the parasympathetic activity while the HF is said to be associated with both sympathetic and parasympathetic activities of the ANS. There is a continuing debate on the meaning of HF components. Thus, the level of autonomic modulations can be easily a.ssessed via HRV analysis. .A.11 of the frequency domain parameters, except the ULF and VLF related ones, are widely used. The meaning of ULF and VLF components are still to be determined.
There are two approaches for the Power Spectral Density (PSD) estimation of a given tachogram [18]:
(i) Parametric: An auto-regressive (AR) model is assumed for the underlying process th at creates the tachogram. The Z-transform of the transfer function of the model is defined as:
H{z) = 1 (2.1)
ao a\Z ^ . - r a n Z "
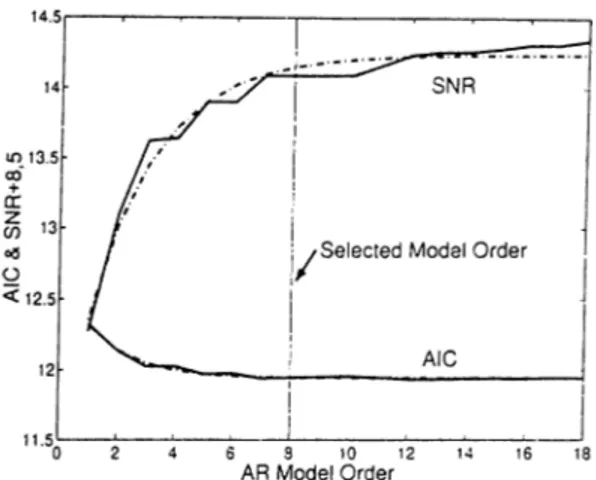
where the model order is assumed to be n. The model coefficients (ci) are de termined by solving the Yule-Walker equations using the Levinson Recursion [19]. The problem with AR modeling is the selection of the model order, n. A com mon approach is to use the Signal-to-Noise Ratio (SNR) and Akaike Information Criteria (AIC) curves versus model order. AIC measures the residual variance, as the model fits to the data better and better, AIC decreases [20]. Figure 2.1 shows the typical behaviour of SNR and AIC curves. The model order where both of the curves become flat is selected as the true model order. It is 8 in this example. (ii) N on-parametric: The non-parametric approach uses the Discrete Fourier Transform
Figure 2.1: Typical behaviour of AIC and SNR curves with changing model order. Solid: Computed values. Dashed: Fitted exponential of the form aQ x a\ + ao.
The advantage of FFT is that the algorithm is simple, there is no problem like model order determination and the processing time is low. However, the precision of PSD depends on the length of the tachogram due to the time-frequency resolution trade-off. The advantage of the parametric method is that a smoother PSD is obtained which helps to distinguish different spectral components, the post-processing of different spectral components is easy and an accurate estimation of PSD is possible even with a short tachogram. Thus the stationarity problem is overcome since we can assume that the tachogram is stationary in a short time interval. Its basic disadvantage, as stated above, is the problems in choosing the model order.
A good approach is to perform both of the analyses and then check whether they agree, which provides a sort of confidence measure.
Whatever the method applied is, the accuracy of the PSD depends on the qualities of the tachogram. The tachogram must be free of positive or negative spikes. Such spikes can mask the whole spectrum. A common source of such spikes are the ectopic
beats. An ectopic beat is a heart beat that is initiated from an abnormal region of the
heart, not from the sinus node as in the normal case. The course of propagation of the depolarization/repolarization waves depends on the location of this stimulus. Such an
on the heart, on the atria or the ventricles. The morphology of the ectopic beats can be very different from the normal beats’ but not necessarily. The morphology difference also depends on the ectopic focus. The atrial ectopic beats look very much like normal beats except some subtle morphological differences in the P w'ave (which corresponds to the atrial depolarization). The ventricular ectopic beats, on the other hand, are usually very different from the normal beats because an ectopic focus on the ventricles changes the morphology of the QRS complex and the T wave which are high energy components of the ECG. Ectopic beats do not obey the normal rhythm of the heart {sinus rhythm). They come significantly earlier than a normal beat and a pause occurs after them. This causes a negative spike followed by a positive one in the tachogram.
The common method of eliminating such spikes is manual correction. A cardiologist checks the tachogram visually and goes over the ECG signal itself when he/she sees a spike in the tachogram [15,21,22]. Another approach is to check the tachogram itself and exclude the points which are above or below a preset threshold [23,24]. However this approach implies a limit on the possible range of HRV which is determined by the thresholds used [25]. This makes the analysis results questionable.
2.2
PROBLEM
HRV, having become an inseparable part of risk stratification and tests for assessing the condition of the cardiovascular system, is part of a longitudinal study on British civil servants which was initiated to investigate occupational and other social influences on health and disease, namely the Whitehall II Study [26].
The study population was composed of 6900 men and 3414 women aged 35-55 in the London offices of 20 civil service departments [27]. Since the population was very large, HRV analysis by manual supervision/correction was not feasible. A fully automatic and
reliable HRV system was required. The only obstacle before this was the fully automatic detection of ectopic beats. So our problem can be stated as; Is it possible to develop
a fully automatic QRS detection and ectopic beat identification system, with acceptable reliability and fast processing?
The new system must:
O be able to detect normal QRS complexes with high specificity,
O be able to identify ventricular and supra-ventricular (atrial) ectopic beats from the normal beats (the sinus rhythm beats),
O be fast, and
O require no manual supervision or post-processing.
2.3
METHOD
The most widely accepted method for QRS detection is the template matching method. The detection in this method depends on the cross-correlation between a representative QRS complex, the QRS template, and a QRS candidate.
The simple QRS template matching is inadequate in identifying the ectopic beats because supra-ventricular ectopic beats (SVE) and some of ventricular ectopic beats (VE) yield high cross-correlation coefficients with normal QRS complexes. This is because the atrio-ventricular conduction is not affected by a SVE and the corresponding QRS complexes have normal morphologies. This is one of the reasons why existing systems require manual correction. The QRS complexes of VEs, on the other hand, may have both very abnormal morphologies as well as morphologies close to normal. On the other hand, significant changes in the heart rate can also be caused by respiration. Hence stability of the heart rate on its own is not sufficient to identify ectopic beats.
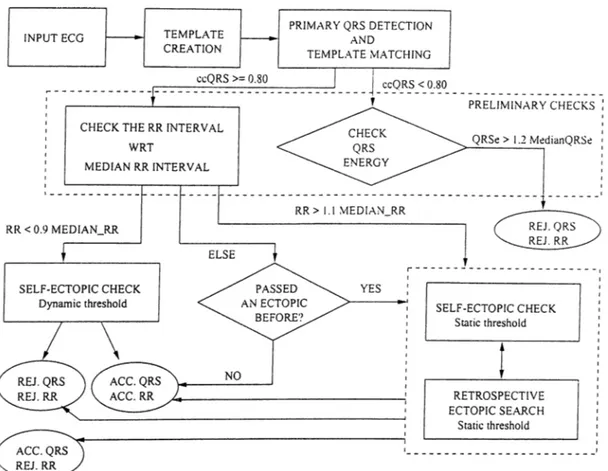
VI and II [28,29]. These three leads represent the widest range of QRS morphology due to their positions on the body. II represents the limb leads, VI represents the leads close to atria and V5 represents the leads close to ventricles. These signals will be called x. y and 2 in the rest of the text for the sake of simplicity. Our algorithm also makes use of the median RR intervals and the median beats. These terms correspond to the median value of the most recent nine NN intervals and the median heart rate of the most recent nine normal beats, respectively. Figure 2.2 shows the flowchart of the algorithm. The basic blocks are: i) Template Creation, ii) QRS Detection, iii) Preliminary Checks: Consists of median RR interval and QRS energy checks, and iv) Ectopic Beat Identification: Consists of QRS energy, specific QRS morphology and P wave morphology checks.
Our method is not for ECG diagnosis, but for automatic HRV analysis. All of the parameters were determined empirically with the aim of having a fully automatic and reliable HRV analysis.
2.3.1 Template Creation
A QRS template is a representative beat of the normal QRS morphology so that when a QRS candidate is met, it will be cross-correlated with this template. A composite signal of the three ECG signals is used for the initial detection of the QRS complexes before the template creation. It is defined as
composite sig n a l = dx dt + dy dt + dz dt (2.2)
where the numeric differentiation is performed as
dx
ccQRS : Correlation coefficient for QRS complex
MEDIAN_RR : Median value fo the most recent 9 normal-to-normal RR interval (NN interval). REJ.: Rejected
ACC: Accepted
QRSe : Total energy o f the QRS complex in 3 signals
MedianQRSe : Total energy o f the median QRS complexes o f 3 signals
Figure 2.2: The flowchart of the QRS detection and ectopic beat identification algorithm
where A n = 1 /fs, fs = I K H z (the sampling frequency). This corresponds to a band pass filter with centre frequency at 25Hz and a zero at 50Hz, which is convenient for 50Hz noise suppression (See Figure 2.3). If precise physiological measurements were required, which is not the case when detecting QRS complexes for HRV analysis, a linear phase, symmetric FIR filter should be used. If real time processing were required, a casual FIR filter would be needed. However, in this study, the choice of coefficients was arbitrary, with the zero at 50Hz being the only constraint. This does not impose any limitation on the method itself because all of the proce.ssing including template creation, is performed using the filtered (absolute derivative) signal. This choice of composite signal provides
Frequency (Hz)
Figure 2.3; The frequency response of the numerical differentiation
a built-in immunity to baseline wander and DC.
The preliminary QRS detection is based on comparing the individual absolute deriva tive ECG signals with a threshold. The thresholds for each of the three signals are set to be the 70% of the maximum of the corresponding absolute derivative signal. These thresholds are saved to be used in the rest of the data for preliminary QRS detection. A 130ms window starting from 40ms before the fiducial point (the threshold crossing point) is assumed to contain the QRS complex. For each QRS candidate, the maximum correlation coefficient with each one of the other candidates is searched for by sliding it around each one of the other candidates. The algorithm selects a set of at least nine beats among which the cross-correlation coefiicients are higher than 0.98. The final fidu cial points are set according to the relative positions of the QRS candidates when the highest correlation coefficients are achieved. The composite QRS template is calculated by taking the median of these beats at each time instant.
Also, three individual QRS templates are calculated as the medians of the above selected beats’ first order derivatives. These medians of the derivatives of the beats (not the absolute values of the derivatives, unlike the previous case) will be used in a second approach to the QRS detection, which will also be explained in Section 2.3.2 and
discussed in Section 2.6.2.
2.3.2 Q RS Detection
The QRS detection is similar to the template creation. A candidate beat is detected by comparing the three absolute derivative signals with the corresponding thresholds. The final decision is given by correlating this candidate with the template. As mentioned above, two approaches were implemented for this purpose.
In the first case, the composite QRS candidate, which is computed as defined above, is cross-correlated with the composite QRS template. If the cross-correlation coefficient (cc) is higher than 0.80, the QRS candidate is accepted. Otherwise, the candidate is rejected, however the question whether it is an ectopic beat or noise still remains to be answered in the next step, during the preliminary checks. This is important because we are trying to find the inter-beat intervals between two consecutive normal beats (the XX intervals). The existence of an ectopic beat invalidates two RR intervals, just before and after the ectopic beat.
In the second case, we do not use the composite signal but the derivatives of the three EGG signals themselves and the three separate QRS templates, together with a composite correlation coefficient. This approach will be discussed in Section 2.6.2.
The algorithm assumes a minimum 200 ms. interval between consecutive QRS com plexes.
2.3.3 Preliminary Checks
Some checks are applied to the detected QRS candidate, irrespective of the result of template matching. If the template was matched then these checks are aimed to find out whether the ectopic beat identification should be done or not. Otherwise, these checks
recent RR interval with the median RR interval. A difference of more than 10% activates the ectopic beat identification. Otherwise, the flag which marks whether the last detected beat was an ectopic or not, is checked. If it is, then the current QRS candidate is accepted but the RR interval is rejected, otherwise both the beat and the RR interval are accepted.
In the latter case, the total energy of the QRS candidates in three leads {QRSe) is compared with the total energy of the medians of the most recent nine normal QRS complexes in the corresponding leads (M edianQRSe). This is performed to avoid miss ing any VE that may have a very abnormal QRS complex morphology that results in a low cc. If Q RSe > 1.2 x M edianQRSe then the QRS candidate is assumed to be an ectopic beat and both the beat and the RR interval are rejected. Otherwise nothing is done. Note that all QRS complexes, both normal and ectopic, have to be detected and classified correctly to obtain a discrete HR signal free from the influence of ectopic beats.
2.3.4 Ectopic Beat Identification
There are two blocks in Figure 2.2 responsible for the ectopic beat identification. They are necessarily the same blocks except two points.
One of them involves a ’retrospective ectopic search’. This block tries to find out whether an ectopic beat was missed by some reason (for example due to the assumed 200ms. inter-beat interval) since the last detection of a normal beat. A preliminary QRS detection is performed as explained above. If this fails then a preliminary QRS detection based on energy is performed. A QRS candidate is marked if the energy of a QRS template long data window exceed the 70% of the energy of QRS template. The rest of this block is identical to the other ectopic beat identification block and is named ’self ectopic check’.
The second difference between them is that the block which is activated if the RR interval is short, uses a dynamic threshold for the P wave check, while the other one uses a fixed threshold.
There are 3 analyses performed in this block; i) The energy check, ii) The specific morphology check, iii) The P wave check. Each one evaluates the QRS candidates separately. All of the checks in all leads are required to predict a normal beat for the final decision of a normal beat.
In the energy check, the energy of the PQRS of the candidate beat is compared with the PQRS energy of the median beat. If the former is more than 140% of the latter, in any one of the channels, then the beat is assumed to be an ectopic beat. This check is aimed to identify VEs that might have been missed by the template matching.
A specific QRS morphology is checked in the next step. This QRS morphology consists of either two steep edges and a plateau in between or three steep edges and two plateaus at different levels in between these. The absolute derivative signals are used. The algorithm sets a threshold at 30% of the maximum of the absolute derivative signal. The sections above the threshold mark the steep edges and the ones below mark the plateau. If the number and position of them match any one of the two specific morphologies then the duration of the steep edges are compared with that of the plateau. The duration of the plateau must be longer than three times the duration of steep edges in all cases. If this is also true, then the QRS candidate is assumed to be an ectopic beat.
The P wave check is performed especially to identify the supra-ventricular (SVE) ectopic beats. As you may remember, the SVEs originate somewhere from the atria, so their QRS morphologies are usually normal. The only morphological difference, although minor, occurs in the P wave, which corresponds to the depolarization of the atria. This part of the algorithm is aimed to identify such minor changes. The P waves in three leads are cross-correlated with the corresponding median P waves and a threshold is applied
interval (It is less probable to have an ectopic beat after a long RR interval, although it is possible.). In the case of short RR interval, the threshold varies with the percentage change in the RR interval according to the following formula:
P -w avexorrelationJhreshold — - x {A R R - 0.1) + 0.4
O ;2.4)
This formula is determined empirically and depends on the fact that as the RR interval gets shorter, the probability of the existence of an ectopic beat increases. The other thresholds used were also determined empirically.
2.4
IMPLEMENTATION
The algorithm is implemented using Borland C + + 4.52 on a Pentium 133 MHz based PC with 80Mbyte RAM. The input ECG signals were recorded with a commercially available Kardiosis^^ standard 12-lead ECG machine. The signals were recorded from standard 12 leads at lOOOHz with 12 bit accuracy. The program generated a text file with the time indices corresponding to the mid-points of accepted RR intervals and the length of the corresponding RR intervals. A second output file was also generated with the time indices of the accepted QRS complexes. All measurements were in milliseconds.
2.5
EXPERIMENTS
2.5.1 Data Set
Each ECG recording covered a 5 minute period. The ECGs were recorded from a group of 69 non-industrial civil servants, aged 45-68, who participated in the Whitehall II
Study. A team, headed by Dr. Harry Hemingway from the University College London. Department of Epidemiology and Public Health, acquired the 12 lead ECGs in supine position, after 5 minutes of rest.
These recordings were selected from among 420 ECG recordings for the evaluation of the algorithm. They included ECGs with VEs, SVEs, right branch bundle block, respiratory arrhythmia, SA-block (sino-atrial block), wide and high amplitude T waves, blocked atrial extra-systole and SVT (supra-ventricular tachycardia). Since HRV studies are generally conducted on resting ECGs with high SNR, we excluded the recordings with visibly high EMG (Electromyogram; Signals due to muscle activity) interference or 50 Hz noise. Since our study is aimed at the fully automatic HRV analysis based on supine ECG recordings, this exclusion was fully acceptable. We also excluded ECG data with left bundle branch block (LBBB), pacemaker migrations or ventricular bigeminy. LBBB causes very wide QRS complexes, whereas pacemakers cause spikes on P waves, both of which cause false rejections of the beats. In the case of ventricular bigeminy (rhythm which consists of consecutive normal and ectopic beats), the heart rate cannot be monitored precisely which makes the ectopic beat identification less reliable and HRV cannot be estimated anyway.
An expert cardiologist marked the VEs and SVEs by examining 8 of the standard 12 leads simultaneously, namely the leads I, II, VI, V2, V3, V4, Vo and V6.
2.5.2 Statistical Analysis
The evaluation of the algorithm was based on the comparison of the cardiologist’s ec topic beat identification and that of the algorithm. We used specificity and sensitivity measurements to evaluate the performance of the algorithm in discriminating the normal and the ectopic beats. The specificity and sensitivity were defined as follows [30];
Specificity V E -Sensitivity S V E .Sensitivity
num ber.of .correctly.classified.norm al.beats total.num ber.of .normal.beats
number .o f .correctly .id en tified .V E s total.num.ber .o f .V E s number .o f .correctly.identified.SV Es total.num ber.of .S V E s (2.5) (2^6) (2.7)
Although discriminating SVEs from VEs does not affect the overall performance of the algorithm, defining VE_Sensitivity and SVE.Sensitivity separately allowed to evalu ate individual phases of the algorithm independently.
The overall specificity and sensitivity measures were calculated considering the whole population. We term them the Overall Statistics. We also calculated the specificity and the sensitivities for each ECG separately (whenever possible) and averaged the results. These show the performance on the basis of individual ECGs and are termed the Averaged
Statistics.
Finally, the EGGs were classified into two groups, those with specificity higher than 0.95 and SVE and VE sensitivities higher than 0.90 are classified as the Correctly Di
agnosed ECGs while the rest as the Poorly Diagnosed ECGs. The ratio between the
number of correctly diagnosed ECG to the total number of ECG records is called the
Correct Diagnosis Ratio. This is a measure of the overall performance of the algorithm.
2.5.3 Results
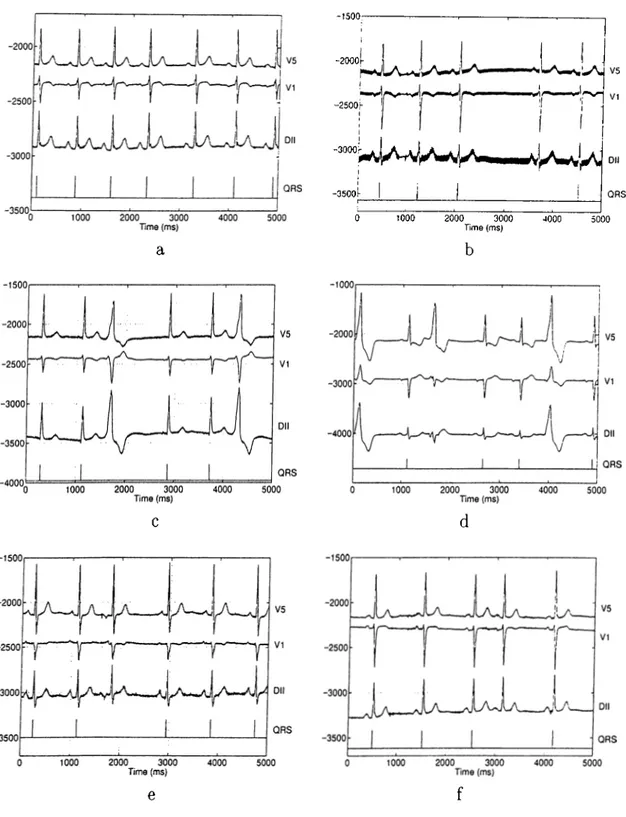
The algorithm was run on the above described data set using three of the twelve standard ECG leads, namely V5, VI and II. These channels represent the widest range of lead locations, as stated before. Figure 2.4 shows some typical cases. In Figure 2.4.a the normal beat in the fifth position was detected correctly even though there is a prolonged RR interval preceding it, which triggered the ectopic beat identification. In a similar
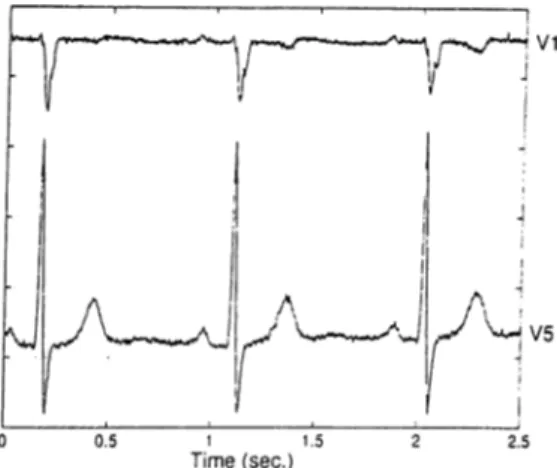
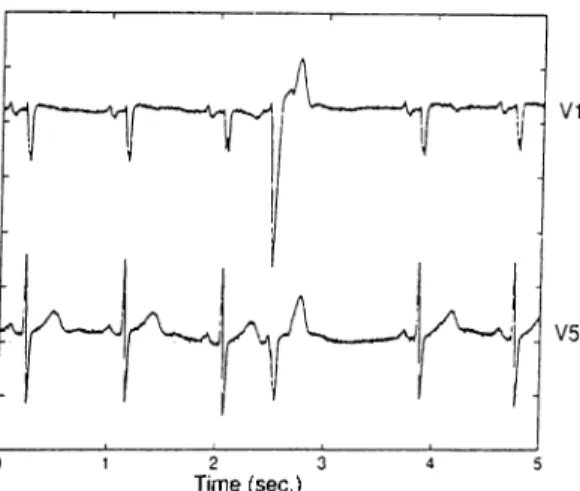
case in Figure 2.4.b the normal beat at the fourth position was missed due to high 50Hz noise. The ectopic beat identification was also triggered by the prolonged RR interval preceding this beat. The two VEs in positions three and six in Figure 2.4.c were identified correctly. The decision was given based on the low correlation between the QRS template and the QRS complexes of these beats. Similarly, three VEs in positions one, three and six in Figure 2.4.d were identified. Note that the second VE’s energy is very low in channels VI and II. Using three EGG leads simultaneously which record the signals from distinct positions enabled our algorithm to detect this VE correctly. The SVE in the third position in Figure 2.4.e was also detected correctly. Note that its QRS complex has normal morphology. Its identification was based on the morphological difference in its P wave, it is inverted. The morphological abnormality of the P wave can be very subtle also, as in Figure 2.4.f. In this case the SVE in the fourth position was also detected correctly. Using dynamic correlation threshold enabled our algorithm to identify it.
Table 2.1 summarizes the results. The columns represent the actual number of beats and the rows represent the output of the program. As presented, the errors are very low. There are no non-QRS events which was detected as a normal/abnormal beat.
The overall specificity of the method, across all of the beats in the population, is 0.990, the overall SVE_sensitivity is 0.990 and the overall VE_sensitivity is 0.978. The corresponding averaged statistics, are 0.990, 0.923 and 0.965 respectively.
The averaged statistics are slightly poorer than the overall statistics. This suggests that the misclassifications and the missed beats are concentrated in some EGG records, rather than distributed evenly among the population. This is really the case. 136 of a total of 231 normal beats that are misclassified as ectopic beats, are in 4 of the 69 EGG records. Likewise, 3 of the 7 unidentified VEs are in 2 of the 44 EGG records with VEs.
-1500 --2000 -2500i '-A J -3500^ Dll QRS 1000 2000 3000 4000 5000 Time (ms)
A c tu al N u m b e r O f B eats Normal VE SVE T3 0) Normal 23419 2 1 u 0) VE or SVE 231 318 89 01 Q Missed 9 5 0
Table 2.1; Detection - Identification results of the algorithm using V5, VT and II over a set of 69 5-minute ECG recordings. SVEs and VEs were not distinguished at the output of the program
2.6
DISCUSSION
2.6.1 Limitations
The dependence of the performance of the P-wave morphology analysis on noise and some artifacts like pacemaker migrations, is the major drawback of this method. Such interfering signals can mask the low energy P-wave and cause false rejection of the normal beats. However, the linearly varying threshold for the P wave morphology analysis overcomes this problem to some extent and increases the ectopic beat sensitivity, esp. the SVE sensitivity. It is based on the assumption that the earlier the beat arrives, the more probable it is an ectopic beat. However, a linear relation is not necessarily the best and further research is needed in this respect. Since the resting ECGs with high signal- to-noise ratio are generally used for HRV analysis, the noisy conditions do not impose a principal limitation on the automatic HRV analysis. Moreover, short term HRV analysis is most frequently based on supine resting ECG recordings in which low noise contents can be easily achieved, and patients with a pacemaker dependent rhythm should not be considered for a HRV assessment anyway. Thus this principle drawback of the method does not have serious practical implications.
that the 30% threshold applied is too low, or equivalently the 300% duration threshold is too high to detect the most common morphologies of this kind. Furthermore, such morphologies are likely to be detected by simple energy checks.
The performance of this method depends on the number and the choice of the ECG leads used. VVe used V5, VI and II in this study. A comparative study of the perfor mances with different lead sets will be provided in Section 2.7. It will provide information about the required number of leads and the most appropriate lead position(s) for a reli able HRV analysis.
Using the composite signal which is a combination of absolute derivative signals may degrade the performance of QRS detection also. This is because the correlation coeflficient of the QRS template and the composite beat will be rather high for a relatively wide range of misalignments around the correct alignment and it will decrease slowly with increasing misalignment. This is due to the loss of the information in the sign (+ /-) of the signal. This may result in errors in the detection of exact locations of the QRS complexes. Such an error, in turn, may introduce artificial fluctuations to the inter-beat intervals, thus an artificial heart rate variation. This is not likely to cause a major problem in this case because the data is of high SNR. Another approach, which uses the three derivative signals themselves will be explained and discussed in Section 2.6.2.
2.6.2 Using A Composite Correlation Coefficient
The main idea is to use the derivative signals themselves, not their absolute values, to make use of the sign information. However, the derivative signals can only be used on their own, not incorporated in a composite signal because they may annihilate each other when summed. Such a case would result in a total loss of information.
(low amplitude, low SNR) in one channel, then this signal may cause the rejection of a
beat due to a low correlation coefficient (cq). One solution to this problem would be
to use the un-normalized ccj’s but in this case the sum of cci's will not be limited but will depend on the energy of the corresponding signal. So applying a threshold would be impossible. Such a problem due to a weak signal is not present in the case of using the composite signal.
We defined a composite correlation coefficient (ccc) using the derivative signals them selves and separate QRS templates to overcome these problems, ccc is defined as
ccc = _______________ < Xt,Xj > + < Yu j/i > + < Zt, Zj >_______________
v < Xt, X t> < Xu Xi> + ^/< Yu y t> < Vi, Vi > + \/< Z t,Z t >< Zi,Zi >
(
2.
8)
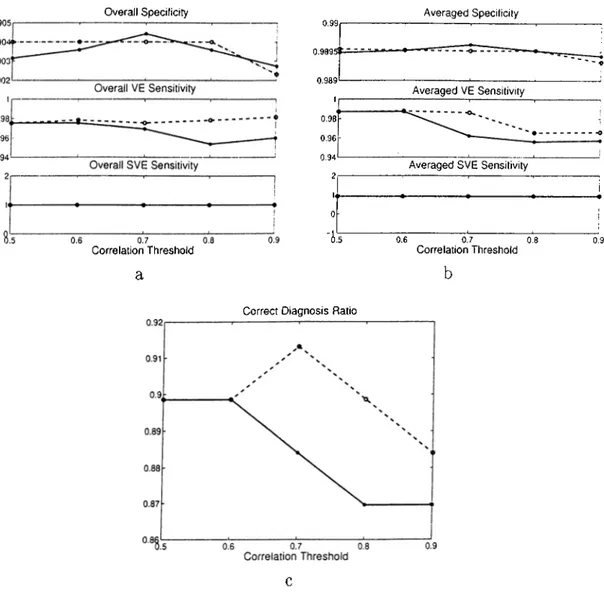
where X t, Yt, Zt stand for the corresponding QRS templates and Xi, ¡/.¿, Z{ stand for the candidate QRS complexes, ccc is in the range of -1 to 1. The contribution of each correlation to ccc is proportional to the energy of that signal. Thus if the correlation is high in a strong signal, then the low correlation of a weak signal will not decrease ccc much. Conversely, if the correlation is low in a strong signal, then a high correlation in a weak signal (which may be due to noise) will not increase ccc much.This approach was implemented and tested on the same set of data (see Section 2.5.1). The comparison of the two approaches was made based on the overall statistics, the averaged statistics and the correct diagnosis ratio (see Section 2.5.2 for the definitions). Five correlation thresholds were used with ccc. Figure 2.5 summarizes the results.
We see that in general there is a slight improvement in the specificity when ccc is used. However, this is not true for all threshold levels. This shows that although ccc improves the QRS detection of the algorithm, it performs poorer in some ECG records when the threshold is very low or high. The SVE sensitivity is not affected at all. They are same for both methods, for all threshold levels and in both of the statistics, cc on the other hand performs better than ccc in terms of VE sensitivity. Correct diagnosis
Correlation Threshold a 0.9895t ~ — 0.989 1 0.98 0.96 0.94 2 U 0
Correct Diagnosis Ratio
Averaged VE Sensitivity
Averaged SVE Sensitivity
0.6 0.7 0.8
Correlation Threshold
Figure 2.5: Statistical comparison of Composite Signal and Composite Correlation Co efficient Methods. (solid.-CCC , dashedrCC)
ratio is in favour of cc with a difference up to 3%. In all cases, the differences are small. These two methods can be assessed relative to each other better with a noisy data set, which would make their advantages and disadvantages clearer.
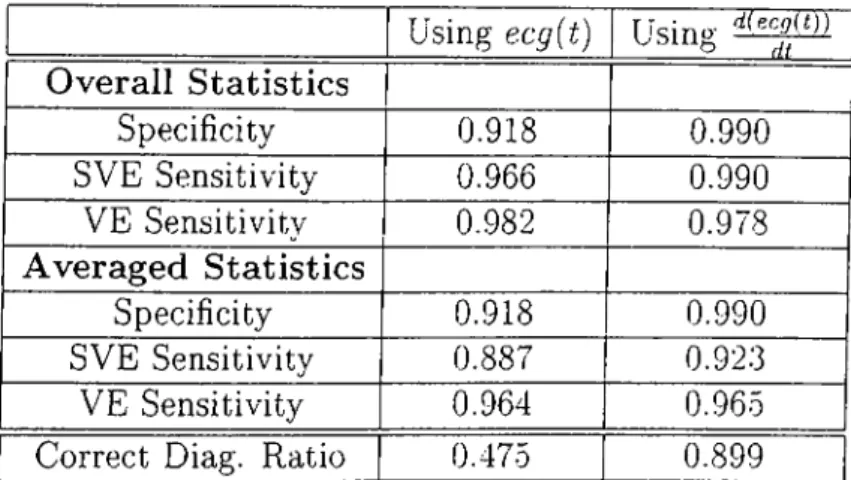
Using ecg[t) Using-Overall Statistics Specificity SVE Sensitivity VE Sensitivity Averaged Statistics Specificity SVE Sensitivity VE Sensitivity d{Kcg(l))' di__ 0.918 0.966 0.982 0.918 0.881 0.990 0.990 0.978 0.990 0.923 0.964 0.965
Correct Diag. Ratio 0.475 0.899
Table 2.2: The efTect of using the derivative signals on the performance of the algorithm
2.6.3 The Effect of Using The Derivatives
As explained before, the derivative of the ECG signals, either in absolute value or not, are used. This provides a built-in immunity to 50Hz noise and also removes the DC, providing a better signal for analysis.
We analyzed the same data set by using the ECG signals themselves, wherever their derivatives were used, to assess the role of derivation quantitatively. Nothing else was changed in the algorithm, the correlation threshold was left to be 0.80. 61 out of 69 ECG recordings could be processed because the program could not detect any QRS in a 20 second time interval in 8 of the recordings and excluded them. Table 2.2 provides a comparison of the two methods. Only the VE sensitivity seems not to have been affected by the using ECG signal itself instead of its derivative. This is somewhat misleading because we see a significant degradation in the performance in terms of specificity and SVE sensitivity, both of which basicly depend on the identification of normal QRS com plexes. On the other hand VE identification depends basicly on the largely abnormal QRS complexes. So, we can conclude that using the EGG signal itself makes the QRS detection significantly worse.
In an attem pt to investigate the feasibility of fully automatic HRV analysis using a single ECG lead in the proximity of the heart, we developed a single lead version of our QRS detection and ectopic beat identification algorithm. Essentially nothing is changed in the algorithm, except that all of the ectopic beat analysis is done on a single lead and the composite signal is defined to be equal to the absolute derivative of the ECG signal in hand:
composite-signal — dx
dt (2.9)
2.7.1 Experiments
The same data set (see Section 2.5.1) was used. The limb leads (I, II, III) were not used on their own because they are far away from the heart, so can not be used on their own for HRV analysis. The performance of the precordial leads (VI, V2, V3, V4, V5, V6) were compared with the performance of the original three dimensional (using three ECG leads simultaneously) algorithm on the basis of specificity and sensitivity measures defined in Section 2.5.2. Experiments were conducted with four different triplets, namely “II-V1-V5” , ’’V1-V3-V5”, “II-V3-V5”, “II-V1-V2” . Table 2.3 summarizes the results.
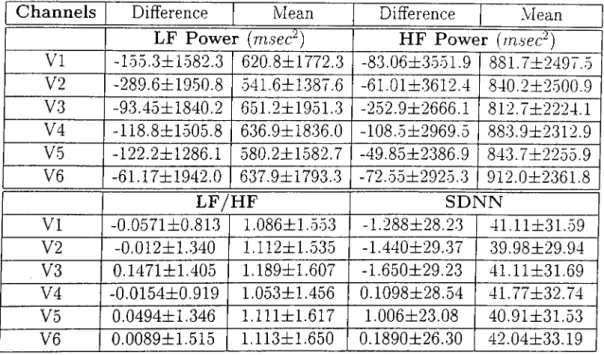
Then a second data set was used to compare the spectral parameters and the time domain parameters (LF power, HE power, LF/HF, SDNN), defined in Section 2.1, mea sured using a single lead and a triplet (II-V1-V5). This set of data consists of 5 minute supine rest ECGs recorded at St. George’s Hospital Medical School Cardiology Unit with a custom built 24-lead Kardiosis ECG machine (12 standard and 12 non-standard leads). The ECG signals were sampled at lOOOHz with 12-bit accuracy. They were recorded from 110 cardiac patients, 80 male, aged 64±13 years, range 24-87. Three separate recordings