Optimization of F2 Layer Parameters Using IRI-Plas
Model and IONOLAB Total Electron Content
Oktay SAHIN
Department of Avionics and Naval Systems Design Aselsan Inc. Microelectronics,Guidance and Electro-Optics
Division
Akyurt, Ankara 06750, Turkey [email protected]
Umut SEZEN, Feza ARIKAN
D
epartment of Electrical and Electronics Engineering. Hacettepe UniversityBeytepe, Ankara 06800, Turkey [email protected] [email protected]
Orhan ARIKAN
Department of Electrical and Electronics Engineering. Bilkent University
Bilkent, Ankara 06800, Turkey [email protected]
Bahadır AKTUG
General Command of Mapping Cebeci, Ankara, Turkey [email protected]
Abstract — In this study, the relation of the maximum ionization height (HmF2) and the critical frequency (FoF2) of F2 layer is examined within their parametric range through the International Reference Ionosphere extended towards the plasmasphere (IRI-Plas) model and the IONOLAB-TEC (Total Electron Content) observations. HmF2 and FoF2 are optimized using an iterational loop through Non-Linear Least Squares method by also using a physical relation constraint between these two parameters. Performance evaluation of optimization algorithm is performed separately for the cases running IRI-Plas with optimized parameters and TEC input; only with optimized parameters; only with TEC and finally with no optimized parameter and TEC input. As a conclusion, it is seen that using optimized parameters and TEC together as input produces best IRI-TEC estimates. But also using only optimized parameters (without TEC update) gives estimates with also very low RMS errors and is suitable to use in optimizations. HmF2 and FoF2 estimates are obtained separately for a quiet day, positively corrupted day, negatively corrupted day, a northern latitude and a southern latitude. HmF2 and FoF2 estimation results are compared with ionosonde data where available. This study enables the modification and update of empirical and deterministic IRI Model to include instantaneous variability of the ionosphere.
I. INTRODUCTION
Ionosphere is the layer of the atmosphere that lies between 60 km and 1000 km above Earth surface. Ionosphere has a great importance in high frequency (HF) and satellite communications because of its electrical and ionic structure. Its ionization characteristics and electron density vary according to the location on Earth, time, Sun, geomagnetic and seismic effects. Ionosphere consists of three distinct layers, namely, D, E and F. F layer can be divided into F1 and F2 layers. F2 layer, having the highest electron density, is the most stable layer for
HF communication and it has major importance in satellite communications [1]. Many experimental and theoretical models have been studied in order to obtain a realistic physical structure of ionosphere. The most significant and commonly used one of these models is International Reference Ionosphere (IRI) Model [2]. IRI is an international project sponsored by the Committee on Space Research (COSPAR) and the International Union of Radio Science (URSI). For a given location, time and date, IRI provides monthly averages of the electron density, electron temperature, ion temperature, and ion composition (www.iri.org). In a recent study, IRI model is extended to include plasmasphere (IRI-Plas) upto the height of 20,000 km corresponding to the height of GPS satellites [3]. In IRI-Plas, TEC estimates can be provided externally for scaling of topside and plasmasphere extensions. In this study, GPS-TEC is obtained as IONOLAB-GPS-TEC [4-5] and provided externally for scaling of F2 layer parameters. The goal of this study is to update IRI-Plas with IONOLAB-TEC in an iterative optimization loop by also including the physical correlations between IRI parameters formed by Non-Linear Least Squares method, and also to obtain more realistic IRI-Plas outputs for TEC and ionosphere electrical and ionic structure estimates by this way. In this study, IONOLAB TEC method is shortly defined in Section 2. IRI-Plas model is defined in Section 3 and optimization method for finding the F2 layer parameters is defined in Section 4.
II. TECESTIMATIONS USING IONOLAB METHOD IGS analysis centers can produce TEC estimations, but resolution of these estimates is low or they depend on observational data availability. In this study, GPS-TEC data is obtained from www.ionolab.org as IONOLAB-TEC [4-6]. IONOLAB-TEC combines data from all the GPS satellites
that are above 10o elevation angle (horizon limit) of the GPS
station with a temporal resolution of 30 seconds. The method calculates VTEC (Vertical Total Electron Content) per satellite and combines them using a weighting function based on satellite positions which reduces the contamination caused by multipath effects [5-6]. The receiver differential code bias are estimated using the method described in [4].
III. IRI-PLAS MODEL
IRI-Plas model is an ionospheric empirical model that can to be updated with different observational data sources [3]. In IRI-Plas, the region of interest can be extended to plasmasphere, i.e. 20,000 km. Ion and electron density distributions and TEC estimates along the local zenith axis can be obtained using this model. The model computations can be scaled by the input of external parameters such as GPS-TEC. Some of the model input parameters, such as sun spot number and geomagnetic coordinates are non-adaptive and kept constant in the data set. Some parameters are option selection flags such as FoF2 and TEC. Output parameters of the model are layer TEC estimates and related critical values. In this study, HmF2, FoF2 and TEC are investigated as input parameters. If we define parameter h as HmF2, f as critical frequency of the signal in layer and x vector as non-optimized parameters such as selected receiver latitude, longitude, date, time, daily sun spot number and Kp index (Sun spot number
and Kp index are database inputs independent of user entries),
model finds estimation vector ŷ as given:
yˆ =iriplas
(
h,f,x)
(1) An optional parameter of hourly TEC values (e.g. IONOLAB-TEC estimates) is also available in IRI-Plas model. In this case IRI-Plas model would be defined asyˆ=iriplas
(
h,f,x,y)
(2) and here y represents the hourly IONOLAB-TEC estimates.IV. DETERMINATION OF F2LAYER PARAMETERS During day light, all ionosphere layers appear but when ionization effect of Sun disappears at nights, only F2 layer remains in spite of its decreasing electron density profile. So F2 layer is needed to be carefully examined. Main two characterizing parameters of this layer is HmF2 (km) and FoF2 (MHz). Only electrical signals above a critical frequency level can traverse the ionosphere and propagate into outer space. Signals with lower frequencies are refracted and reflected. Therefore, FoF2 is very important in radio communication. IRI-Plas model, estimates critical frequency and height values by analyzing its preset coefficient matrices. If IRI-Plas is updated with GPS-TEC, more realistic HmF2 and FoF2 estimates can be obtained. The iterational
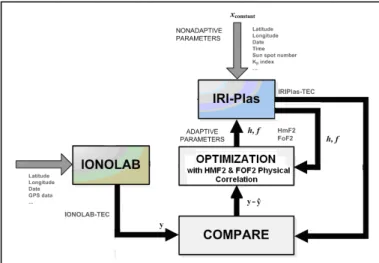
optimization loop model for minimizing the TEC error is provided in Figure 1.
Figure 1: IRI-Plas Iterative Optimization Model Defining error vector e as the difference of observational data set y and IRI-Plas TEC estimations ŷ for each hour of day,
e=y−yˆ (2)
and minimizing error norm ||e|| in an iterative loop leads us to optimized h and f parameters.
First of all, for a selected quite day (e.g. “ankr” IGS station and “15 Oct 2008”) IRI-Plas input parameter-set affecting TEC estimates are investigated in their defined parametric range. To do that, root-mean-square (RMS) error of daily TEC estimations which is the error of IRI-Plas TEC estimations and IONOLAB-TEC observations are calculated in 150-500 km parametric range of HmF2 with 10 km stepsize and 4-9 MHz parametric range of FoF2 with 0.1 MHz stepsize separately to see the single parameter variation effects on the TEC estimates. While dealing with TEC dependency to HmF2 single parameter, FoF2 is taken as a constant average value which is 6 MHz. Result is shown on Figure 2. It is seen that this characteristics is a parabolic curve.
Figure 2: Ankara 15 October 2008 quite day - HmF2 single parameter search for daily RMS TEC Estimation Errors
By the same way for FoF2 cost function analysis, HmF2 is taken as a constant average value which is 250 km. Result is shown on Figure 3. It is also a parabolic curve.
Figure 3: Ankara 15 October 2008 quite day - FoF2 single parameter search for daily RMS TEC Estimation Errors
So after having parabolic structures for single parameter sets, it is expected that a quadratic surface will be formed for double parameter search. As expected it is found to be a quadratic surface as given in Figure 4 below. Contour plot is given also in Figure 5.
Figure 4: Ankara 15 October 2008 quite day - HmF2-FoF2 double parameter search for daily RMS TEC Estimation Error (surface plot)
Figure 5: Ankara 15 October 2008 quite day - HmF2-FoF2 double parameter search for daily RMS TEC Estimation Error (contour plot)
After examining of TEC error characteristics curves and surface for a day, it is seen that there are no local minima, only a global minimum. So, selecting Non-Linear Least Squares method for optimizing HmF2 and FoF2 parameters, initializing the algorithm with HmF2 and FoF2 estimates obtained from IRI-Plas model (without using IONOLAB TEC) and running algorithm with IONOLAB TEC updates would lead us to a meaningful solution.
After choosing Non-Linear Least Squares method as optimization alghorithm, performance evaluation of IRI-Plas model is investigated for different input combinations:
• running IRI-Plas with optimized parameters and TEC input,
• running IRI-Plas only with optimized parameters (no TEC input),
• running IRI-Plas only with TEC input (no optimized parameter input),
• running IRI-Plas without optimized parameter and TEC inputs.
Results can be seen on Figure 6.
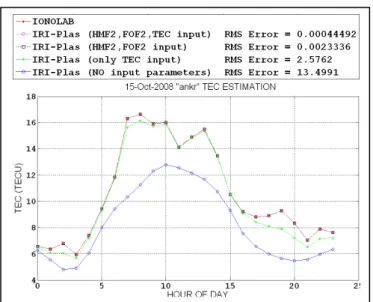
Figure 6: Ankara, 15 Oct 2008, quiet day daily TEC Estimation Performance Plot
It can easily be seen that using optimized parameters and TEC together has best TEC estimations performance and one-to-one matching with IONOLAB TEC observations. TEC estimation RMS error is found to be 0.0004 TECU in this case. But also using only optimized parameters (without TEC update) gives an estimate with a very low RMS error of 0.0023 TECU. Because optimization algorithm doesn’t use IONOLAB-TEC data as input to the IRI-Plas model during optimization and used only for error calculations inside the loop. So we can also get very good results with the case “no TEC, only with optimized parameters running”. Giving TEC only i.e. without the optimized parameters produces a significant RMS error of 2.5762 TECU, especially for
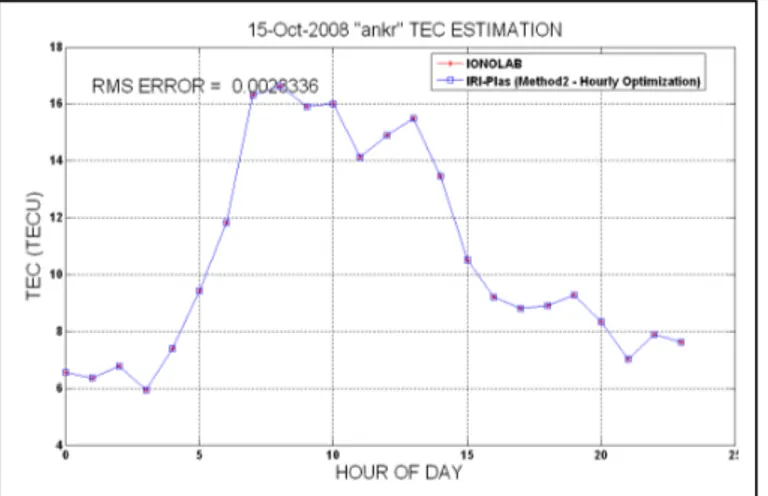
night-time as clearly can be seen on Figure 6. Using IRI Model without optimization parameter and TEC inputs is not a appropriate solution with an RMS error of 13.4991 TECU. From now on, IRI-Plas is run via using second input combination in this study. Giving optimized HmF2 and FoF2 as intern parameters to the model and using hourly obtained TEC data only in error calculations (i.e. and not giving to the model as extern parameter) lead us to a meaningful solution with acceptable errors. One to one matching of IRI-Plas TEC and IONOLAB TEC is given separately again in Figure 7 below.
Figure 7: Comparison of IONOLAB-TEC with modified IRI- Plas TEC estimate for Ankara, 15 Oct 2008.
The optimization algorithm is tried for the same latitudes as Turkey with closer ionosonde-receiver locations . Ionosonde AT138 located in Athens and noa1 (Athens) EUREF receiver are selected for comparison.. Comparison of HmF2 and FoF2 estimated parameters and ionosonde data for 15 Oct 2008, noa1 (Greece) EUREF receiver are given on Figure 8 below. Red lines are observational ionosonde data and blue ones are estimates.
Figure 8: Comparison of estimation with ionosonde data for noa1 - AT138 a) HmF2, b) FoF2
The HmF2 and FoF2 graphs matched well with the ionosonde data. Matching RMS errors of HmF2 and FoF2 are 30.08 km and 0.73 MHz, respectively. The error between the ionosonde data and modified IRI-Plas data are in very good agreement.
The optimization algorithm is tried for higher latitudes with closer ionosonde-IGS receiver locations. The results for wroc (Wroclaw) IGS receiver and nearest Juliusruh/Rugen (JR055) ionosonde are provided in Figure 9.
Figure 9: Comparison of estimation with ionosonde data for wroc - JR055 a) HmF2, b) FoF2
Again, red lines denote the ionosonde data and the blue ones are estimates. Rms Error is found as 23.74 km for HmF2 and 0.36 MHz for FoF2. It is observed that with closer IGS station-ionosonde pair, the estimates are in better agreement with the experimental data. In Figure 10, the comparison is provided for karr (Karratha) IGS receiver and Learmonth (LM42B) ionosonde. On Figure 10, red lines are ionosonde data and the blue ones are the estimates. Error norm is found as 13.69 km for HmF2 and 0.32 MHz for FoF2. An excellent agreement between the estimates and ionosonde data is obtained in this case also.
Figure 10: Comparison of estimation with ionosonde data for karr - LM42B a) HmF2, b) FoF2
V. CONCLUSION
IRI-Plas model is updated externally using IONOLAB-TEC estimates through an iterative optimization loop, and an updated HmF2 and FoF2 parameter set are obtained from the IRI-Plas model. These new set of FoF2 and HmF2 estimates obtained with the IRI-Plas model and IONOLAB-TEC estimates are compared with nearest ionosonde data set and it is observed that the FoF2 and HmF2 estimates were in excellent agreement with the ionosonde data. Estimation errors were higher for night hours.
From another perspective, these results also justify the reliability of the IRI-Plas model. This optimization method allow computation of the HmF2 and FoF2 parameters of the ionosphere F2 layer using the IRI-Plas model and GPS TEC estimations (or TEC measurements) where the ionosonde data are not available.
ACKNOWLEDGMENT
This study is supported by TUBITAK EEEAG Grant No: 109E055
REFERENCES
[1] M.O. Kolawole, Radar Systems, Peak Detection and Tracking, Oxford, UK: Newnes, 2002.
[2] D. Bilitza (ed.), International Reference Ionosphere 1990, NSSDC 90-22, Greenbelt, Maryland, 1990.
[3] T.L. Gulyaeva, “Storm time behavior of topside scale height inferred from the ionosphere-plasmasphere model driven by the F2 layer peak and GPS-TEC observations,” Advances in Space Research, doi: 10.1016/j.asr.2010.10.025, 2010.
[4] F. Arikan, H. Nayir, U. Sezen and O. Arikan, “Estimation of single station interfrequency receiver bias using GPS-TEC”, Radio Science , 43, RS4004, 2008, pp. 1-13.
[5] H. Nayir, F. Arikan, O. Arikan, and C. B. Erol, “Total Electron Content Estimation with Reg-Est”, J. Geophys. Res -Space Physics, 112(A11313), 2007, pp. 1-11.
[6] F. Arikan, U. Sezen, O. Arikan,, O. Ugurlu, H. Nayir, “SpaceWeather Activities of IONOLAB Group: IONOLAB-TEC”, Geophysical Research Abstracts, 11:EGU2009-5188, 2009.