Pergamon
Printed in Great Britain. All rights reserved 0360-5442/% $ I5.00 + 0.00
EMISSIONS DUE TO FOSSIL-FUEL CONSUMPTION AND CEMENT PRODUCTION IN TURKEY ( 1970-199 1)
KATALIN KOVARI ZAIM
Institute of Environmental Science, Bogazici University, Bebek-80815, Istanbul, Turkey (Received 3 November 1994)
Abstract--Standard emission factors are used for estimating levels of particulate matter (PM), SO,, CO, volatile organic compounds (VOC), NO, and CO*. Results are presented for different fuels and energy-consuming sectors. In the early 1970s households utilizing lignite made the most significant contributions to emissions, while manufacturing industries with both lignite and pet- roleum utilization were responsible for SO,, NO,, and PM emissions. Households continued to produce the same CO and VOC emissions and manufacturing industries continued to be responsible for NO, emissions through the 1970-1990 period. Power production had gained in importance with regard to SO,, COz. and PM emissions by 1990.
1. INTRODUCTION
Air pollution is a symptom of industrial growth in developed and developing countries alike.] Among the most critical compounds affecting the quality of our atmosphere are SO*, NO,, CO, 03, and COa. In the late 198Os, the international community responded to air pollution through environmental initiat- ives with the objective of establishing international emissions standards. The European community announced that emissions from large combustion plants ought to be reduced below the 1980 emissions level by 20% by the end of 1993, 40% by 1998 and 60% by 2003. Turkey is a developing country. There is very limited information available on annual pollutant emissions. In this study, we assess air- pollution indicators in Turkey for the period 1970-1991, using yearly fossil-fuel consumption as basis for the computations.
2. DATA AND METHODOLOGY
Fossil-fuel consumption data have been collected from yearly publications on energy statistics in Turkey.* The polluting sectors are households, manufacturing industry, power production, and transpor- tation. Fossil-fuel consumptions includes the use of coal, lignite, petroleum, and natural gas (NG). For estimations of air pollution, methods suggested by the U.S. EPA3 and Marland were applied. The EPA method yields concentrations of SO*, NO,, CO, particulate matter (PM), and volatile organic compounds (VOC) for fossil-fuels using standard emission factors.
The energy-consuming sectors of Turkey are identified in the manner of Tasdemiroglu.s Standard tables for uncontrolled emissions are chosen for computations of yearly emissions of SOz, NO,., CO, VOC, and PM for 1970-1991. Marland’s method4 was applied to calculate CO, emissions. Yearly CO* emissions (CO,i) are determined by the amount of fuel consumed (Pi), the fraction of fuel that is oxidized (FOi) and the carbon content of the fuel (C,), i.e.
C&i = (Pi) (FOi) (Ci), (1)
where the subscript i indicates a particular fuel group and COzi is the mass of carbon. All coal, NG or crude oil are not of the same composition and hence have different CO2 potentials. Results were obtained according to Marland’s method and are listed in Table 1.
The most significant contributors to CO2 emissions are fossil-fuel burning and cement manufacturing. Since cement production requires the use of both fossil-fuels and CaCO,, its CO* emissions are signifi- cant. According to Marland, for each mole of CaO produced from CaCO,, one mole of CO2 is emitted. Thus, in the production of one metric ton of cement, 0.137 mt of C is released into the atmosphere as CO*.
Table 1. Factors and units for calculating annual CO* emissions in I@ mt of C from Eq. (I).
NG consumprion (P,) = annual consumption (It 10%) of NG in Q ( 1015J), FO, = effective fraction oxidized in the year of consumption = 0.98 2 IQ, C, = carbon content in IO6 mt per 1O”J = 0.0137 -C 2%.
Petroleum ad NG con.wmption (P,) = annual consumption in IV mt (28%). FO, = effective fraction oxidized in the year of consumption = 0.918 -C 3%, C, = carbon content in mt C per mt crude oil = 0.85 -C I%.
Coal consumption (P,) = annual consumption in 106 mt coal equivalent (-C 11.2%). FOs = effective fraction oxidized in the year of consumption = 0.982 t 2%, Cs = carbon content in mt C per mt coal equivalent = 0.746 C 2%.
3. RESULTS AND DISCUSSION
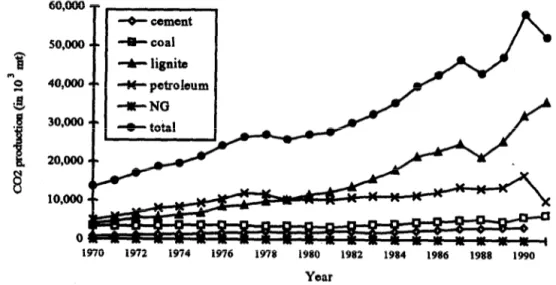
For each of the pollutants, the contribution made by fossil-fuel consumption has been computed (see Fig. 1). Prior to 1979, the major contributor to CO* was petroleum consumption; after 1980, lignite consumption became dominant. The importance of lignite as a major contributing factor in the pro- duction of SOz, PM, and CO may be observed in Figs. 2-5.
60,000
T
50.000 fa
40,ooo d .8 30,ooo B 20,ooo + cement -Q- coal + lignite 10,000 0 1970 1972 1974 1976 1978 1980 1982 1984 1986 1988 1990 YearFig. 1. Annual CO, production in Turkey from fossil-fuel burning (1970-1991).
6,000 5,000 + wood&waste 0 1970 1972 1974 1976 1978 1980 1982 1984 1986 1988 1990 Yoar
; 3,000 k 2,000 1,000 0 1970 1972 1974 1976 1978 1980 1982 1984 1986 1988 1990 Year
Fig. 3. Annual PM production in Turkey from fossil-fuel burning (197O-1991).
120 t’100 0 0 2 80 d 1 & 40 6o 8 $ 20 0 700 600 500 400 300 200 100 0 4- coal + lignite 4- petroleum
++
wood&waste *tots1 1970 1972 1974 1976 1978 1980 1982 1984 1986 1988 1990 YearFig. 4. Annual CO production in Turkey from fossil-fuel burning (1970-1991).
Jt wood&waste
1 1972 1974 1976 1978 1980 1982 1984 1986 1988 1990
I#00 800 600 400 200 0 -n-NO -Ill- wood&w&e 1970 1972 1974 1976 1978 MO 1982 1984 1986 1988 1990 YSar
Fig. 6. Annual NO, production in Turkey from fossil-fuel burning (1970-1991).
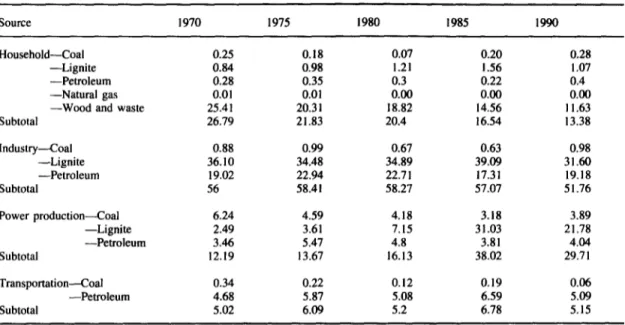
For NO, production, both lignite and petroleum consumption play important roles (see Fig. 6). SOz production for various sectors is summarized in Table 2 for various fossil-fuels, wood and waste in five-year intervals from 1970-1990. Similar tables are given for NO,, CO*, CO, VOC, and PM in Tables 3-7, respectively. These tables show which combination of sectors and fossil-fuel consumption is most detrimental for a specific air-pollution indicator. Furthermore, we see how the contributions change over time.
Industrial activities using lignite were responsible for 41% of emissions in 1970 for SO*. Their importance has decreased with time and reached a level of 21% in 1990. At the same time, power production using lignite as an energy source increased. In 1990, power production was responsible for 53% of SO1 emissions.
For NO, emissions, contributed 56% in 1970 and 51% in 1990. The decreasing importance of indus- trial activities for NO, emissions was more than offset by the increased importance of power production (see Table 3).
Household lignite consumption contributed 42% of CO* emissions 1970 and then decreased to 20% by 1990. Power production using lignite gained in importance and contributed 37.8% by 1990. Cement production was responsible for about 6% of CO1 emissions between 1970 and 1990.
Table 2. Sectoral shares of SO, emissions (in %); subtotals add to 100%.
Source 1970 1975 1980 1985 1990
Household--Coal 1.69 1.13 0.39 0.88 1.11
-Lignite 18.64 20.21 22.15 22.58 14.1
-Petroleum 2.80 3.3 2.52 1.46 2.38
-Wood & waste I .53 1.13 0.94 0.54 0.42
Subtotal 24.66 25.77 26 25.46 18.01 Industry-Coal I .05 1.10 0.66 0.49 0.70 -Lignite 40.23 36.24 32.79 28.99 21.38 -Petroleum 0.43 0.49 0.43 0.26 0.26 Subtotal 41.71 37.84 33.88 29.74 22.34 Power production-Coal 7.41 5.06 4.11 3.18 2.76 -Lignite 9.09 12.17 21.57 31.03 47.26 -Petroleum 4.53 6.64 5.22 3.81 3.16 Subtotal 21.84 23.87 30.9 38.02 53.18 Transportation-Coal 1.89 0.96 0.26 0.19 0.05 -Petroleum 9.9 11.56 8.96 6.59 6.42 Subtotal 11.79 12.52 9.22 6.78 6.47
Table 3. Sectoral shams of NO, emissions (in 96); subtotals add to 100%. Source 1970 1975 1980 1985 1990 Household-Coal 0.25 0.18 0.07 0.20 0.28 -Lignite 0.84 0.98 1.21 1.56 1.07 -Petroleum 0.28 0.35 0.3 0.22 0.4 -Natural gas 0.01 0.01 0.00 0.00 0.00
-Wood and waste 25.41 20.3 1 18.82 14.56 11.63
Subtotal 26.79 21.83 20.4 16.54 13.38 Industry-Coal 0.88 0.99 0.67 0.63 0.98 -Lignite 36.10 34.48 34.89 39.09 31.60 -Petroleum 19.02 22.94 22.71 17.31 19.18 Subtotal 56 58.41 58.27 57.07 51.76 Power production-Coal 6.24 4.59 4.18 3.18 3.89 -Lignite 2.49 3.61 7.15 31.03 21.78 -Petroleum 3.46 5.47 4.8 3.81 4.04 Subtotal 12.19 13.67 16.13 38.02 29.71 Transportation-Coal 0.34 0.22 0.12 0.19 0.06 -Petroleum 4.68 5.87 5.08 6.59 5.09 Subtotal 5.02 6.09 5.2 6.78 5.15
Table 4. Sectoral shares of CO2 emissions (in 46); subtotals add to 100%.
Source 1970 1975 1980 1985 1990 Cement production 6.36 6.93 6.49 6.05 5.72 Household-Coal 5.41 5.15 4.25 4.02 5.06 -Lignite 40.40 40.41 39.28 34.15 20.06 -Petroleum 4.70 4.74 5.42 4.14 5.4330.55 Subtotal 51.51 50.30 48.95 42.31 Industry-Coal 2.35 2.39 1.58 1.30 1.05 -Lignite 9.00 9.54 9.4 8.22 6.79 -Petroleum 8.51 8.51 9.09 7.00 6.13 Subtotal 19.86 20.44 20.07 16.52 13.97 Power production~oal 8.43 7.98 6.73 6.34 5.20 -Lignite 4.44 4.46 11.32 20.04 37.00 -Petroleum 3.77 4.29 3.09 3.04 3.04 Subtotal 16.64 16.73 21.14 29.42 45.24 Transportation-Coal 0.41 0.21 0.25 0.22 0.01 -Lignite 0.51 0.07 0.03 0.09 0.01 -Petroleum 4.7 1 5.32 3.31 5.29 4.5 Subtotal 4.71 5.60 3.63 5.70 4.52
CO emission is mostly related to household activities due to lignite burning which was responsible for about 80% of emissions in 1970 and 90% in 1990 (see Table 5). A similar situation applies for volatile organic compound (VOC) emissions. The household sector utilizing lignite and wood waste emitted 51.67% of the VOC in 1970 and 87.5% in 1990 (see Table 6).
Particulate matter (PM) emissions are summarized in Table 7. in 1970, power production and the manufacturing industry played significant roles with shares of 40 and 30%, respectively. Power pro- duction utilizing coal was responsible for 25% of emissions in 1970 and 8% in 1990. This reduction in PM emissions has been offset by the increased importance of lignite utilization in the same sector.
Table 5. Sectoral shares of CO emissions (in %); subtotals add to 100%. Source 1970 1975 1980 1985 1990 Household-Coal 18.03 12.39 4.52 4.82 11.28 -Lignite 62.72 69.81 79.85 79.44 69.33 -Petroleum 1.17 0.9 I 0.84 0.73 1.40 Subtotal 81.92 82.11 85.21 84.99 82.01 Industry-Coal 0.12 0.13 0.08 0.06 0.11 -Lignite 0.57 0.52 0.49 0.42 0.44 -Petroleum 3.44 2.53 2.74 2.45 2.9 Subtotal 4.13 3.18 3.31 2.93 3.45 Power production-Coal 0.84 -Lignite 1.46 -Petroleum 11.65 Subtotal 13.9s 0.59 2.87 0.50 0.20 10.78 11.48 0.37 1.22 0.45 2.69 11.4 14.54 11.25 14.71 10.5 12.08
Table 6. Sectoral shares of VOC emissions (in %); subtotals add to 100%.
Source 1970 197s 1980 1985 1990
Household-Coal 1.58 1.13 0.40 1.02 1.88
-Lignite 47.53 55.38 60.25 71.71 65.64
-Petroleum 0.63 0.80 0.63 0.41 0.98
-Wood and waste 44.14 35.13 29.17 20.59 21.88
Subtotal 93.88 92.44 90.45 93.73 90.38 IndustryAoal 0.08 0.09 0.06 0.05 0.10 -Lignite 0.63 0.6 0.55 0.56 0.60 -Petroleum 1.94 2.33 2.11 1.44 2.12 Subtotal 2.65 3.02 2.72 2.05 2.82 Power production-Coal 0.10 0.08 0.06 0.10 0.07 -Lignite 0.36 0.57 0.95 1.54 3.43 -Petroleum 0.65 0.94 0.76 0.62 0.76 Subtotal 1.11 1 .s9 4.49 2.26 4.26 Transportation-Petroleum 2.36 2.95 2.34 1.96 2.54
Table 7. Sectoral shares of PM emissions (in %); subtotals add to 100%.
Source 1970 1975 1980 1985 1990
Household-Coal 0.07 0.05 0.01 0.04 0.04
-Lignite 1.61 2.02 2.1 2.03 1.05
-Petroleum 0.06 0.08 0.06 0.03 0.04
-Wood and waste 18.98 16.25 12.78 7.40 4.48
Subtotal 20.72 18.40 14.95 9.50 5.61 Industry-Coal 3.59 4.32 2.49 I .75 2.06 -Lignite 27.29 27.91 24.00 20.12 12.33 -Petroleum 0.29 0.37 0.31 0.18 0.15 Subtotal 31.17 32.60 26.80 22.05 14.54 Power production~oal 25.14 19.83 15.34 11.23 8.10 -Lignite 15.86 24.55 41.35 56.4 71.40 -Petroleum 0.07 0.13 0.10 0.06 0.04 Subtotal 41.07 44.51 56.79 67.69 79.54 Transpottation-Coal 6.57 3.87 I .07 0.49 0.09 -Petroleum 0.47 0.62 0.39 0.27 0.22 Subtotal 7.04 4.49 1.46 0.76 0.31
REFERENCES
1. National Research Council, “Changing Climate: Report of the Carbon Dioxide Assessment Committee”, National Academy Press, Washington, DC (1983).
2. Ministry of Energy and Natural Resources, “Energy Report 1970-1992” (in Turkish), Ankara, Turkey ( 1993). 3. U.S. Environmental Protection Agency, “Compilation of Air Pollution Emission Factors”, Vols. I and 2, 4th
edn., Publ. No. A3-42, Research Triangle Park, NC (September 1985). 4. G. Marland and R. M. Rotty, Teflus 36B, 232 (1984).