AN ENSEMBLE INERTIA WEIGHT CALCULATION STRATEGY IN PARTICLE SWARM OPTIMIZATION ALGORITHM
İbrahim Berkan AYDİLEK
Harran Üniversitesi, Mühendislik Fakültesi, Bilgisayar Mühendisliği Bölümü, Osmanbey Kampüsü, ŞANLIURFA
(Geliş/Received: 23.10.2017; Kabul/Accepted in Revised Form: 24.04.2018)
ABSTRACT: The ultimate success of particle swarm optimization depends on the velocity values of previous particles. Velocity is multiplied with inertia weight coefficient, and has a significant effect on search capability of the particle swarm optimization. When looking at previous studies that are carried out to calculate this coefficient, it is seen that inertia weight coefficient has been handled in several ways. In this article; a new ensemble inertia weight calculation strategy is proposed that uses other constant, random, linear decreasing, global local best, simulated annealing and chaotic inertia weight calculation methods. Other methods results are combined and used to make a final output decision in a proper way. In experimental tests, 30 common optimization benchmark test problems are used. Proposed ensemble strategy is proven by statistical tests and gives successful results in all optimization benchmark test problems.
Key Words: Inertia weight, Particle swarm optimization
Parçacık Sürü Optimizasyon Algoritmasında Bir Topluluk Atalet Ağırlığı Hesaplama Stratejisi
ÖZ: Parçacık sürüsü optimizasyonunun nihai başarısı, önceki parçacıkların hız değerlerine bağlıdır. Hız, atalet ağırlık katsayısı ile çarpılır ve parçacık sürüsü optimizasyonunun arama yeteneği üzerinde önemli bir etkiye sahiptir. Bu katsayıyı hesaplamak için yapılan önceki çalışmalara bakıldığında atalet ağırlık katsayısının çeşitli şekillerde ele alındığı görülmektedir. Bu makalede; diğer sabit, rasgele, doğrusal azalan, küresel yerel en iyi, benzetimli tavlama ve kaotik atalet ağırlığı hesaplama yöntemlerini kullanılan yeni bir topluluk atalet ağırlığı hesaplama stratejisi önerilmiştir. Önerilen yöntemde, diğer yöntemlerin sonuçları uygun bir şekilde birleştirilerek nihai çıktı kararı üretmek için kullanılmaktadır. Deneysel testlerde, bilinen 30 optimizasyon kıyaslama test problemi kullanılmaktadır. Önerilen topluluk stratejisi istatistiksel testlerle kanıtlanmış ve tüm optimizasyon kıyaslama test problemlerinde başarılı sonuçlar vermiştir.
Anahtar Kelimeler: Atalet ağırlığı, Parçacık sürü optimizasyonu, INTRODUCTION
Ensemble decision is interpreted as making the same decision together or as acting upon majority’s decision. Decision making can be a difficult task if some other alternative decisions exist. In such cases, making a final decision based on ensemble decision may be the best preference. The aim of optimization process can be defined as to find the optimum values. Metaheuristic optimization techniques are preferred instead of conventional search techniques on problems that have hard or impossible solutions in an acceptable time. Metaheuristic algorithms cannot provide to find always the best solution. But these algorithms do not leave the problem unsolved, and can provide solutions quickly. Particle swarm
optimization (PSO) algorithm mimics swarm behaviors in the nature. It imitates birds and fish that live in flocks. These animals exhibit social behaviors in together that is very apt for finding food in the nature. Particle swarm optimization algorithm was inspired from the search behaviors of these animals showing swarm behaviors. PSO is composed of swarm particles. Each particle has its own velocity, position and the personal best value. The swarm made up of particles and one of the particles is accepted as global best value. Personal and global values determine the next velocity and position of the particle thus, convergence process to the optimum solution is realized. Fast convergence may be caused the lower the sensitivity of solution, otherwise if it is to slow, time needed to reach the solution extends and may lead to some problems such as local optimum. A significant parameter that determines convergence quality and speed in PSO is called inertia weight. A number of previous studies have been done to calculate inertia coefficient in an effective way (Shi and Eberhart, 1998; Eberhart and Shi, 2001; Xin et al., 2009; Arumugam and Rao, 2006; Al-Hassan et al., 2007; Feng et al., 2008). In these studies, it was indicated that some inertia weight calculation methods have been successful rather than others in such problems. Some of these successful methods are: constant, random, linear decreasing, simulated annealing and chaotic inertia weight calculation methods. However, while these studies are suitable for such problems, nevertheless, they may not obtain good results in such other problems (Kennedy and Eberhart, 1995; Ala’raj and Abbod, 2016; Xu et al., 2016). PSO algorithm runs in a predetermined number of iteration times. At each iteration, if optimal inertia value corresponding to the best fitness value is determined, more accurate and consistent results may be obtained. However, optimization problems in real world always can change, so this parameter value can be handled in a dynamic way too (Kordestani et al., 2016). One of the advantages of PSO algorithm is that it can quickly converge to the global optimum. Easily applicable and fewer number of parameter values are to be adopted. Inertia weight parameter transmits information about the velocity and direction of the previous particle. If this value is too high, the convergence speed and search speed of the algorithm increases. If this parameter value is too low, the particles cannot transmit information about their previous velocity and direction to the next particles (Taherkhani and Safabakhsh, 2016). To assess optimization algorithm, convergence speed and success in finding global optimum are some of the main criteria. Providing balance between global and local search is important for the success of optimization algorithm (Shi and Eberhart, 2001). Some optimization algorithms try to achieve to keep this balance by use of various techniques. After a while the emergence of the standard PSO algorithm, inertia weight has been proposed (Shi and Eberhart, 1998). Higher inertia weight values lead to higher changes in velocity, particles search for new positions. At lower values, particles make updates in the local search area (Zhang et al., 2015).
LITERATURE REVIEW
Ala’raj and Abbod (Ala’raj and Abbod, 2016) develop a new combination method to increase classification accuracy. By developing a new combination rule, classifiers are combined. Thus, classifiers work together like a group or a team and share the decisions they made. Classifiers solve the same problem together by using the consensus approach. In general, the idea behind consensus approach is acting like a team cooperatively.
Xu et al. (Xu et al., 2016) propose heuristic preference relations and group decision making. In this study, a new method is developed to check and increase consistency between individual preferences and consensus among experts. A consensus criterion is developed to assess the level of consensus between experts. In this way, the level of closeness between one expert and others are determined. The experts make decisions collectively.
Bharti and Singh (Bharti and Singh, 2016) propose a selection method based on binary particle swarm optimization. Fitness based adaptive inertia weight value checks exploration and exploitation capabilities of particles in the search space. By integrating contrast and change with binary particle swarm optimization, the search capacity of algorithm is increased. The performance of grouping algorithm increases based on the properties chosen with this method. Fitness value, which changes
depending on the level of similarity between clusters and within the cluster, and inertia weight strategy which takes a dynamic value are presented. By using the fitness value of each particle, the inertia weight value of other particle is adjusted dynamically. Overall iteration fitness value is determined according to the clustering function.
Taherkhani and Safabakhsh (Taherkhani and Safabakhsh, 2016) propose an adaptive method to find inertia weight value for each particle in different dimensions. They regard particle success and the amount of replacement for each particle as feedback. It is demonstrated that the proposed model generally has optimal performance. The results clearly demonstrate that the proposed model is superior to other current models. If the best values of the particle in the last two iterations are close to each other, inertia weight shows a higher change. However, if the best particle values in the last two iterations are different, inertia weight value shows a lower change. Each particle has a unique inertia weight value and all of them are taken into consideration to adjust the general inertia weight of the particle. The advantage of this study is that it is demonstrated that successful results are obtained when inertia weight is dynamically set. However, making assessments based on the last two iterations and ignoring the general fitness value of the current iteration are considered as deficits in this study.
Pluhacek et al. (Pluhacek et al., 2013) propose a developed PSO algorithm. Algorithm uses inertia weight that decreases linearly. Three different chaos are examined by adopting an approach that generates random numbers. It is demonstrated that main PSO formula reaches success with dissipative standard map-based number generator version. Thus, early convergence problem is prevented and it is demonstrated that it is proven to have an edge over other versions. The limitation of this study is that convergence is too slow and thus needs long period of time, because of which it requires high numbers of iterations.
PARTICLE SWARM OPTIMIZATION ALGORITHM
Particle swarm optimization is developed inspired from social behaviors of bird and fish swarms (Kennedy and Eberhart, 1995). In PSO, every candidate solution is named as a particle. These particles form the artificial swarm. Algorithm obtains particles’ social and cognitive information and aims to find an acceptable optimum value (Çavdar, 2016). The initial population can be prepared with random position and velocity in the search space. Later on, optimization starts when particles pass on their next velocity and positions and fitness value is calculated. Fitness function differs depending on the related study (Gheisari and Meybodi, 2016). In Eq. (1) and Eq. (2), for example; i. particle’s position is shown as
Xi and velocity is shown as Vi. t represents actual, t+1 represents the next iteration values. Best value of a
particle is shown as Pi and the global best particle is shown as Pg (Lim and Isa, 2014).
𝑉𝑖(𝑡 + 1) = 𝑤𝑉𝑖(𝑡) + 𝑐1𝑟1(𝑃𝑖(𝑡) − 𝑋𝑖(𝑡)) + 𝑐2𝑟2(𝑃𝑔(𝑡) − 𝑋𝑖(𝑡)) (1)
𝑋𝑖(𝑡 + 1) = 𝑋𝑖(𝑡) + 𝑉𝑖(𝑡 + 1)
(2)
Here, w is called as inertia weight and has an important effect upon exploration and exploitation, which form the basis of optimization. While a w with a high value in the search space increases global search capability, a w with low value improves local search (Armano and Farmani, 2016). w value has a great effect on time spent for reaching solution and on the sensitivity of solution value obtained. r1 and r2 are
random numbers between 0 and 1. c1 and c2 are called as acceleration coefficient and determine
acceleration amount that is applied on particle cognitive best and group social or global best (Arasomwan and Adewumi, 2013).
USED INERTIA WEIGHT STRATEGIES AND OPTIMIZATION TEST FUNCTIONS
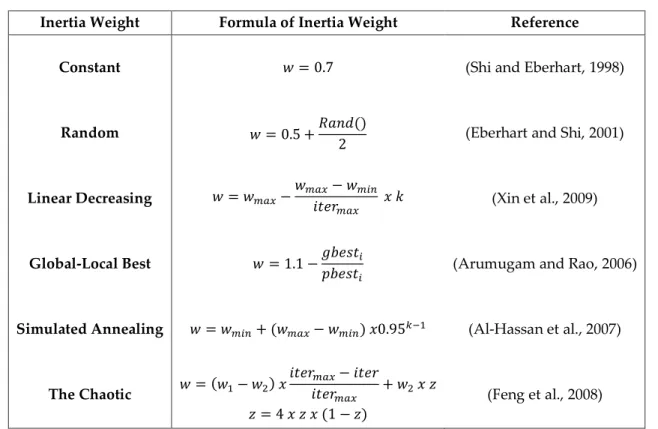
Some of the successful inertia weight strategies used in the previous studies (Shi and Eberhart, 1998; Eberhart and Shi, 2001; Xin et al., 2009; Arumugam and Rao, 2006; Al-Hassan et al., 2007; Feng et al., 2008) are presented in Table 1 (Arasomwan and Adewumi, 2013; Maca and Pech, 2015; Nickabadi et al., 2011; Bansal et al., 2011). In the previous studies, inertia weights are calculated with constant, random or with adaptive varying approaches. Adaptive approach calculations are made according to iteration number, local or global best values. Constant method uses a constant 0.7 value. Random method takes value between 0.5 and 1. Linear decreasing, Global-local best, simulated annealing, the chaotic methods take values as given formulas in the table.
Table 1. Used inertia weight strategies
Inertia Weight Formula of Inertia Weight Reference
Constant 𝑤 = 0.7 (Shi and Eberhart, 1998)
Random 𝑤 = 0.5 +𝑅𝑎𝑛𝑑()
2 (Eberhart and Shi, 2001)
Linear Decreasing 𝑤 = 𝑤𝑚𝑎𝑥−
𝑤𝑚𝑎𝑥− 𝑤𝑚𝑖𝑛
𝑖𝑡𝑒𝑟𝑚𝑎𝑥 𝑥 𝑘 (Xin et al., 2009)
Global-Local Best 𝑤 = 1.1 −𝑔𝑏𝑒𝑠𝑡𝑖 𝑝𝑏𝑒𝑠𝑡𝑖
(Arumugam and Rao, 2006)
Simulated Annealing 𝑤 = 𝑤𝑚𝑖𝑛+ (𝑤𝑚𝑎𝑥− 𝑤𝑚𝑖𝑛) 𝑥0.95𝑘−1 (Al-Hassan et al., 2007)
The Chaotic 𝑤 = (𝑤1− 𝑤2) 𝑥 𝑖𝑡𝑒𝑟𝑚𝑎𝑥− 𝑖𝑡𝑒𝑟 𝑖𝑡𝑒𝑟𝑚𝑎𝑥 + 𝑤2 𝑥 𝑧 𝑧 = 4 𝑥 𝑧 𝑥 (1 − 𝑧) (Feng et al., 2008)
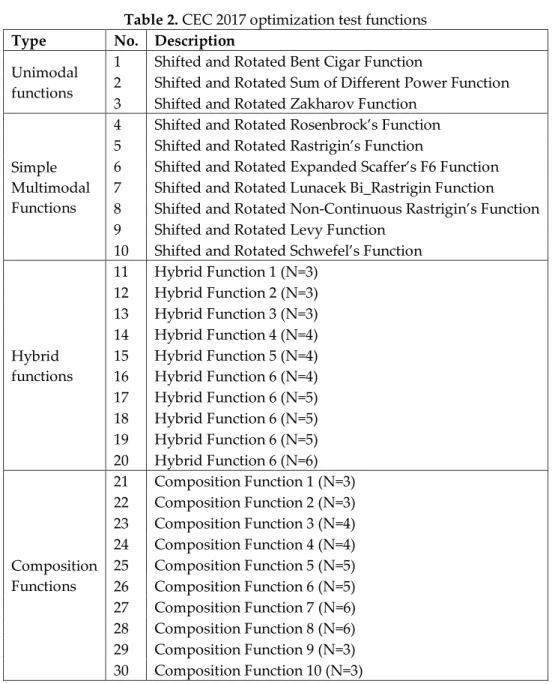
Widely known and used optimization functions in experiments are given in Table 2 (Arasomwan and Adewumi, 2013; Nickabadi et al., 2011; Surjanovic and Bingham, 2013; Bansal et al., 2011; Uymaz et al., 2015). All CEC 2017 benchmark test functions’ (Awad et al., 2016) global optimum values are set as 0 and variables search range is [-100, +100].
Table 2. CEC 2017 optimization test functions Type No. Description
Unimodal functions
1 Shifted and Rotated Bent Cigar Function
2 Shifted and Rotated Sum of Different Power Function 3 Shifted and Rotated Zakharov Function
Simple Multimodal Functions
4 Shifted and Rotated Rosenbrock’s Function 5 Shifted and Rotated Rastrigin’s Function
6 Shifted and Rotated Expanded Scaffer’s F6 Function 7 Shifted and Rotated Lunacek Bi_Rastrigin Function 8 Shifted and Rotated Non-Continuous Rastrigin’s Function 9 Shifted and Rotated Levy Function
10 Shifted and Rotated Schwefel’s Function
Hybrid functions 11 Hybrid Function 1 (N=3) 12 Hybrid Function 2 (N=3) 13 Hybrid Function 3 (N=3) 14 Hybrid Function 4 (N=4) 15 Hybrid Function 5 (N=4) 16 Hybrid Function 6 (N=4) 17 Hybrid Function 6 (N=5) 18 Hybrid Function 6 (N=5) 19 Hybrid Function 6 (N=5) 20 Hybrid Function 6 (N=6) Composition Functions 21 Composition Function 1 (N=3) 22 Composition Function 2 (N=3) 23 Composition Function 3 (N=4) 24 Composition Function 4 (N=4) 25 Composition Function 5 (N=5) 26 Composition Function 6 (N=5) 27 Composition Function 7 (N=6) 28 Composition Function 8 (N=6) 29 Composition Function 9 (N=3) 30 Composition Function 10 (N=3) PROPOSED ENSEMBLE INERTIA WEIGHT STRATEGY
Ensemble decision result obtained from individuals are combined and used successfully to make a final decision. Group decision making is an approach in which several experts on the topic come together to choose the best among suitable alternatives. Group decision making is used widely to use the minds of some experts (Xu et al., 2016). In studies like constructing decision forests (Ho, 1998) or credit score calculation, it has recently been observed that rather than more than one artificial intelligence classifier, combined classifier structures give better results (Ala’raj and Abbod, 2016). In the studies, majority voting, weighted average or accumulation which are simple rule combinations and basic components methods are mostly preferred (Ala’raj and Abbod, 2016). In combined methods, each classifier is trained independently and produce its own decisions. Later on, a final decision is obtained from combined decisions (Ala’raj and Abbod, 2016; Zang et al., 2014; Rokach, 2010). In this paper, more than one inertia weight strategies are used. Best optimal inertia weight value is formed to a group decision. In this way, final optimization result is provided more successful. At each iteration of particle swarm optimization, the new values of particles are calculated. In the proposed method, fitness values are calculated using
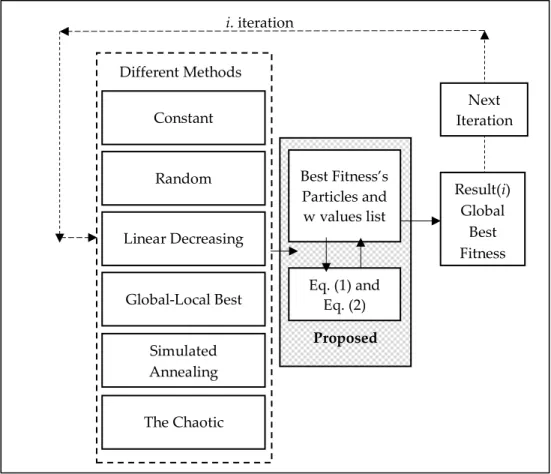
inertia weight divided into ‘n’ item sub-interval in the same iteration. ‘n’ is the number of the used inertia weight methods. Transferring the individual from which the best fitness function value is obtained to the following calculations is called as elitism. It is a successful and popular method to generate new generation (Whitley, 1994; Xiang et al., 2015; Lim and Isa, 2014; Liang and Leung, 2011). In this way, fitness value of the iteration is calculated using the elite inertia weight value. In Figure 1, the flowchart of proposed method is shown. During each iteration (i), n number calculations are done by each inertia weight method with particles (positions(X) and velocities(V)) that are corresponding to the best fitness and then the next iteration starts.
Figure 1. Flowchart of proposed ensemble inertia weight strategy
Proposed method calculates the most optimal inertia weight value within iteration. In this method, the best particle among these fitness values was used for related iteration. The deficit of suggested method is that it needed more run time compared to other methods. The success of the proposed method depends on trying and finding the most suitable inertia weight value by looking other inertia weight method values. In this way, the best possible inertia weight is searched by constricting the solution pool rapidly on the basis of iteration number. In the current methods, more constricted or random values are used. Ensemble decision is made using elitism when comparing inertia weight strategies and optimization functions. For example, suppose that, on iteration (i), linear decreasing method has best fitness value among the all other inertia weight strategies. This best method particle and also w values are extracted from strategies to in a list as follows: [0.7, 0.61, 0.8, 0.55, 0.9]. After that, there will be six calculations by Eq. (1) and Eq. (2) by use of best particles’ current positions(X), velocities(V) and this w values list. Finally, calculated best fitness is accepted as final output result (i).
Proposed Best Fitness’s Particles and w values list Constant Next Iteration Random Linear Decreasing Global-Local Best i. iteration Result(i) Global Best Fitness Eq. (1) and Eq. (2) Simulated Annealing The Chaotic Different Methods
EXPERIMENTAL RESULTS AND DISCUSSION
All experimental tests run in a computer with Intel core i7-4770HQ @ 2.20GHz CPU, 16,0 GB system memory and Windows10 operation system by using Matlab2017a software. In studies, the parameter values of particle swarm optimization algorithm are as follows: variable dimension (d)= 10, personal learning coefficient (c1) = 2, global learning coefficient (c2) = 2, population size (swarm size) = 10, number
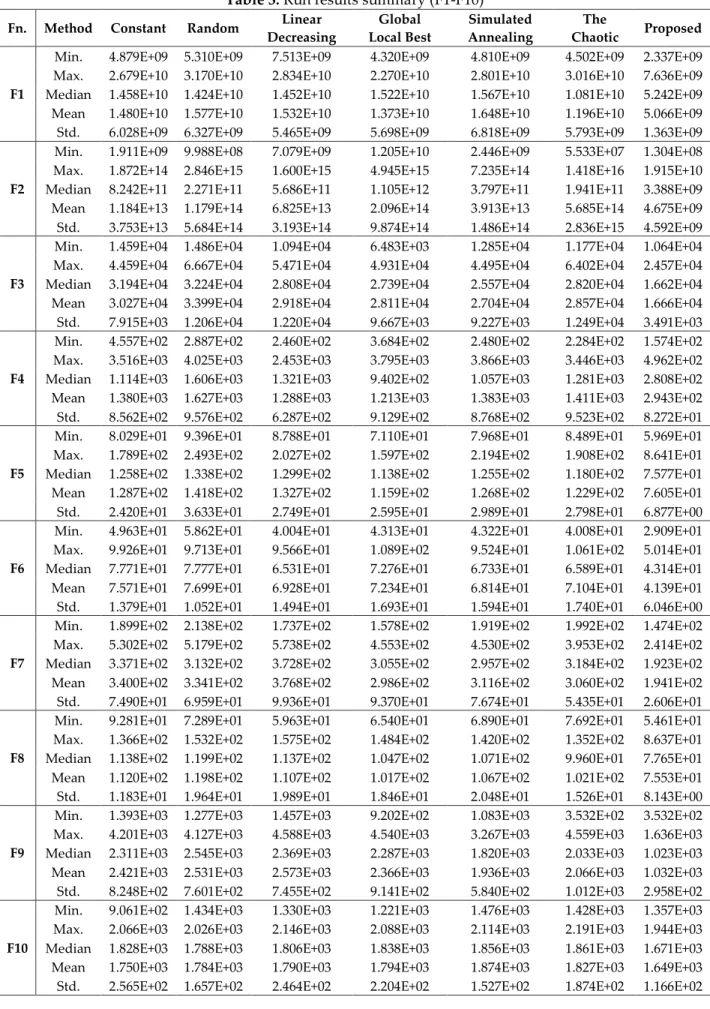
of iterations = 1000, wmax = 0.9 and wmin = 0.4. 25 independent runs are made. As it can be seen in Table 3,
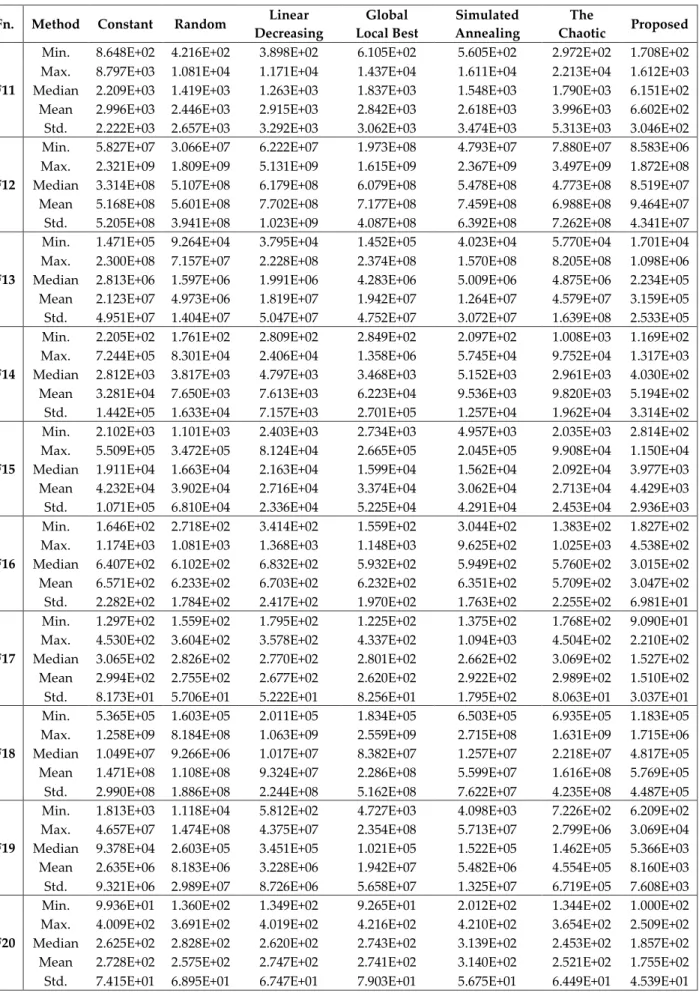
proposed inertia weight strategy yielded more successful results compared to other methods on functions that are between 1 and 10. It can be inferred that most obtained results are nearly at least ten times better than the other methods. In Table 4, summary run results of functions between 11 and 20 are given. Proposed method is better than other constant, random, linear decreasing, global local best, simulated annealing and the chaotic methods in the context of mean values. And finally, on last ten functions, it can be seen in Table 5, proposed method outperforms others in the context of mean values. A more detail view of changings in fitness function based on iteration can be seen in Figure 2. In every iteration, proposed ensemble approach seeks better fitness value by use of other six inertia weight strategies w values and global best particle.
Table 3. Run results summary (F1-F10) Fn. Method Constant Random Linear
Decreasing Global Local Best Simulated Annealing The Chaotic Proposed F1
Min. 4.879E+09 5.310E+09 7.513E+09 4.320E+09 4.810E+09 4.502E+09 2.337E+09
Max. 2.679E+10 3.170E+10 2.834E+10 2.270E+10 2.801E+10 3.016E+10 7.636E+09
Median 1.458E+10 1.424E+10 1.452E+10 1.522E+10 1.567E+10 1.081E+10 5.242E+09
Mean 1.480E+10 1.577E+10 1.532E+10 1.373E+10 1.648E+10 1.196E+10 5.066E+09
Std. 6.028E+09 6.327E+09 5.465E+09 5.698E+09 6.818E+09 5.793E+09 1.363E+09
F2
Min. 1.911E+09 9.988E+08 7.079E+09 1.205E+10 2.446E+09 5.533E+07 1.304E+08
Max. 1.872E+14 2.846E+15 1.600E+15 4.945E+15 7.235E+14 1.418E+16 1.915E+10
Median 8.242E+11 2.271E+11 5.686E+11 1.105E+12 3.797E+11 1.941E+11 3.388E+09
Mean 1.184E+13 1.179E+14 6.825E+13 2.096E+14 3.913E+13 5.685E+14 4.675E+09
Std. 3.753E+13 5.684E+14 3.193E+14 9.874E+14 1.486E+14 2.836E+15 4.592E+09
F3
Min. 1.459E+04 1.486E+04 1.094E+04 6.483E+03 1.285E+04 1.177E+04 1.064E+04
Max. 4.459E+04 6.667E+04 5.471E+04 4.931E+04 4.495E+04 6.402E+04 2.457E+04
Median 3.194E+04 3.224E+04 2.808E+04 2.739E+04 2.557E+04 2.820E+04 1.662E+04
Mean 3.027E+04 3.399E+04 2.918E+04 2.811E+04 2.704E+04 2.857E+04 1.666E+04
Std. 7.915E+03 1.206E+04 1.220E+04 9.667E+03 9.227E+03 1.249E+04 3.491E+03
F4
Min. 4.557E+02 2.887E+02 2.460E+02 3.684E+02 2.480E+02 2.284E+02 1.574E+02
Max. 3.516E+03 4.025E+03 2.453E+03 3.795E+03 3.866E+03 3.446E+03 4.962E+02
Median 1.114E+03 1.606E+03 1.321E+03 9.402E+02 1.057E+03 1.281E+03 2.808E+02
Mean 1.380E+03 1.627E+03 1.288E+03 1.213E+03 1.383E+03 1.411E+03 2.943E+02
Std. 8.562E+02 9.576E+02 6.287E+02 9.129E+02 8.768E+02 9.523E+02 8.272E+01
F5
Min. 8.029E+01 9.396E+01 8.788E+01 7.110E+01 7.968E+01 8.489E+01 5.969E+01
Max. 1.789E+02 2.493E+02 2.027E+02 1.597E+02 2.194E+02 1.908E+02 8.641E+01
Median 1.258E+02 1.338E+02 1.299E+02 1.138E+02 1.255E+02 1.180E+02 7.577E+01
Mean 1.287E+02 1.418E+02 1.327E+02 1.159E+02 1.268E+02 1.229E+02 7.605E+01
Std. 2.420E+01 3.633E+01 2.749E+01 2.595E+01 2.989E+01 2.798E+01 6.877E+00
F6
Min. 4.963E+01 5.862E+01 4.004E+01 4.313E+01 4.322E+01 4.008E+01 2.909E+01
Max. 9.926E+01 9.713E+01 9.566E+01 1.089E+02 9.524E+01 1.061E+02 5.014E+01
Median 7.771E+01 7.777E+01 6.531E+01 7.276E+01 6.733E+01 6.589E+01 4.314E+01
Mean 7.571E+01 7.699E+01 6.928E+01 7.234E+01 6.814E+01 7.104E+01 4.139E+01
Std. 1.379E+01 1.052E+01 1.494E+01 1.693E+01 1.594E+01 1.740E+01 6.046E+00
F7
Min. 1.899E+02 2.138E+02 1.737E+02 1.578E+02 1.919E+02 1.992E+02 1.474E+02
Max. 5.302E+02 5.179E+02 5.738E+02 4.553E+02 4.530E+02 3.953E+02 2.414E+02
Median 3.371E+02 3.132E+02 3.728E+02 3.055E+02 2.957E+02 3.184E+02 1.923E+02
Mean 3.400E+02 3.341E+02 3.768E+02 2.986E+02 3.116E+02 3.060E+02 1.941E+02
Std. 7.490E+01 6.959E+01 9.936E+01 9.370E+01 7.674E+01 5.435E+01 2.606E+01
F8
Min. 9.281E+01 7.289E+01 5.963E+01 6.540E+01 6.890E+01 7.692E+01 5.461E+01
Max. 1.366E+02 1.532E+02 1.575E+02 1.484E+02 1.420E+02 1.352E+02 8.637E+01
Median 1.138E+02 1.199E+02 1.137E+02 1.047E+02 1.071E+02 9.960E+01 7.765E+01
Mean 1.120E+02 1.198E+02 1.107E+02 1.017E+02 1.067E+02 1.021E+02 7.553E+01
Std. 1.183E+01 1.964E+01 1.989E+01 1.846E+01 2.048E+01 1.526E+01 8.143E+00
F9
Min. 1.393E+03 1.277E+03 1.457E+03 9.202E+02 1.083E+03 3.532E+02 3.532E+02
Max. 4.201E+03 4.127E+03 4.588E+03 4.540E+03 3.267E+03 4.559E+03 1.636E+03
Median 2.311E+03 2.545E+03 2.369E+03 2.287E+03 1.820E+03 2.033E+03 1.023E+03
Mean 2.421E+03 2.531E+03 2.573E+03 2.366E+03 1.936E+03 2.066E+03 1.032E+03
Std. 8.248E+02 7.601E+02 7.455E+02 9.141E+02 5.840E+02 1.012E+03 2.958E+02
F10
Min. 9.061E+02 1.434E+03 1.330E+03 1.221E+03 1.476E+03 1.428E+03 1.357E+03
Max. 2.066E+03 2.026E+03 2.146E+03 2.088E+03 2.114E+03 2.191E+03 1.944E+03
Median 1.828E+03 1.788E+03 1.806E+03 1.838E+03 1.856E+03 1.861E+03 1.671E+03
Mean 1.750E+03 1.784E+03 1.790E+03 1.794E+03 1.874E+03 1.827E+03 1.649E+03
Table 4. Run results summary (F11-F20)
Fn. Method Constant Random Linear Decreasing Global Local Best Simulated Annealing The Chaotic Proposed F11
Min. 8.648E+02 4.216E+02 3.898E+02 6.105E+02 5.605E+02 2.972E+02 1.708E+02
Max. 8.797E+03 1.081E+04 1.171E+04 1.437E+04 1.611E+04 2.213E+04 1.612E+03
Median 2.209E+03 1.419E+03 1.263E+03 1.837E+03 1.548E+03 1.790E+03 6.151E+02
Mean 2.996E+03 2.446E+03 2.915E+03 2.842E+03 2.618E+03 3.996E+03 6.602E+02
Std. 2.222E+03 2.657E+03 3.292E+03 3.062E+03 3.474E+03 5.313E+03 3.046E+02
F12
Min. 5.827E+07 3.066E+07 6.222E+07 1.973E+08 4.793E+07 7.880E+07 8.583E+06
Max. 2.321E+09 1.809E+09 5.131E+09 1.615E+09 2.367E+09 3.497E+09 1.872E+08
Median 3.314E+08 5.107E+08 6.179E+08 6.079E+08 5.478E+08 4.773E+08 8.519E+07
Mean 5.168E+08 5.601E+08 7.702E+08 7.177E+08 7.459E+08 6.988E+08 9.464E+07
Std. 5.205E+08 3.941E+08 1.023E+09 4.087E+08 6.392E+08 7.262E+08 4.341E+07
F13
Min. 1.471E+05 9.264E+04 3.795E+04 1.452E+05 4.023E+04 5.770E+04 1.701E+04
Max. 2.300E+08 7.157E+07 2.228E+08 2.374E+08 1.570E+08 8.205E+08 1.098E+06
Median 2.813E+06 1.597E+06 1.991E+06 4.283E+06 5.009E+06 4.875E+06 2.234E+05
Mean 2.123E+07 4.973E+06 1.819E+07 1.942E+07 1.264E+07 4.579E+07 3.159E+05
Std. 4.951E+07 1.404E+07 5.047E+07 4.752E+07 3.072E+07 1.639E+08 2.533E+05
F14
Min. 2.205E+02 1.761E+02 2.809E+02 2.849E+02 2.097E+02 1.008E+03 1.169E+02
Max. 7.244E+05 8.301E+04 2.406E+04 1.358E+06 5.745E+04 9.752E+04 1.317E+03
Median 2.812E+03 3.817E+03 4.797E+03 3.468E+03 5.152E+03 2.961E+03 4.030E+02
Mean 3.281E+04 7.650E+03 7.613E+03 6.223E+04 9.536E+03 9.820E+03 5.194E+02
Std. 1.442E+05 1.633E+04 7.157E+03 2.701E+05 1.257E+04 1.962E+04 3.314E+02
F15
Min. 2.102E+03 1.101E+03 2.403E+03 2.734E+03 4.957E+03 2.035E+03 2.814E+02
Max. 5.509E+05 3.472E+05 8.124E+04 2.665E+05 2.045E+05 9.908E+04 1.150E+04
Median 1.911E+04 1.663E+04 2.163E+04 1.599E+04 1.562E+04 2.092E+04 3.977E+03
Mean 4.232E+04 3.902E+04 2.716E+04 3.374E+04 3.062E+04 2.713E+04 4.429E+03
Std. 1.071E+05 6.810E+04 2.336E+04 5.225E+04 4.291E+04 2.453E+04 2.936E+03
F16
Min. 1.646E+02 2.718E+02 3.414E+02 1.559E+02 3.044E+02 1.383E+02 1.827E+02
Max. 1.174E+03 1.081E+03 1.368E+03 1.148E+03 9.625E+02 1.025E+03 4.538E+02
Median 6.407E+02 6.102E+02 6.832E+02 5.932E+02 5.949E+02 5.760E+02 3.015E+02
Mean 6.571E+02 6.233E+02 6.703E+02 6.232E+02 6.351E+02 5.709E+02 3.047E+02
Std. 2.282E+02 1.784E+02 2.417E+02 1.970E+02 1.763E+02 2.255E+02 6.981E+01
F17
Min. 1.297E+02 1.559E+02 1.795E+02 1.225E+02 1.375E+02 1.768E+02 9.090E+01
Max. 4.530E+02 3.604E+02 3.578E+02 4.337E+02 1.094E+03 4.504E+02 2.210E+02
Median 3.065E+02 2.826E+02 2.770E+02 2.801E+02 2.662E+02 3.069E+02 1.527E+02
Mean 2.994E+02 2.755E+02 2.677E+02 2.620E+02 2.922E+02 2.989E+02 1.510E+02
Std. 8.173E+01 5.706E+01 5.222E+01 8.256E+01 1.795E+02 8.063E+01 3.037E+01
F18
Min. 5.365E+05 1.603E+05 2.011E+05 1.834E+05 6.503E+05 6.935E+05 1.183E+05
Max. 1.258E+09 8.184E+08 1.063E+09 2.559E+09 2.715E+08 1.631E+09 1.715E+06
Median 1.049E+07 9.266E+06 1.017E+07 8.382E+07 1.257E+07 2.218E+07 4.817E+05
Mean 1.471E+08 1.108E+08 9.324E+07 2.286E+08 5.599E+07 1.616E+08 5.769E+05
Std. 2.990E+08 1.886E+08 2.244E+08 5.162E+08 7.622E+07 4.235E+08 4.487E+05
F19
Min. 1.813E+03 1.118E+04 5.812E+02 4.727E+03 4.098E+03 7.226E+02 6.209E+02
Max. 4.657E+07 1.474E+08 4.375E+07 2.354E+08 5.713E+07 2.799E+06 3.069E+04
Median 9.378E+04 2.603E+05 3.451E+05 1.021E+05 1.522E+05 1.462E+05 5.366E+03
Mean 2.635E+06 8.183E+06 3.228E+06 1.942E+07 5.482E+06 4.554E+05 8.160E+03
Std. 9.321E+06 2.989E+07 8.726E+06 5.658E+07 1.325E+07 6.719E+05 7.608E+03
F20
Min. 9.936E+01 1.360E+02 1.349E+02 9.265E+01 2.012E+02 1.344E+02 1.000E+02
Max. 4.009E+02 3.691E+02 4.019E+02 4.216E+02 4.210E+02 3.654E+02 2.509E+02
Median 2.625E+02 2.828E+02 2.620E+02 2.743E+02 3.139E+02 2.453E+02 1.857E+02
Mean 2.728E+02 2.575E+02 2.747E+02 2.741E+02 3.140E+02 2.521E+02 1.755E+02
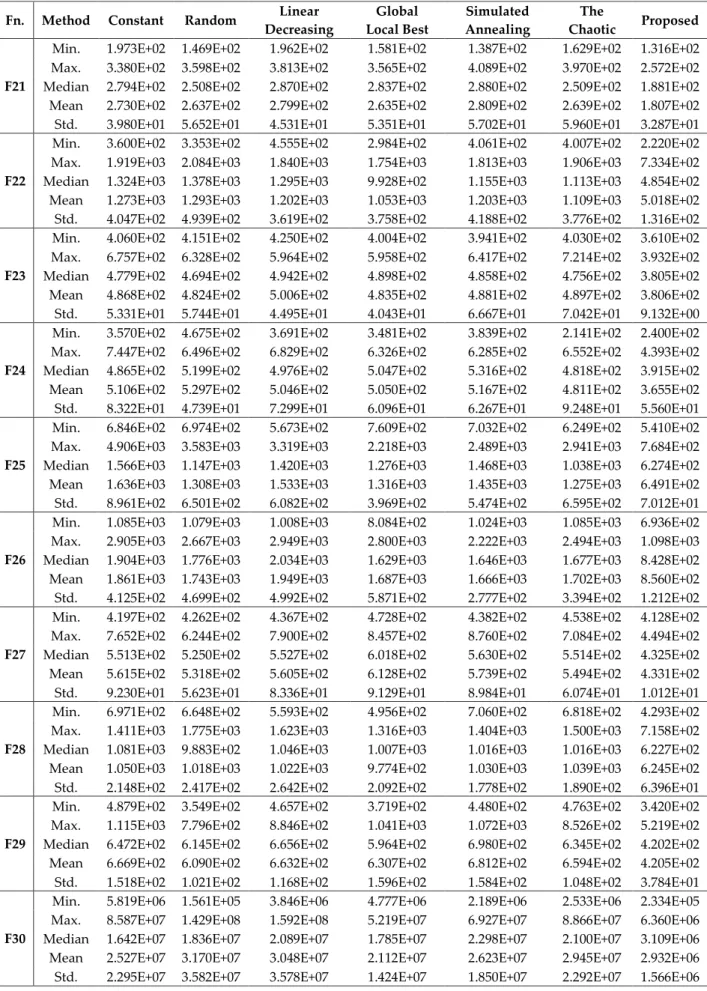
Table 5. Run results summary (F21-F30)
Fn. Method Constant Random Linear Decreasing Global Local Best Simulated Annealing The Chaotic Proposed F21
Min. 1.973E+02 1.469E+02 1.962E+02 1.581E+02 1.387E+02 1.629E+02 1.316E+02
Max. 3.380E+02 3.598E+02 3.813E+02 3.565E+02 4.089E+02 3.970E+02 2.572E+02
Median 2.794E+02 2.508E+02 2.870E+02 2.837E+02 2.880E+02 2.509E+02 1.881E+02
Mean 2.730E+02 2.637E+02 2.799E+02 2.635E+02 2.809E+02 2.639E+02 1.807E+02
Std. 3.980E+01 5.652E+01 4.531E+01 5.351E+01 5.702E+01 5.960E+01 3.287E+01
F22
Min. 3.600E+02 3.353E+02 4.555E+02 2.984E+02 4.061E+02 4.007E+02 2.220E+02
Max. 1.919E+03 2.084E+03 1.840E+03 1.754E+03 1.813E+03 1.906E+03 7.334E+02
Median 1.324E+03 1.378E+03 1.295E+03 9.928E+02 1.155E+03 1.113E+03 4.854E+02
Mean 1.273E+03 1.293E+03 1.202E+03 1.053E+03 1.203E+03 1.109E+03 5.018E+02
Std. 4.047E+02 4.939E+02 3.619E+02 3.758E+02 4.188E+02 3.776E+02 1.316E+02
F23
Min. 4.060E+02 4.151E+02 4.250E+02 4.004E+02 3.941E+02 4.030E+02 3.610E+02
Max. 6.757E+02 6.328E+02 5.964E+02 5.958E+02 6.417E+02 7.214E+02 3.932E+02
Median 4.779E+02 4.694E+02 4.942E+02 4.898E+02 4.858E+02 4.756E+02 3.805E+02
Mean 4.868E+02 4.824E+02 5.006E+02 4.835E+02 4.881E+02 4.897E+02 3.806E+02
Std. 5.331E+01 5.744E+01 4.495E+01 4.043E+01 6.667E+01 7.042E+01 9.132E+00
F24
Min. 3.570E+02 4.675E+02 3.691E+02 3.481E+02 3.839E+02 2.141E+02 2.400E+02
Max. 7.447E+02 6.496E+02 6.829E+02 6.326E+02 6.285E+02 6.552E+02 4.393E+02
Median 4.865E+02 5.199E+02 4.976E+02 5.047E+02 5.316E+02 4.818E+02 3.915E+02
Mean 5.106E+02 5.297E+02 5.046E+02 5.050E+02 5.167E+02 4.811E+02 3.655E+02
Std. 8.322E+01 4.739E+01 7.299E+01 6.096E+01 6.267E+01 9.248E+01 5.560E+01
F25
Min. 6.846E+02 6.974E+02 5.673E+02 7.609E+02 7.032E+02 6.249E+02 5.410E+02
Max. 4.906E+03 3.583E+03 3.319E+03 2.218E+03 2.489E+03 2.941E+03 7.684E+02
Median 1.566E+03 1.147E+03 1.420E+03 1.276E+03 1.468E+03 1.038E+03 6.274E+02
Mean 1.636E+03 1.308E+03 1.533E+03 1.316E+03 1.435E+03 1.275E+03 6.491E+02
Std. 8.961E+02 6.501E+02 6.082E+02 3.969E+02 5.474E+02 6.595E+02 7.012E+01
F26
Min. 1.085E+03 1.079E+03 1.008E+03 8.084E+02 1.024E+03 1.085E+03 6.936E+02
Max. 2.905E+03 2.667E+03 2.949E+03 2.800E+03 2.222E+03 2.494E+03 1.098E+03
Median 1.904E+03 1.776E+03 2.034E+03 1.629E+03 1.646E+03 1.677E+03 8.428E+02
Mean 1.861E+03 1.743E+03 1.949E+03 1.687E+03 1.666E+03 1.702E+03 8.560E+02
Std. 4.125E+02 4.699E+02 4.992E+02 5.871E+02 2.777E+02 3.394E+02 1.212E+02
F27
Min. 4.197E+02 4.262E+02 4.367E+02 4.728E+02 4.382E+02 4.538E+02 4.128E+02
Max. 7.652E+02 6.244E+02 7.900E+02 8.457E+02 8.760E+02 7.084E+02 4.494E+02
Median 5.513E+02 5.250E+02 5.527E+02 6.018E+02 5.630E+02 5.514E+02 4.325E+02
Mean 5.615E+02 5.318E+02 5.605E+02 6.128E+02 5.739E+02 5.494E+02 4.331E+02
Std. 9.230E+01 5.623E+01 8.336E+01 9.129E+01 8.984E+01 6.074E+01 1.012E+01
F28
Min. 6.971E+02 6.648E+02 5.593E+02 4.956E+02 7.060E+02 6.818E+02 4.293E+02
Max. 1.411E+03 1.775E+03 1.623E+03 1.316E+03 1.404E+03 1.500E+03 7.158E+02
Median 1.081E+03 9.883E+02 1.046E+03 1.007E+03 1.016E+03 1.016E+03 6.227E+02
Mean 1.050E+03 1.018E+03 1.022E+03 9.774E+02 1.030E+03 1.039E+03 6.245E+02
Std. 2.148E+02 2.417E+02 2.642E+02 2.092E+02 1.778E+02 1.890E+02 6.396E+01
F29
Min. 4.879E+02 3.549E+02 4.657E+02 3.719E+02 4.480E+02 4.763E+02 3.420E+02
Max. 1.115E+03 7.796E+02 8.846E+02 1.041E+03 1.072E+03 8.526E+02 5.219E+02
Median 6.472E+02 6.145E+02 6.656E+02 5.964E+02 6.980E+02 6.345E+02 4.202E+02
Mean 6.669E+02 6.090E+02 6.632E+02 6.307E+02 6.812E+02 6.594E+02 4.205E+02
Std. 1.518E+02 1.021E+02 1.168E+02 1.596E+02 1.584E+02 1.048E+02 3.784E+01
F30
Min. 5.819E+06 1.561E+05 3.846E+06 4.777E+06 2.189E+06 2.533E+06 2.334E+05
Max. 8.587E+07 1.429E+08 1.592E+08 5.219E+07 6.927E+07 8.866E+07 6.360E+06
Median 1.642E+07 1.836E+07 2.089E+07 1.785E+07 2.298E+07 2.100E+07 3.109E+06
Mean 2.527E+07 3.170E+07 3.048E+07 2.112E+07 2.623E+07 2.945E+07 2.932E+06
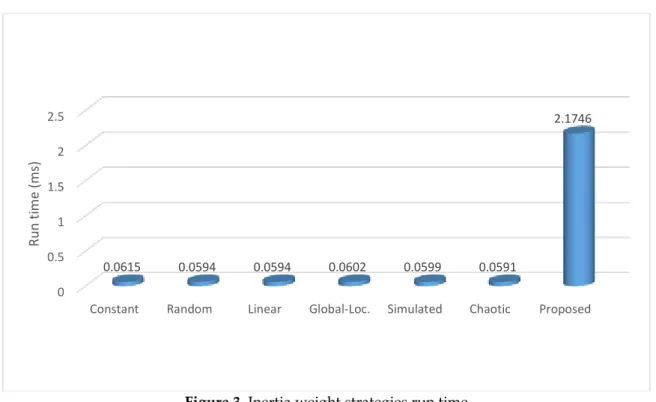
The run time of the proposed method depends on the number of the other method number and is far higher than the others. As can be seen in Figure 3, the proposed strategy has high computational time than the other methods. In a single iteration, the proposed strategy used six-different strategies and also the new particles obtained by these strategies were evaluated by fitness function. Then, the best one was selected. So, in a single iteration the proposed method used six function evaluations. The number of function evaluation (number of particles × number of maximum iteration) is not same for the proposed method. The proposed method used six times more the number of function evaluation. This explains the difference of computational time in Figure 3 between proposed strategy and other methods.
Figure 3. Inertia weight strategies run time
In Figure 4, changing of inertia weight value upon iteration is given. First constant is always 0.7. Second random method takes values are between 0.5 and 1. Linear decreasing method starts from 0.9 and decreases to 0.4 by iterations. Rest methods also take values by use of global, personal best and iteration values. Proposed method uses one of the each other w value upon an iteration and can be tracked on last chart. When the general results are examined, it is seen that ultimate accomplishment is based on the convergence in the first iterations. Therefore, it is seen that initial inertia weight value the non-constant method which changes depending on iteration and which can change in wide range of values was superior compared to the other methods. In Figure 4, it is seen that proposed method prevents the production of uniform inertia weight value by scanning a larger area in iterations. All values in the other methods are tried respectively and the relevant iteration calculations are made using the particle that corresponds to the best fitness value. It is concluded that lower values are preferred as convergence to the optimal value of the function is attained at higher iteration values.
0 0.5 1 1.5 2 2.5
Constant Random Linear Global-Loc. Simulated Chaotic Proposed
0.0615 0.0594 0.0594 0.0602 0.0599 0.0591 2.1746 Ru n t ime (ms )
STATISTICAL TESTS
In order to see obtained results in performance are statistically significant or not, Wilcoxon rank sum test is employed. In statistical test 5% significance level (p-value=0.05) is adopted. If a lower value than this p-value is indicates that the two compared methods are statistically different. In Table 6, proposed method is compared with other methods one by one. In the obtained results is showed that all p-values are lower than 0.05 and proposed method is statistically significant different than the others.
Table 6. Wilcoxon rank sum test results
Fn. Proposed/ Constant Proposed/ Random Proposed/ Linear Dec. Proposed/ Global-Loc. Proposed/ Simulated Proposed/ The Chaotic
F1 2.297E-08 4.638E-09 1.597E-09 5.559E-07 1.167E-08 4.102E-07
F2 1.836E-08 2.924E-06 2.898E-09 1.597E-09 2.870E-08 6.891E-08
F3 1.993E-07 4.541E-07 4.609E-05 1.814E-06 1.652E-05 1.128E-04
F4 2.898E-09 7.380E-09 2.722E-07 4.126E-09 1.465E-08 3.017E-07
F5 4.122E-09 1.414E-09 1.414E-09 6.180E-08 4.122E-09 2.284E-09
F6 1.597E-09 1.416E-09 9.513E-08 1.836E-08 5.548E-08 4.975E-08
F7 1.167E-08 2.898E-09 2.297E-08 7.552E-05 3.996E-08 2.297E-08
F8 1.416E-09 1.308E-08 1.455E-07 3.344E-07 6.147E-07 1.640E-08
F9 2.572E-09 3.259E-09 1.799E-09 5.544E-08 6.886E-08 1.875E-04
F10 1.367E-03 1.784E-03 2.204E-02 1.115E-03 1.355E-06 3.566E-04
F11 5.212E-09 1.385E-05 3.293E-05 4.541E-07 1.268E-05 4.240E-05
F12 2.454E-07 4.460E-08 8.294E-07 1.416E-09 9.513E-08 2.054E-08
F13 1.115E-06 6.795E-07 5.910E-05 2.297E-08 1.059E-07 6.147E-07
F14 1.115E-06 4.102E-07 1.309E-07 1.230E-06 1.309E-07 2.029E-09
F15 8.294E-07 4.670E-06 1.230E-06 9.513E-08 4.460E-08 1.997E-06
F16 2.454E-07 2.870E-08 2.297E-08 4.460E-08 1.465E-08 1.513E-05
F17 4.460E-08 9.288E-09 6.574E-09 5.618E-06 1.177E-07 6.574E-09
F18 1.167E-08 3.206E-08 2.454E-07 5.559E-07 4.638E-09 3.669E-09
F19 3.994E-08 8.274E-09 3.203E-08 2.211E-07 1.177E-07 6.143E-07
F20 5.123E-06 8.190E-05 1.647E-06 1.160E-05 5.855E-09 6.415E-05
F21 2.870E-08 5.618E-06 1.640E-08 3.213E-06 3.344E-07 8.294E-07
F22 3.994E-08 1.229E-06 2.566E-08 7.504E-07 2.867E-08 2.720E-07
F23 1.416E-09 1.416E-09 1.416E-09 1.416E-09 1.416E-09 1.416E-09
F24 9.280E-09 1.414E-09 1.464E-08 1.464E-08 3.203E-08 1.115E-06
F25 3.256E-09 1.040E-08 2.293E-08 1.797E-09 2.893E-09 2.865E-08
F26 1.800E-09 2.286E-09 1.800E-09 1.309E-07 1.800E-09 1.800E-09
F27 4.704E-08 1.307E-08 4.122E-09 1.414E-09 4.122E-09 1.414E-09
F28 2.574E-09 5.855E-09 1.059E-07 2.870E-08 1.800E-09 2.286E-09
F29 2.284E-09 4.457E-08 2.896E-09 2.211E-07 4.634E-09 2.027E-09
F30 1.597E-09 6.184E-08 1.167E-08 4.126E-09 1.465E-08 9.288E-09
CONCLUSIONS
In this paper, a new ensemble inertia weight strategy is designed by the use of other successful previous inertia weight strategies. In an optimization iteration, different methods calculate their fitness. After, this best fitness valued methods’ particle is utilized by all inertia weight strategies. Thus, obtained best
fitness value is accepted as final output value of this iteration. In order to see performances of the proposed method, experiments are done. In experiments CEC 2017 that has 30 benchmark test functions are used. Independent 25 runs are made with all functions. Proposed method outperforms all other methods in all 30 functions and Wilcoxon rank sum test is proven that differences in performance are statistically significant.
REFERENCES
Ala’raj, M., Abbod, M.F., 2016, “Classifiers Consensus System Approach for Credit Scoring”,
Knowledge-Based Systems, Vol. 104, pp. 89-105, doi:10.1016/j.knosys.2016.04.013
Al-Hassan, W., Fayek, M.B., Shaheen, S.I., “Psosa: An Optimized Particle Swarm Technique for Solving the Urban Planning Problem”, In Computer Engineering and Systems, The 2006 International
Conference on,Cairo, Egypt, pp. 401–405 5-7 Nov. 2006, IEEE, 2007.
Arasomwan, M.A., Adewumi, A.O., 2013, “On the Performance of Linear Decreasing Inertia Weight Particle Swarm Optimization for Global Optimization”, The Scientific World Journal. 2013. Armano, G., Farmani, M.R., 2016, “Multiobjective Clustering Analysis Using Particle Swarm
Optimization”, Expert Systems with Applications, Vol. 55, pp. 184–193, doi:10.1016/j.eswa.2016.02.009
Arumugam, M.S., Rao, MVC., 2006, “On the Performance of the Particle Swarm Optimization Algorithm with Various Inertia Weight Variants for Computing Optimal Control of a Class of Hybrid Systems”, Discrete Dynamics in Nature and Society.
Awad, N. H., Ali, M. Z., Liang, J. J., Qu, B. Y., Suganthan P. N., Problem Definitions and Evaluation Criteria
for the CEC 2017 Special Session and Competition on Single Objective Bound Constrained Real-Parameter Numerical Optimization, Technical Report, Nanyang Technological University,
Singapore, November 2016.
Bansal, J.C., Singh, P.K., Saraswat, M., Verma, A., Jadon, S.S., Abraham, A., 2011, “Inertia Weight Strategies in Particle Swarm Optimization”, In: Proceedings of Third World Congress on Nature
and Biologically Inspired Computing (NaBIC-2011), Salamanca, Spain, pp 633–640, 19-21 October. 2011.
Bharti, K.K., Singh, P.K., 2016, “Opposition Chaotic Fitness Mutation Based Adaptive Inertia Weight BPSO for Feature Selection in Text Clustering”, Applied Soft Computing, Vol. 43, pp. 20-34. Çavdar, T., 2016, “PSO Tuned ANFIS Equalizer Based on Fuzzy C-means Clustering Algorithm”, AEU -
International Journal of Electronics and Communications, Vol. 70(6), pp. 799–807,
doi:10.1016/j.aeue.2016.03.006.
Eberhart, R.C., Shi, Y., “Tracking and Optimizing Dynamic Systems with Particle Swarms”, In
Evolutionary Computation, 2001. Proceedings of the 2001 Congress on, Seoul, South Korea, Vol. 1,
pp. 94–100, 27-30 May 2001.
Feng, Y., Teng, G.F., Wang, A.X., Yao, Y.M., “Chaotic Inertia Weight in Particle Swarm Optimization”, In
Innovative Computing, Information and Control, Kumamoto, Japan, 2007. ICICIC’07. Second International Conference on, page 475, 5-7 September 2007. IEEE, 2008.
Gheisari, S., Meybodi, M.R., 2016, “BNC-PSO: Structure Learning of Bayesian Networks by Particle Swarm Optimization”, Inform Sciences, Vol. 348, pp. 272-89.
Ho, Tin Kam, 1998, “The Random Subspace Method for Constructing Decision Forests”, IEEE
Transactions on Pattern Analysis and Machine Intelligence, Vol. 20 (8), pp. 832–844.
doi:10.1109/34.709601
Kennedy, J., Eberhart, R., “Particle Swarm Optimization”, Proc. IEEE Int. Conf. Neural Netw., 4 (1995), pp. 1942–1948.
Kordestani, J.K., Rezvanian, A., Meybodi, M.R., 2016, “An Efficient Oscillating Inertia Weight of Particle Swarm Optimisation for Tracking Optima in Dynamic Environments”, Journal of Experimental & Theoretical Artificial Intelligence, 2016, Vol. 28(1-2), pp.137-49.
Liang, Y., Leung, K.S, 2011, “Genetic Algorithm with Adaptive Elitist-Population Strategies for Multimodal Function Optimization”, Applied Soft Computing, Vol. 11(2), pp. 2017-34.
Lim, W.H., Isa, NAM., 2014, “An Adaptive two-layer Particle Swarm Optimization with Elitist Learning Strategy”, Information Sciences, Vol. 273, pp. 49-72.
Maca, P., Pech, P., 2015, “The Inertia Weight Updating Strategies in Particle Swarm Optimisation Based on the Beta Distribution”, Mathematical Problems in Engineering.
Nickabadi, A., Ebadzadeh, M.M., Safabakhsh, R., 2011, “A Novel Particle Swarm Optimization Algorithm with Adaptive Inertia Weight” Applied Soft Computing, Vol. 11(4), pp.3658-70. Pluhacek, M., Senkerik, R., Davendra, D., Oplatkova, Z.K., Zelinka, I., 2013, “On the Behavior and
Performance of Chaos Driven PSO Algorithm with Inertia Weight”, Computers & Mathematics
with Applications, Vol. 66(2), pp.122-34.
Rokach, L., 2010, “Ensemble-based Classifiers”, Artificial Intelligence Review, Vol. 33 (1–2), pp.1–39. Shi, Y., Eberhart, R., “A Modified Particle Swarm Optimizer”, In Evolutionary Computation Proceedings,
1998. IEEE World Congress on Computational Intelligence., The 1998 IEEE International Conference on, Anchorage, AK, USA, pp. 69–73, 4-9 May 1998.
Shi, Y.H., Eberhart, R.C., “Fuzzy Adaptive Particle Swarm Optimization”, Proc. of the IEEE Congress on
Evolutionary Computation, Seoul Korea, Vol. 1, pp. 101–106, 27-30 May 2001.
Surjanovic, S., Bingham, D., 2013, Virtual Library of Simulation Experiments: Test Functions and Datasets, Retrieved May 13, 2016, from http://www.sfu.ca/~ssurjano.
Taherkhani, M., Safabakhsh, R., 2016, “A Novel Stability-Based Adaptive Inertia Weight for Particle Swarm Optimization”, Applied Soft Computing, Vol. 38, pp. 281-95.
Uymaz, S.A., Tezel, G., Yel, E., 2015, “Artificial Algae Algorithm (AAA) for Nonlinear Global Optimization”, Applied Soft Computing, Vol. 31, pp. 153-71.
Whitley, D., 1994, “A Genetic Algorithm Tutorial”, Statistics and Computing, Vol. 4, pp. 65-85.
Xiang, Y., Zhou, Y.R., Liu, H.L., 2015, “An Elitism Based Multi-Objective Artificial Bee Colony Algorithm”, European Journal of Operational Research, Vol. 245(1), pp. 168-93.
Xin, J., Chen, G., Hai, Y., “A Particle Swarm Optimizer with Multistage Linearly-Decreasing Inertia Weight”, In Computational Sciences and Optimization, 2009, CSO 2009, International Joint
Conference on, Sanya, Hainan, China, Vol. 1, pp. 505–508,24-26 April 2009.
Xu, G.L., Wan, S.P., Wang, F., Dong, J.Y., Zeng, Y.F., 2016, “Mathematical Programming Methods for Consistency and Consensus in Group Decision Making with Intuitionistic Fuzzy Preference Relations”, Knowledge-Based Systems, Vol. 98, pp.30-43.
Zang, W., Zhang, P., Zhou, C., Guo, L., 2014, “Comparative Study Between Incremental and Ensemble Learning on Data Streams: Case Study”, Journal of Big Data, Vol. 1 (1), pp.1–16.
Zhang, L.M., Tang. Y.G., Hua, C.C., Guan, X.P., 2015, “A New Particle Swarm Optimization Algorithm with Adaptive Inertia Weight based on Bayesian Techniques”, Applied Soft Computing, Vol. 28, pp. 138-49.