Abstract
This study is the first to analyze performance of Taiwanese domestic equity funds between January 2009 and October 2014, the period during which quantitative redirected capital flows to-ward developing economies and the Taiwanese Stock Exchange Weighted Index compounded at approximately 12.9% annually. Adopting methods endorsed by earlier research, we evaluated 15 Taiwanese equity funds’ performance relative to market aver-ages using the Sharpe (1966) and Treynor (1965) ratios and Jensen’s alpha method (1968). To test market timing proficiency, we applied the Treynor and Mazuy (1966) and Henriksson and Merton (1981) regression analysis methods. Jensen’s alpha method (1968) was used to measure fund managers’ stock se-lection skills. Results revealed that funds significantly under-per-formed Taiwan’s average annual market return and demon-strated no exceptional stock-selection skills and market timing proficiency during the era of quantitative easing.
Keywords: Performance evaluation, Quantitative easing, Equity funds, Sharpe ratio, Jensen’s alpha.
JEL Classification Codes: G11, F39
1. Introduction
Mutual fund performance has always been one of the most researched areas of finance studies. Using diverse technical measurement methods, these types of studies analyze fund per-formances of various markets from different perspectives. Especially, after the period of liberalization of the financial mar-kets, mutual funds have gained much more importance among investors, resulting in numerous studies that have been carried out on performance evaluations. According to Deepak (2011), in-vestors invest their money into capital market instruments such as shares, debentures and other securities. The returns from
in-* Department of Economics, Faculty of Economics, Administrative and Social Sciences, MEF University, Istanbul, [Address: Ayaza a Cad. No.4ğ 34396 Maslak - Sarıyer - Istanbul Turkey. Tel: (+90 212) 395-3610. E-mail: [email protected] and [email protected]]
vestments are equally shared among shareholders according to their investment ratio. Hence, mutual funds are proper invest-ment and provide the chance to invest different professionally managed financial instruments. According to Rao (2006), diversi-fication of the risk is the main objective of investing in a mutual fund. Diversified portfolios are created by mutual fund invest-ments and fund managers take different levels of risks in order to get maximum value from their investments. Therefore, when comparing and evaluating the investments, returns are measured by taking into account the risks involved in achieving the returns.
The 2008 global crisis devastated the U.S. and European economies and financial markets. During the ensuing recession, significant investment banks collapsed (e.g., Lehman Brothers) and commercial banking crises notably enveloped Portugal, Ireland, Spain, Greece, and Italy. To combat recession, the U.S. Federal Reserve initiated quantitative easing (QE) between December 2008 and October 2014, purchasing huge quantities of sovereign debt to swell the money supply. Its actions were paralleled by central banks globally. QE occurred in four seg-ments: QE1 (December 2008 June 2010), QE2 (November 2010– June 2011), QE3 (September 2012 October 2014), and QE4
– –
(January 2013 October 2014) (Amadeo, 2015).–
<Figure 1> Performances of Taiwanese Stock Exchange (January 2009-November 2014)
As recession, market disarray, and QE eroded confidence in
Print ISSN: 2288-4637 / Online ISSN 2288-4645 doi: 10.13106/jafeb.2015.vol2.no4.5.
Performance of Taiwanese Domestic Equity Funds during Quantitative Easing
1)
Ömer Faruk Tan*
the U.S. and European markets, investors gravitated toward equity markets in developing economies, including Taiwan. The Taiwan Stock Exchange Weighted Index (TWSE) averaged 12.9% annual growth (Figure 1), outstripping developed market indices notably the DAX, FTSE 100, and CAC 40, which aver— -aged 12.1%, 6.8%, and 4.1% returns, respectively. Only the S&P500 outperformed the TWSE with 15.1% returns. This study analyzes Taiwanese equity fund performance across the entire QE era.
2. Literature Review
Especially following the liberalization of financial markets, mu-tual funds have gained importance among investors seeking pro-fessional management and diversification of risks. Treynor (1965), Sharpe (1966) and Jensen (1968) are among those who measure fund performance related to risk and return measurements. Sharpe (1966) measured 34 open-ended mutual funds between 1954-1963 using the Sharpe ratio and Treynor ratio. As the result of the study, it has been found out that while 11 funds out of 34 show a better performance than the index, 23 funds under perform their benchmarks. Jensen (1968) examined 115 mutual funds - which were active between 1945-1964 – by using an alpha indicator that he generated. His alpha indicator shows the selectivity skills of fund managers. Based on his results, funds could not outperform the market performance, revealing that mutual fund managers, in general, did not have selective ability.
Malkiel (1995) used the Jensen method to calculate the per-formance of American funds between the years 1972 and 1990. He revealed that mutual funds could not show positive excess return. Detzler (1999) searched 19 global bond funds by using monthly returns between the years 1985 and 1995. In the study, a multiple regression analysis was used and it was found out that funds could not show better performance than indexes. Dahlquist, Engström and Söderlind (2000) evaluated 201 Swedish mutual funds – including only domestic funds - from the period between 1993 and 1997. They found that regular equity funds seemed to over perform while bond and money market funds performed less. Furthermore, actively managed funds demonstrated better performance than passively managed funds.
With the aim of detecting the market timing ability of the fund managers, Treynor and Mazuy (1966) established the quadratic regression analysis method. They applied this method to 57 open-end mutual funds (25 growth funds and 32 balanced funds). They revealed only a single fund as having statistically significant market timing ability. Henriksson and Merton (1981) and Henriksson (1984) developed both parametric and non-parametric statistical models to the test market timing ability of portfolios. Having been introduced by Henriksson and Merton (1981), the parametric and non-parametric tests in question were applied by Henriksson (1984) to evaluate the market timing abil-ity of 116 open-end funds between 1968 and 1980 in the U.S.
market. The results revealed that there wasn’t any support for market timing ability. Moreover, Henriksson (1984) found an in-verse relationship between selection ability and market timing ability.
Chang and Lewellen (1984) tested the market timing ability of 67 U.S. funds covering the period from 1971 to 1979 by using the Henriksson and Merton (1981) method. It was found that there were weak indications of fund manager market timing ability. Gallo and Swanson (1996) tested 37 U.S. mutual funds by using the Treynor and Mazuy (1966) model for market tim-ing, yet found no evidence of market timing of funds. Christensen (2005) evaluated 47 Danish funds between January 1996 and June 2003. He found that fund managers did not have selectivity skills in general and, in terms of timing ability, the results were also negative, due to the fact that only two funds had significant timing ability.
In Taiwan, Hsu et al. (2012) analyzed the performance and performance persistency of 30 Taiwan open-end equity funds using the Sharpe ratio, the Treynor ratio, and the SRAROC, ERAROC, GRAROC and HRAROC models. Their statistical re-sults indicate that examined funds generated positive returns during bull markets and negative returns during bear markets. Hou (2012) investigated performance persistence and investor timing of 200 Taiwanese domestic equity mutual funds between 1996 and 2009 and showed that investors’ timing skills lated negatively to fund performance. Furthermore, timing corre-lated significantly and negatively for length of history, fund size, and momentum-style funds, but it correlated positively for val-ue-style funds.
3. Methodology
3.1. Methodology
Adopting methods from earlier research, this study evaluated performance of 15 Taiwanese domestic equity funds using the Sharpe (1966) and Treynor (1965) ratios and Jensen’s alpha (1968), which measures fund managers’ stock selection skills. To test market timing proficiency, we applied the Treynor and Mazuy (1966) and Henriksson and Merton (1981) regression models.
3.1.1. Treynor Ratio
According to Koulis et al. (2011), Treynor’s ratio (Treynor, 1965) is the first measure of mutual fund performance. It is cal-culated as a fund’s excess return divided by its beta (systematic risk) and is defined as
Ti = (Rp-Rf)/P (1)
where
Ti = Treynor’s performance index Rp= portfolio’s period-specific return Rf= risk-free return in a period
3.1.2. Sharpe Ratio
The Sharpe technique finalized in 1966 resembles Treynor’s ratio (Noulas, Papanastatiou & Lazaridis, 2005), but it employs the standard deviation of fund returns in its denominator instead of portfolio beta. It computes the premium earned per unit of to-tal risk. The Sharpe value is calculated as
Sp=(Rp –Rf/) p, (2)
where
Sp= Sharpe Ratio
Rp= a fund’s average rate of return Rf= average risk-free return
p= standard deviation of fund returns.
The Sharpe ratio (Sp) calculates performance for an identified level of total risk. Higher values indicate higher performance (Duggimpudi, Abdou & Zaki, 2010).
3.1.3. Jensen’s Alpha
"A portfolio manager’s predictive ability (is) his ability to earn returns through the successful forecast of security prices that are higher than those which we could presume given the level of his riskiness of his portfolio" (Jensen, 1968, p. 389).
Jensen’s model can be written as
Rpt – Rft = p + p (Rmt Rft) + ept– (3)
p=return on the portfolio adjusted for market returns (i.e.,
excess returns)
Rpt= returnon portfolio p at time t Rft=return on a riskless asset at time t Rmt= return on the market portfolio at time t
p=sensitivity of excess returns of portfolio t to excess
mar-ket returns (i.e., above-average marmar-ket returns).
The sign of alpha displays whether a portfolio manager out-performs the market after adjusting for risk. A positive (negative) alpha denotes above-market (below-market) performance (Mayo, 2010).
3.1.4. Treynor and Mazuy Regression Analysis
Fund managers may out-perform markets if they reconfigure their portfolios promptly and competently when markets rise or fall. That is, they adjust their portfolios from more to less vola-tile securities when they expect the market to drop and adjust in the opposite direction if they expect it to climb (Treynor & Mazuy, 1966). Also, fund managers may hold a greater (lesser) proportion of the market portfolio if they anticipate a bull market (bear market). Treynor and Mazuy (1966) developed the follow-ing model to evaluate market-timfollow-ing proficiency:
(4) where i is the timing-adjusted alpha, which represents manag-ers’ timing-adjusted stock-selection ability. The quadratic term in Equation (4) is the market-timing factor. The coefficient of the mar-ket-timing factor ( ) represents managers’ market timing proficiency. If is positive, they have superior proficiency i.e.,— their portfolios are adjusted actively to well-anticipated changes in markets; if negative, timing proficiency is poor (Chen et al., 2013).
3.1.5. Henriksson and Merton Regression Analysis
Another return-based measure of timing proficiency, Henriksson and Merton (1981) regression strongly resembles Treynor and Mazuy (1966) regression. It computes whether managers’ return on assets exceeds or lags the risk-free rate after selecting a lev-el of risk that reflects their expectation the market will produce positive excess returns (Cesari & Panetta, 2002). The formula is:
Rit-Rft = i + i0 (Rmt Rft) +– i[D (Rmt – Rft)] + (5)
When Rmt>Rft (up market), D = 1, and when Rmt<Rft, D = 0. We can rewrite the formula as
Rmt>RftRit-Rft = i + i (Rmt Rft) +– i1 +
Rmt<RftRit-Rft = i + i (Rmt Rft) +–
4. Data
It is analyzed 15 Taiwanese domestic equity funds using the measures indicated above. The examined period spans the en-tire era of QE (between January 2009 and October 2014) dur-ing which we observed weekly fund returns for 304 weeks. All data are from the Thomson Reuters Data Stream.
4.1. Selection of Equity Funds
According to data of Securities Investment Trust & Consulting Association of the R.O.C, there are totally 648 funds in Taiwan. Among 648 Taiwan-based mutual funds — including equity, bal -anced, bond, and other funds — we initially considered only Taiwan’s 342 equity funds (154 domestic and 188 international funds). The sample is culled in order to analyze only perform-ance of funds invested in domestic Taiwanese companies. We excluded funds that were closed, newly established, or merged with another fund. Also, funds whose size exceeded NT$1 bil-lion were preferred. For final analysis, we selected 15 funds ranked by size (Table 2).
<Table 1> Number of Mutual Funds in Taiwan (11/2014)
Fund Type of FundsNumber Fund Size (TWD) Domestic Equity Fund 154 236,513,903,656 International Equity Fund 188 299,792,140,133 Subtotal 342 536,306,043,789 Domestic Balanced Fund 25 24,000,371,944 International Balanced Fund 19 44,005,548,190 Subtotal 44 68,005,920,134 Domestic Fixed-Income Fund 1 3,395,610,670 International Fixed-Income Fund 48 74,299,055,958 Financial Asset Securitization Fund 1 330,858,019
High Yield Bond Fund 36 213,513,922,137 Subtotal 86 291,539,446,784 Domestic Money Market Fund 45 844,039,623,010
Source: This table is taken from
http://www.sitca.org.tw/ENG/FundInf/FI2001.aspx?PGMID=FI2001
4.2. Returns on Funds
Logarithmic returns of funds were computed over weekly price indices of funds. For the study, 304 weeks of data between January 9, 2009 and October 31, 2014 are used.
Rp= ln (Pt /Pt-1) (6)
where
Rp= return on the fund Pt= price of the fund at week t Pt-1 = price of the fund at week t-1
4.3. Benchmark
In this study, the Taiwanese Stock Exchange (Táiwān Zhèngquàn Jiāoyì Suǒ) price index is used in order to find whether equity funds surpass the market.
Rm= ln (Pmt / Pmt-1) (7)
where
Rm = returns on the TWSE
Pmt= value of the TWSE Price Index on week t Pmt-1 = value of the TWSE Price Index on week t-1
4.4. Risk-free Rate
In this study, the Taiwan 1-month deposit rate is used as a proxy sourced from Thomson Reuters Data Stream. Hou (2012) used the 1-month deposit rate in his previous study.
5. Empirical Results
Descriptive statistics of Taiwanese equity funds, benchmarks, and risk-free rates appear in Table 3. The Average column in-dicates returns on funds, benchmarks, and risk-free rates. Average returns for Allianz Global Investors Taiwan Fund, Capital OTC Fund, Cathay Fund, Franklin Templeton Sino Am First Fund, FuhHwa High Growth Fund, Nomura Taiwan Superior Equity Fund, Pine Bridge Taiwan Giant Fund, Prudential Financial High Growth Fund, Sino Pac Fund, and UPAMC All Weather Fund surpassed returns on the TWSE dur-ing the period. Taiwanese funds, in general, performed better during QE.
The Skew column displays the skew of equity funds and cor-responding values of their benchmarks. All funds, benchmarks, and one-month deposit rates are negatively skewed. All fund-sand benchmarks have positive kurtosis, which imply typical heavy tailed financial distributions. The risk-free rate exhibits negative kurtosis, implying a relatively flat distribution. The R column shows correlations between funds and benchmarks. The average correlation (0.89363) is strongly positive. HSBC Taiwan Phoenix Fund has the highest correlation (0.97244) and Pine Bridge Taiwan Giant Fund the lowest (0.82290). The Standard Deviation column shows the volatility of equity funds, bench-marks, and risk-free rates. Other than Yuanta Excellence Equity Fund and the HSBC Taiwan Phoenix Fund, all funds were more
International Money Market Fund 8 20,082,371,419 Subtotal 53 864,121,994,429 International Fund of Funds
-Equity Fund 12 16,188,050,867 International Fund of Funds - Bond
Fund 29 63,589,651,139
International Fund of Funds
-Balanced Fund 25 61,109,177,448 International Fund of Funds
-Others 3 1,085,505,565
Subtotal 69 141,972,385,019 Principal Guaranteed Fund 8 15,311,030,102
Subtotal 8 15,311,030,102 REITs Fund 12 18,076,128,516 Subtotal 12 18,076,128,516 Domestic Exchange Traded Fund 17 87,946,111,084
International Exchange Traded
Fund 6 58,991,302,828
Subtotal 23 146,937,413,912 Domestic Index Fund 3 3,139,209,198 International Index Fund 8 8,215,133,356 Total 648 2,093,624,705,239
<Table 2> Taiwanese Equity Funds (31/10/2014)
Fund Name (Taiwan Dollar)Fund Size Prudential Financial High Growth Fund 5,035,760,502
Yuanta Excellence Equity Fund 4,234,062,291 Capital OTC Fund 4,075,238,940 Cathay Cathay Fund 3,775,418,346 Nomura Taiwan Superior Equity Fund 3,111,796,660 HSBC TAIWAN Phoneix Fund 3,101,802,898 Allianz Global Investors Taiwan Fund 3,057,852,230 SinoPac Fund 2,862,141,013 FuhHwa High Growth Fund 2,725,794,332 UPAMC All Weather Fund 2,242,865,487 JPMorgan (Taiwan) Growth Fund 1,870,231,510 PineBridge TAIWAN Giant Fund 1,867,370,812 Fidelity Taiwan Growth Fund 1,577,841,479 Franklin Templeton SinoAm First Fund 1,460.418,340 Jih Sun Fund 1,207,041,244
volatile than the TWSE, indicating higher risk.
The last column displays betas, a measure of funds’ system-atic risk. Four funds’ betas exceed 1, and betas for all other funds are near 1, indicating Taiwanese funds carry higher or similar risk compared to the benchmark TWSE index.
<Table 3> Descriptive Statistics of Taiwanese Funds
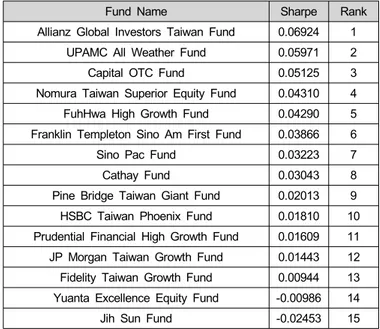
Table 4 shows performance of the Sharpe ratio. Higher val-ues imply better performance. Allianz Global Investors Taiwan Fund, UPAMC All Weather Fund, and Capital OTC Fund display the highest Sharpe ratios. Yuanta Excellence Equity Fund, Jih Sun Fund, and Fidelity Taiwan Growth Fund display the lowest. Except Jih Sun Fund and Yuanta Excellence Equity Funds, all
other funds have positive Sharpe ratio.
Table 5 shows performance of the Treynor ratio. Funds with higher Treynor ratios produced better risk-adjusted returns than funds with lower ratios. Allianz Global Investors Taiwan Fund, UPAMC All Weather Fund, and Capital OTC Fund have the highest Treynor ratios. Yuanta Excellence Equity Fund, Jih Sun Fund, and Fidelity Taiwan Growth Fund have the lowest. Except Yuanta Excellence Equity Fund and Jih Sun Fund, all other funds have positive Treynor ratio as Sharpe ratio.
Fund Name Average Skew Kurtosis R Std.dev. Beta Allianz Global Investors Taiwan Fund 0.00362 -0.32967 1.20099 0.88095 0.02630 0.95932 Capital OTC Fund 0.00335 -0.15718 0.80151 0.82560 0.03028 1.03662 Cathay Fund 0.00255 -0.40223 1.25657 0.89871 0.02493 0.92920 Fidelity Taiwan Growth Fund 0.00204 -0.36467 2.80054 0.96835 0.02583 1.03573 Franklin Templeton Sino Am First Fund 0.00279 -0.29577 1.38435 0.90420 0.02570 0.96399 FuhHwa High Growth Fund 0.00290 -0.48026 1.07085 0.87521 0.02577 0.93420 HSBC Taiwan Phoenix Fund 0.00219 -0.57284 1.59019 0.97244 0.02207 0.88905 Jih Sun Fund 0.00111 -0.47466 1.31417 0.83715 0.02801 0.97230
JP Morgan Taiwan Growth Fund 0.00219 -0.20729 2.14453 0.94898 0.02729 1.07196 Nomura Taiwan Superior Equity Fund 0.00301 -0.36154 1.84144 0.86739 0.02811 1.01002 Pine Bridge Taiwan Giant Fund 0.00236 -0.45159 0.77791 0.82290 0.02802 0.95610 Prudential Financial High Growth Fund 0.00221 -0.4307 0.86042 0.88799 0.02569 0.94580 Sino Pac Fund 0.00260 -0.16078 1.77973 0.92220 0.02492 0.95288
UPAMC All Weather Fund 0.00349 -0.32086 0.93728 0.84719 0.02836 0.99567 Yuanta Excellence Equity Fund 0.00156 -0.51848 1.62461 0.94525 0.02354 0.92230 Taiwanese Stock Exchange (TWSE) 0.00220 -0.35912 1.82517 0.02413 1-Month Deposit Rate 0.00180 -0.89315 -0.90678 0.00054
<Table 4> Results of the Sharpe Ratio for Taiwan
Fund Name Sharpe Rank
Allianz Global Investors Taiwan Fund 0.06924 1 UPAMC All Weather Fund 0.05971 2 Capital OTC Fund 0.05125 3 Nomura Taiwan Superior Equity Fund 0.04310 4 FuhHwa High Growth Fund 0.04290 5 Franklin Templeton Sino Am First Fund 0.03866 6 Sino Pac Fund 0.03223 7 Cathay Fund 0.03043 8 Pine Bridge Taiwan Giant Fund 0.02013 9 HSBC Taiwan Phoenix Fund 0.01810 10 Prudential Financial High Growth Fund 0.01609 11 JP Morgan Taiwan Growth Fund 0.01443 12 Fidelity Taiwan Growth Fund 0.00944 13 Yuanta Excellence Equity Fund -0.00986 14 Jih Sun Fund -0.02453 15
<Table 5> Results of the Treynor Ratio for Taiwan
Fund Name Treynor Rank Allianz Global Investors Taiwan Fund 0.00190 1
UPAMC All Weather Fund 0.00170 2 Capital OTC Fund 0.00150 3 Nomura Taiwan Superior Equity Fund 0.00120 4 FuhHwa High Growth Fund 0.00118 5 Franklin Templeton Sino Am First Fund 0.00103 6 Sino Pac Fund 0.00084 7 Cathay Fund 0.00082 8 Pine Bridge Taiwan Giant Fund 0.00059 9 HSBC Taiwan Phoenix Fund 0.00045 10 Prudential Financial High Growth Fund 0.00044 11 JP Morgan Taiwan Growth Fund 0.00037 12 Fidelity Taiwan Growth Fund 0.00024 13 Yuanta Excellence Equity Fund -0.00025 14 Jih Sun Fund -0.00071 15
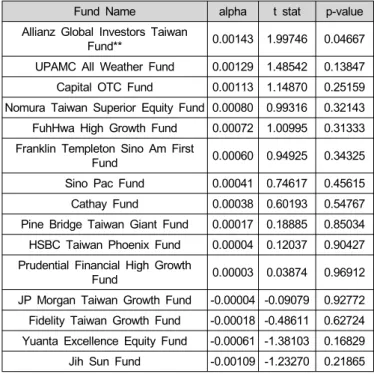
Table 6 presents Jensen’s alphas, which measure manag-ers’stock-selection skills relative to the market. Although 11 of the 15 funds have positive alphas, only Allianz Global Investors Taiwan Fund is positive and statistically significant at 5%. Four funds have negative alphas, all statistically insignificant. Taiwanese equity funds did not demonstrate exceptional stock-selection skills during the period.
<Table 6> Results of Jensen's alpha for Taiwan
Fund Name alpha t stat p-value Allianz Global Investors Taiwan
Fund** 0.00143 1.99746 0.04667 UPAMC All Weather Fund 0.00129 1.48542 0.13847 Capital OTC Fund 0.00113 1.14870 0.25159 Nomura Taiwan Superior Equity Fund 0.00080 0.99316 0.32143 FuhHwa High Growth Fund 0.00072 1.00995 0.31333 Franklin Templeton Sino Am First
Fund 0.00060 0.94925 0.34325 Sino Pac Fund 0.00041 0.74617 0.45615 Cathay Fund 0.00038 0.60193 0.54767 Pine Bridge Taiwan Giant Fund 0.00017 0.18885 0.85034 HSBC Taiwan Phoenix Fund 0.00004 0.12037 0.90427 Prudential Financial High Growth
Fund 0.00003 0.03874 0.96912 JP Morgan Taiwan Growth Fund -0.00004 -0.09079 0.92772 Fidelity Taiwan Growth Fund -0.00018 -0.48611 0.62724 Yuanta Excellence Equity Fund -0.00061 -1.38103 0.16829 Jih Sun Fund -0.00109 -1.23270 0.21865 Significance levels: * indicates 10%, ** indicates 5%, *** indicates 1%
Table 7 displays the results of the Treynor and Mazuy (1966) analysis of managers’market timing proficiency. Only Sino Pac Fund and JP Morgan Taiwan Growth Fund demonstrate such proficiency during the period; however, both are statistically insignificant. Results for the remaining 13 funds are negative and statistically insignificant. HSBC Taiwan Phoenix is statisti-cally significant at 1%, whereas Yuanta Excellence Equity Fund, FuhHwa High Growth Fund, and Prudential Financial High Growth Fund are statistically significant at 5%. Nomura Taiwan Superior Equity Fund and Jih Sun Fund are statistically sig-nificant at 10%. Analysis indicates Taiwanese fund managers lacked market timing proficiency during the period.
Significance levels: * indicates 10%, ** indicates 5%, *** indicates 1%
Table 8 shows results of Hendriksson and Merton (1981) analysis, another measure of market timing proficiency — i.e., whether managers can forecast markets well enough to surpass the risk-free rate. Only two funds show proficiency, but results are statistically insignificant. 13 funds have negative market tim-ing proficiency, but only results for HSBC Taiwan Phoenix Fund are statistically significant at 10%.
<Table 8> Results of the Henriksson and Merton Regression Analysis for Taiwan
Fund Name H & M t-stat p-value JP Morgan Taiwan Growth Fund 0.00585 0.16159 0.87174 Sino Pac Fund 0.00578 0.14249 0.88679 Allianz Global Investors Taiwan
Fund -0.00787 -0.15037 0.88058 Franklin Templeton Sino Am First
Fund -0.02572 -0.55723 0.57779 Cathay Fund -0.03028 -0.65867 0.51061 Fidelity Taiwan Growth Fund -0.03029 -1.11832 0.26432 UPAMC All Weather Fund -0.03294 -0.51975 0.60362 Yuanta Excellence Equity Fund -0.03704 -1.14855 0.25165 Prudential Financial High Growth
Fund -0.03718 -0.74861 0.45467 Pine Bridge Taiwan Giant Fund -0.03878 -0.57932 0.56281 HSBC Taiwan Phoenix Fund* -0.04159 -1.93677 0.05371 Nomura Taiwan Superior Equity
Fund -0.04267 -0.72554 0.46868 Capital OTC Fund -0.04507 -0.62736 0.53089 FuhHwa High Growth Fund -0.06692 -1.27959 0.20167 Jih Sun Fund -0.06998 -1.08756 0.27766 Significance levels: * indicates 10%, ** indicates 5%, *** indicates 1% <Table 7> Results of the Treynor & Mazuy Regression Analysis for
Taiwan
Fund Name T & M t-stat p-value Sino Pac Fund 0.35304 0.72196 0.47088 JP Morgan Taiwan Growth Fund 0.18468 0.42237 0.67305 Allianz Global Investors Taiwan Fund -0.04179 -0.06614 0.94731 Fıdelity Taiwan Growth Fund -0.37980 -1.16181 0.24623
Franklin Templeton Sino Am First
Fund -0.46129 -0.82843 0.40808 UPAMC All Weather Fund -0.60749 -0.79467 0.42743 Cathay Fund -0.70434 -1.27174 0.20445 Yuanta Excellence Equity Fund** -0.82547 -2.13207 0.03381 Capital OTC Fund -0.87197 -1.00652 0.31497 HSBC Taiwan Phoenix Fund*** -1.00656 -3.95870 0.00009 Pine Bridge Taiwan Giant Fund -1.05572 -1.30948 0.19137 Prudential Financial High Growth
Fund** -1.19875 -2.01108 0.04521 FuhHwa High Growth Fund** -1.24855 -1.98527 0.04802 Nomura Taiwan Superior Equity Fund* -1.32120 -1.87044 0.06239 Jih Sun Fund** -1.72785 -2.23871 0.02590
6. Conclusion
This study the first to rate Taiwanese mutual funds during— the era of quantitative easing examined the performance of 15— Taiwanese domestic equity funds from January 2009 to October 2014. During that period, Taiwan’s stock market index out-performed all developed market indexes except the S&P 500. It is measured performance using the Sharpe ratio (1966), Treynor ratio (1965), Jensen alpha (1968), Treynor and Mazuy (1966) analysis, and Henriksson and Merton (1981) analysis. Sharpe (1966) and Treynor (1965) ratios, which measure risk-adjusted performance, indicated similar rankings for all mutual funds. Allianz Global Investors Taiwan Fund, UPAMC All Weather Fund, Capital OTC Fund have the highest ratios for both. The Jensen’s alpha (1968), Treynor and Mazuy (1966) and Henriksson and Merton (1981) analyses determined stock-se-lection skills and market timing proficiency, respectively. In this work, it is revealed that in the era of quantitative easing, al-though the financial market in Taiwan made an incredible prog-ress, Taiwanese fund managers could not exhibit a good per-formance both in selectivity skills and market timing abilities. Jensen (1968) alph as indicated that over this period fund man-agers did not have selective ability, only 1 of the 15 funds had statistically significant positive alpha. Furthermore, Treynor and Mazuy (1966) and Henriksson and Merton (1981) regression analysis show that over the same period fund managers did not also have market timing ability, as none of the 15 funds had statistically significant positive coefficients. It can be deduced that Taiwanese fund managers had neither selective ability nor market timing ability during the quantitative easing era. At the end of this study, along with the outcomes, it is observed sim-ilarities with the results of earlier studies in literature. Future studies should expand upon these findings using persistence analysis.
References
Amadeo, K. (2015, February 1). What is quantitative easing? Definition and explanation. About News. Retrieved September 30, 2015 from
http://useconomy.about.com/od/glossary/g/Quantitative-Easing.htm. Cesari, R., & Panetta, F. (2002). The performance of Italian
equi-ty funds. Journal of Banking and Finance, 26(1), 99-126. Chang, E., & Lewellen, W. (1984). Market timing and mutual
funds investment performance. Journal of Business, 57(1), 57-72.
Chen, D., Gan. C., & Hu, B. (2013). An empirical study of mu-tual funds performance in China. Social Science Research Network. Available at SSRN: http://ssrn.com/ab-strat=2220323.
Christensen, M. (2005). Danish mutual fund performance; Selectivity, market timing and persistence. Aarhus School of Business, Finance Research Group Working Paper No. F-2005-1. Available at SSRN :http://ssrn.com/abstract=670701
Dahlquist, M., Engström, S., & Söderlind, P. (2000). Performance and characteristics of Swedish mutual funds. Journal of Financial and Quantitative Analysis, 35, 409-423.
Deepak, A. (2011). Measuring performance of Indian mutual funds. Finance India. Available at SSRN: http://ssrn.com/ab-stract=1311761.
Detzler, M.L. (1999). Performance of global bond mutual funds. Journal of Banking & Finance, 23(8), 1195-1217. Duggimpudi R.R., Abdou, H.A., & Zaki, M. (2010). An
inves-tigation of equity diversified mutual funds: The case of Indian market. Investment Management and Financial Innovations, 7(4), 77-84.
Gallo, J.G., & Swanson, P.E. (1996). Comparative measures of performance for U.S. based international equity mutual– funds.Journal of Banking & Finance, 20(10), 1635-1650. Henriksson, R.D. (1984). Market timing and mutual fund per-formance: An empirical investigation. Journal of Business, 57(1), 73-96.
Henriksson, R.D., & Merton, R.C. (1981). On market timing and investment performance. II. Statistical procedures for evaluating forecasting skills. The Journal of Business, 54(4), 513-533.
Hsu, L. C., Ou, S. L., Yang, C. C., & Ou, Y. C. (2012). How to choose mutual funds that perform well? Evidence from Taiwan. International Journal of Economics and Finance, 4(1), 247-259.
Hou, T.C.T. (2012). Return persistence and investment timing decisions in Taiwanese domestic equity mutual funds. Managerial Finance, 38(9), 873-891.
Jensen, M.C. (1968). The performance of mutual funds in the period 1945-1964. Journal of Finance, 23(2), 389-416. Koulis, A., Beneki, C., Adam, M., & Botsaris, C. (2011). An
as-sessment of the performance of Greek mutual equity funds selectivity and market timing. Applied Mathematics Sciences, 5(4), 159-171.
Malkiel, B.G. (1995). Returns from investing in equity funds: 1971-1991.Journal of Finance, 50(2), 549-572.
Mayo, H.B. (2010). Investment: An Introduction (10th Edition).
South-Western Cengage Learning, Mason, USA.
Noulas, G., Papanastatiou, J. A., & Lazaridis, J. (2005). Performance of mutual funds. Managerial Finance, 31(2), 101-112.
Rao, D.N. (2006). Investment styles and performance of equity mutual funds in India. Social Sciences Research Network. Available at SSRN: http://ssrn.com/ab-stract=922595 or http://dx.doi.org/10.2139/ssrn.922595. Sharpe, W.F. (1966). Mutual fund performance. The Journal of
Business, 39(1), 119-138.
SITCA fund information Taiwanese funds. (2015, February 2015). Retrieved September 30, 2015 from http://www.sit-ca.org.tw/ENG/FundInf/FI2001.aspx?PGMID=FI2001. Treynor, J.L. (1965). How to rate management of investment
funds.Harvard Business Review. 43(1), 63-75.
Treynor, J.L., & Mazuy, K.K. (1966). Can mutual funds outguess the market?Harvard Business Review, 44, 131-136.