1
Ecological Implication of Offshored economic activities in Turkey: Foreign Direct Investment Perspective
Edmund Ntom UDEMBA
Faculty of Economics Administrative and Social sciences, Istanbul Gelisim University, Istanbul, Turkey Correspondence: Email: [email protected];
[email protected]; [email protected].
Tel: +905357808713
WhatsApp: +2347039678122; +905357808713 Funding
The author hereby declares that there is no form of funding received for this study.
Compliance with Ethical Standards
The author wishes to disclose here that there are no potential conflicts of interest at any level of this study.
Graphical Abstract
The graphical abstract below is a display of Author’s findings are as the follow: A positive relationship between economic performance (GDP per capita) and ecological footprint. Also, a positive relationship is established amongst foreign offshored economic activities (FDI), energy use and ecological footprint which shows that both energy use and foreign offshored economic activities are positively related to the ecology (This relationship is shown on the graph with red
colored arrows moving from independent variables to the dependent variable). From granger
causality method author found a feedback causal transmission between FDI and the ecological footprint, and a one-way causal relationship passing from energy use to ecological footprint (This
relationship is shown with blue arrows showing either two ways transmission for the case of FDI and ecology or one-way transmission for the case of energy use to ecology).
2 Abstract
Turkish place in industrial activities is strategic, and its involvement in oil and gas importation because of high energy utilization in manufacturing sector is susceptible to high emission. For this, it is required that the economy be researched towards its involvement in both emission inducement and abatement globally.Author adopts ecological footprint and offshored economic activities as proxies to both environment and Foreign Direct Investment (FDI) in ascertainment of Turkish involvement in global emission and decarbonization. Structural break analysis, ARDL-Bound testing and granger causality were utilized for effectively analysis of the offshore implication of environmental performance in Turkey. Author’s findings are as the follow: A positive relationship between economic performance (GDP per capita) and ecological footprint, hence, giving credence to growth induced pollution. Also, a positive relationship is established amongst foreign offshored economic activities (FDI), energy use and ecological footprint which shows that both energy use and foreign offshored economic activities are positively related to the ecology which established unfavorable impact on the environment. This supports the pollution haven hypothesis (PHH)
Ecological
Footprint
Offshored economic
activitities{FDI}
Energy use
Economic
growth[GDP
]
3
which is among the theoretical backgrounds of this study. Among the findings established in this study is from granger causality method which supports the pollution haven hypothesis. They are; a feedback causal transmission between FDI and the ecological footprint, and a one-way of causal relationship passing from energy use to ecological footprint. With these findings, it can be said that the environmental implication of foreign offshored economic activities in Turkey is unfavorable. Policy implication of Turkey should be towards moderation of economic growth and the activities of foreign investors for sustainable energy, environment and growth.
Keywords: Ecological footprint; offshored economic activities; FDI; energy use; GDP, ARDL;
Turkey
JEL Codes: C32, C33, Q43, Q58
1. Introduction
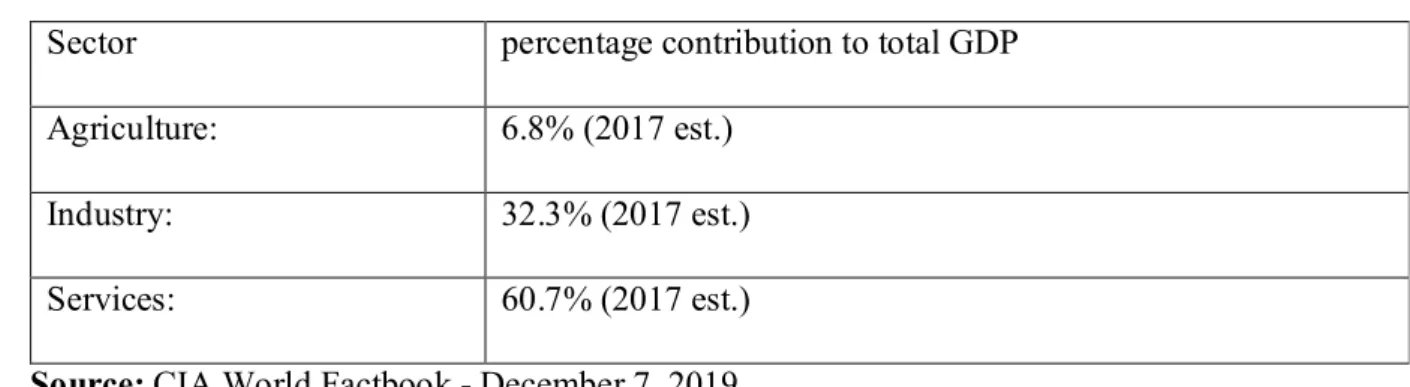
The global environmental performance remains a concern and phenomenal issue in the current time. The speed of global economic performance in the areas of growth and development has contributed immensely in impacting the global atmospheric condition. Dong et al., (2018) rightly put it as the global experience of economic growth because of rural-urban movement and industrialization. The excessive economic activities that are geared towards economic growth and development has led to exposing of nations of the world to climate change and global warming (Destek and Sarkodie, 2019; Khan and Ulucak, 2020). The alteration of the temperature because of the economic performance which gives rise to global warming has cost implication to the ecosystem and this impact negatively to human lives, aquatic life and agricultural products. Turkey is among the emerging countries with upward trend in economic growth via industrial and manufacturing inputs which impact both its economic performance and environmental state. According to Turkish statistical institute (Turkstat,2019), the country’s growth rate was marked at 0.9% in 2019 despite the sharp slide of the economic growth of Turkey in the middle of the second quarter. Turkey’s gross domestic product (GDP) on the basis of current price was marked at 4.29 trillion Turkish lira. It was revealed by Turkstat, 2019 that real GDP per capita climaxed to 51,834 Turkish liras (equivalent to $9,127) in 2019 in current price basis. From the reference point of sectors, the rise in economic growth is recorded at 3.3%, 1.5% and 0.2% respectively for agricultural sector, service sector and industrial sectors. The performance of Turkish economy by sectors is presented here in a table form as follow:
4
Table 1. GDP - composition by sector
Sector percentage contribution to total GDP
Agriculture: 6.8% (2017 est.)
Industry: 32.3% (2017 est.)
Services: 60.7% (2017 est.)
Source: CIA World Factbook - December 7, 2019
The ecological costs of climate change are potentially higher for the emerging countries that are characterized with higher economic activities (Apergis and Payne, 2012). Most times these economic activities are centered on some intensive energy utilization sectors such as manufacturing and industrial sectors, energy sector and agricultural sector. Because of globalization as it involves foreign trade and foreign investments, and technological development, the manufacturing activities that take place in a given economy is dominated with both domestic and foreign productive activities (Dunning, 2000). The productive activities that take place in manufacturing industry include but not limited to other practices, car designing, assembling and manufacturing, production of beverages, agro allied products, textiles, foot wares, jewelries, electrical and electronics. Part of the productive process is transportation of the products from the producers to the final consumers. The energy sector on the other hand engages the production, demand and supply of the energy sources (renewable and non-renewable) mainly fossil fuels but not limited to fossil fuels (Bekun et al., 2019). The involvement of energy practitioners into mining of coals, exploration and flaring of oil and gases explain the energy activities that are found in the industrial activities. Also, the agricultural practices such as farming (subsistence and mechanized) which engages the land by means of forest products (clearing and ploughing), cropland, addition of fertilizers, grazing land, built-up land constitute economic activities which most times are transferred to manufacturing sector for final processing.
The major focus of this work is the ecological cost of foreign countries’ offshored economic activities in Turkey. The offshored economic activities taking place in Turkey can be seen from the perspective of Foreign Direct Investment (FDI) into Turkey which amount to foreign countries offshored economic activities in Turkey’s domestic economy. That is the economic activities of other countries in Turkey through the medium of foreign direct investment. These oversea or
5
offshored economic activities are capable of generating carbon emissions, greenhouse gas (GHG) and other Ecological Footprints. Some other authors have acknowledged the impact of offshored economic activities on the foreign country’s ecology with foreign trade which they define as outsourcing emission through trade. Individually, the authors have framed this with terms such as weak carbon leakage (Peters, 2008), carbon displacement (Jiborn et al., 2018) or spillover effects (Huang et al., 2017). Most manufacturing activities going on in Turkish economy are owned or coordinated by other countries. To Turkish economy, it is inbound economic activities while for the foreign investors it is their offshored economic activities. It simply means transferring the productive or manufacturing activities from their countries to Turkey due to some factors accessible in Turkey such as loose environmental policies, availability of labor at low cost and availability of large market. This study mirrors down the foreign countries offshored economic activities to Foreign Direct Investment (FDI). The FDI is offshored economic activities of foreign countries into another country (i.e. cross-border investment), and can be defined as the direct investment into the host country from a foreign country. According to World Bank, (2019), investment is called FDI when the investor occupies 10% ownership of the ordinary share of voting stock. FDI has a way of impacting the economic performance of any nation which could either be competitive effect, linkage effect or employment effect. The competitive effect enhances the competitiveness of domestic firms in standard and operational techniques, while the linkage effect is seen from the economies of scale where the domestic firms enjoy the technical support of the foreign companies in linkage form which aids in improvement of production techniques. The employment effect comes into play with the transferring of the trained workers of the foreign companies to the domestic firms thereby encouraging skills and knowledge transfer (Gorg and Strobl, 2001). However, the impact of the investment from abroad on the domestic economy may or may not hurt the ecology. This has been argued among different authors in different literature with some of them showing counter findings to support their claims of the impact of oversee investment on the domestic economy and environment (Cole and Elliot, 2003&2005; Cole, 2004; Copeland, 2010: Shahbaz et al., 2015a b; Asghari, 2013; Acharyya, 2009). This has formed part of environmental economics literature with two categories of hypothesis, hence, pollution haven hypothesis and pollution halo hypothesis (PHH). Foreign direct investment impact can be either unfavorable or favorable. The unfavorable impact of investment from abroad (FDI) on ecology is termed pollution haven hypothesis (PHH).This considers the foreign investors as opportunists who
6
anchored on the loose environmental policies of the host countries to carry on with their productive activities in a dirty manner without showing any regard to the environmental state of the country (Eskeland and Harrison 1997;Cole and Elliot, 2003&2005; Cole, 2004; Copeland, 2010: Shahbaz et al., 2015a b; Asghari, 2013; Acharyya, 2009; Bakirtas and Cetin, 2017; Sarkodie and Strezo, 2019; Solarin et al., 2017). The favorable impact of investment from abroad to both the economy and ecology is called pollution halo hypothesis (PHH) and could be seen when the foreign companies perform their productive activities in a cleaner manner with clean machineries and with good ecological management techniques (Zarsky, 1999; Alfaro et al., 2010; Bustos 2007; Ndikumana and Verick 2008; Lee, 2013; Udemba et al., 2019; Ahmad and Du, 2017; Al-Mulali and Tang, 2013; Balsalobre-Lorente et al., 2019).
Most developed nations have utilized the platform of offshore economics to outsource their supposedly emission to the host countries (Duncan Clark, 2009). This they engage on by transferring most of their productive activities to the developing countries through foreign direct investments platform. This act gives them the justifying ground to their claim of emission reduction in their various countries while they are actually transferring the emission to the developing and emerging economies with less stringent regulations or laws towards manufacturing activities. This is observed in the case of China where the countries like UK and USA use as their productive ground and market (Duncan Clark, 2009). This is equally a true scenario in Turkey where most of the productive and manufacturing activities are done by and for other nations most especially, the European nations. The offshored emission which are the end products of offshored economic activities is among the sensitive but unresolved issues in both Kyoto’s rule and Copenhagen summit as it connects to energy consumption and carbon emission.
In energy and environmental studies, most authors have used several single indicators such as carbon emission (C02 emissions), greenhouse gas(GHG) or single component of ecological footprint to quantify or measure the environmental dilapidation. In as much as these indicators tend to give validation on the nature of environment, the validation is incomplete and cannot expose the full nature of the environment as they are just part of the components in determining the nature of environment. So it is irrational to consider the state of the environmental performance with just one indicator or pollution type. In a way to have a comprehensive validation of the environment, ecological footprint was considered as a comprehensive and valid indicator by Rees
7
and Wackernagel (1996). The ecological footprint indicator validates the environmental state with a pooled source such as oil stocks, soil, forestry and mining (Ulucak and Lin, 2017). Ecological Footprint is described as a measure of the size of area of biological environment the occupants utilized to produce all the resources they needed (Global Footprint Network, 2018). Ecological footprint as an indicator consists of six components: cropland, grazing land, fishing grounds, forest land, built-up land, and carbon footprints. The pooled nature of the ecological footprint as an indicator makes the sustainability policy framework more effective than the single indicator that lacks in encompassing and comprehensive validation of the environment.
To this effect, this study seeks to expose the ecological implication of offshored economic activities in Turkey. To the best of authors knowledge, a handful of authors have tried to investigate ecological footprint with other variables which includes foreign direct investment but none of them have tried to proxy the across-border (foreign direct investment) activities as offshored economic activities. Also, the current study explores the influence of foreign offshored economic activities (FDI) on the manufacturing output of Turkey. This will be done by regressing FDI on the manufacturing output. The reason behind this is to ascertain the level of external impact to the domestic economic (manufacturing) operation in Turkey which will give credence to the claim of the author on the impact of foreign investors on the domestic economy of Turkey. This will serve as a robust check to the impact of offshored economic activities through foreign direct investment. The adoption of the offshored economic activities and the application of manufacturing output-FDI relationship justifies the novel of this study. The contribution of this paper to the current literature will be on exposing the real promoter of global warming, whether the host countries where the offshored economic activities take place are responsible or the foreign countries that outsource their productions to the host countries through investment platform. Also, this study will contribute to the existing literature through its finding on the connecting factor among the ecological footprint, foreign direct investment and energy utilization.
The rest part of this study will be as follow: section 2. Theoretical background, section 3. Data and methods, section 4. Results and discussion, section 5. Conclusion and Policy recommendation.
2. Theoretical Background
The current work is based on two theoretical frame works: Environmental Kuznets Curve (EKC), [Kuznet, 1955, 1963& 1966 and Grossman & Krueger, 1991; Shafik and Badypadhyay 1992 and
8
Panayotou 1993] and Pollution Haven Hypothesis (PHH) (Eskeland and Harrison 1997; Cole and Elliot, 2003; Cole, 2004; Copeland, 2010). The first theory was picked from Simeon Kuznet curve (Kuznet, 1955) and expanded to test the environmental applicability of the theory. Kuznet first introduced his curve in attempt to study the disparity of income (income inequality) among the farmers and those in white collar jobs, and the effect of the rural-urban migration. The U-shape curve is initiated when the majority of rural dwellers (majorly farmers) with lowest income power move to urban areas in search of paid jobs. This movement comes with rise in economic growth and development which will continue to a certain stage of initiating a U like shape (movement) thereby limiting the income disparity and pave way for greater economic performance and increase per capita GDP. The theory was later picked and tested in the case of environmental performance with the economic growth by Grossman and Krueger, (1991), and subsequently expanded by Shafik and Badypadhyay (1992) and Panayotou (1993). The assumption that is rooted in this theory as it relates to environmental performance is that economic growth will pick upward trend without a corresponding effect to the betterment of the environment till it gets to a stage where the awareness of the public will be geared towards environmental state of the country. At this stage, the U-shape of the theory will set in depicting the balancing of the economic growth with the betterment of the environment. The advocates of this theory have supported it with dimensional economic growth behavior thereby dividing economic growth into 3 phases that have different effects to the environment. The first phase is called scale effect phase which exposes the eagerness from the handlers of the economy to induce speedy economic growth thereby focusing more on the economic growth without complimenting the economic growth with the environment. The second phase is a technological phase with its effect on the environment. This is a transitional stage with public awareness towards the environmental state. This stage is characterized by structural changes that effect production techniques, due to the introduction and availability of new modern technology. It also impacts people’s choice of jobs and ways of life. At this stage companies and firms have started adjusting to a cleaner production with improved technologies thereby trying to balancing the economic performance with the environmental performance. The second phase precedes the final phase which is called the composite stage. This stage is characterized by professional careers rooted in services such as Medical Doctors, Teachers and in Research and Development (R&D) programs. This is a stage that developed economy is fully realized with cleaner technology and production that enhances the quality of the environment. Most times, the
9
claim that is associated with EKC is that emission is encouraged in the developing economies than the developed economies. The second theoretical background of this current work is Pollution Haven Hypothesis (PHH). This is associated with a transfer of productive economic activities to the economies because of less stringent of environmental regulation with regards to the economic activities that are capable of hampering the environmental quality. Other reasons that are attached to the transfer of foreign economic activities to another country are the availability of workers at low cost and the accessibility of market for their products. This is a proposition that comes with counterfactual basis which paves way for two hypotheses: pollution haven hypothesis and pollution halo hypothesis. The pollution haven hypothesis is observed when the entrance of the foreign economic activities in form of FDI into the country constitute environmental dilapidation ( Shahbaz et al., 2015a, b; Asghari, 2013; Acharyya, 2009; Baek, 2016; Bakhsh et al., 2017; Bakirtas and Cetin, 2017; Sarkodie and Strezo, 2019; Solarin et al., 2017). Most times the polluting industries find it profitable to perform their productive operations in the developing or emerging economies than the developed economies because these economies (emerging) are operating at the scale stage of the economic growth with a relax environmental laws which is the opposite for the developed economies where the cost of cleaner production is considered high. Where this failed to hold, the pollution halo hypothesis is established. This is where the entrance of the foreign companies in the platform of FDI benefits both the economy and environmental performance of the country (Zarsky, 1999; Alfaro et al., 2010; Bustos 2007; Ndikumana and Verick 2008; Lee, 2013; Udemba et al., 2019; Ahmad and Du, 2017; Al-Mulali and Tang, 2013). The host country benefit from the foreign companies that have found entrance into the economy through competitive effect, transferring or linkage effect and employment effect (Gorg and Strobl, 2001; Tian,2007). The benefit is extended to the quality of environment by the means of engaging in a cleaner production with clean energy mix which enhances the environmental performance.
3. Data and Methodology
3.1. Data
The author employs Turkish secondary data dated 1974 to 2017. The focus of this study is on Turkey because of the following reasons: First, Turkey is a strategic emerging economy that is lying between the European economies and the Asian economies which made her susceptible for aggressive measures towards economic growth to meet and match with the economic growth of
10
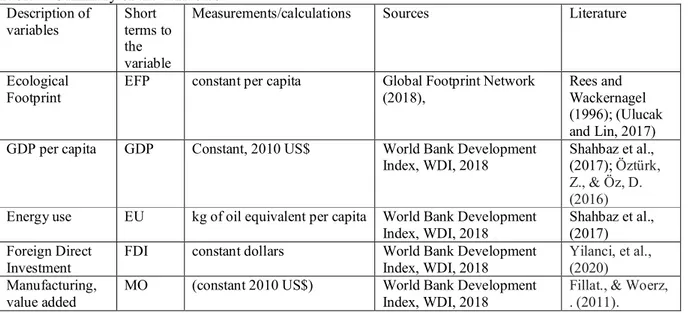
the surrounding countries. In addition, for the convergence propensity of meeting up with the surrounding economies in terms of economic growth, Turkey stands as a prospective member of EU in near future and preparation for this move may work as force to trigger aggressive economic growth which can becloud the authorities of the countries from the environmental implication of the aggressive growth measures. Turkey is in a strategic position as an oil and gas transit country which is capable of accommodating dirty energy use (Van der Linde, 2004). The projections of United Nations Development Programme (UNDP) and World Bank (WB) revealed Turkey’s potential energy consumption of 5.6% within the period of 2000-2025 (UNDP and WB (2003). In a summary, there has been an uncontrolled increase of oil and gas imports into the energy mix of the country, starting from 14 million tonnes of oil equivalent (mtoe) to 73 mtoe and 155 mtoe in 2000, 2015 and 2025 respectively which covers almost half of the total energy need. The data comprises of GDP per capita (Constant, 2010 US$), energy use (kg of oil equivalent per capita), Manufacturing, value added (constant 2010 US$), FDI, (Constant, 2010 US$), this is arrived at deflating the FDI with GDP deflator of Turkey (Yilanci et al., 2020); ecological footprint- EFConsPerCap (constant per capita). With the exception of EFConsPerCap (constant per capita) which was sourced from Global Footprint Network (2018), all the data are sourced from the World Bank Development Index, WDI, 2018. Variables are expressed in logarithm form and are displayed with their short terms, measurement of units, sources of data and the literature where they have been used in the table below.
Table 2. Summary of the variables Description of variables Short terms to the variable
Measurements/calculations Sources Literature
Ecological Footprint
EFP constant per capita Global Footprint Network (2018),
Rees and Wackernagel (1996); (Ulucak and Lin, 2017) GDP per capita GDP Constant, 2010 US$ World Bank Development
Index, WDI, 2018
Shahbaz et al., (2017); Öztürk, Z., & Öz, D. (2016)
Energy use EU kg of oil equivalent per capita World Bank Development Index, WDI, 2018
Shahbaz et al., (2017) Foreign Direct
Investment
FDI constant dollars World Bank Development Index, WDI, 2018
Yilanci, et al., (2020)
Manufacturing, value added
MO (constant 2010 US$) World Bank Development Index, WDI, 2018
Fillat., & Woerz, . (2011).
11
3.2. Methodology and Model Specification
The major method apply in this study is Autoregressive Distributed Lag (ARDL) with Bound testing for the establishment of both short and long linear relationship amongst the selected variables. This method is tailored after Pesaran and Shin, (1998) and Pesaran et al., (2001). Apart from ARDL-Bound testing method, several other methods are adopted by the author such as: descriptive analysis, stationarity analysis, optimal lag selection, and Granger Causality (GC) analysis. For the stationarity analysis which is the ascertainment of the unit root and the integration order, Augmented Dickey-Fuller test (ADF, 1979), Philip-perron, (1990) test and Kwiatkwoski Philip-Schmidt-Shin (KPSS, 1992) are used to test for the stationarity of the variables. Structural break test was incorporated in the stationarity analysis for a robust check to the conventional tests for unit root. Granger Causality (GC) analysis was applied to ascertain the path of impact that exist in the relationship amongst the variables as established with linear analysis. The optimal lag selection analysis is applied to determine the maximum lag in this study, and the lag is obtained through vector autoregression analysis with the Akaike Information Criterion (AIC) (Sakamoto, et al., 1986).Considering the undertaken of EKC theory as among the theoretical backdrops of this study, it is believed that the modelling of this estimation will follow the traditional inclusion of multiples form of GDP in order to maintain the increasing decreasing relationships that is portrayed in EKC theory. This present study deviates from the traditional EKC basis of applying the increasing or multiples of GDP among the independent variables. The deviation shows that this relationship can be analyzed empirically applying diverse procedures of environmental aspects. Selden and Song, (1994) showed that the initial and higher terms of GDP per capita are insignificant. Also, it has been proven that the earlier works that have adopted EKC model failed to recognize the problem of where the integrated process is having a unit root (Cheng, 2014). Wagner, (2008) supports the argument by positing that no assessment methods for pools as well as nonlinear transformations of the unified process in place. Hence, he is of opinion that it is wrong for the model to add income per capita and its multiple term when income is an intergraded process. Adopting the perspective of Wagner, (2008) and with the fact that the unit root of GDP is integrated at order 1(1), the current study considered a linearized form of model and estimation that includes a unified form of GDP per capita. The model specification of this study is followed after Pesaran and Shin, (1998) and Pesaran et al., (2001) and it is stated as following:
12 = + + + + (1) = + + (2) = 0 + + + + ∑ + ∑ + ∑ + ∑ + + (3) = 0 + + + + + ∑ + ∑ + ∑ + ∑ + + (4) = 0 + + + + + ∑ + ∑ + ∑ + ∑ + + (5) = 0 + + + + + ∑ + ∑ + ∑ + ∑ + + (6) = + 1 −1 + ∑ 1 − −1 =0 +∑ 2 − −1 =0 + − + (7) = + 1 −1 + ∑ 1 − −1 =0 +∑ 2 − −1 =0 + − + (8) From the above model specifications, the author presents econometric specification of ARDL equations and models of both ecological footprint and manufacturing respectively in Eqs 1&2. The rest equations ( from 38) are the expansions of the ARDL models in Eqs 1&2 which contain both short run and the long run ( error corrections and ARDL-Bound testing). The variables accommodated in the above specifications are GDP (log of GDP per capita), EFP (log of ecological footprint), FDI (log of foreign direct investment, net inflow), EU (log of energy use) and MO (log of manufacturing output). Coefficients of long run and short run linear relationships are represented with and in Equations 38. The 1st Diff of the variables
in the model, speed of convergence over a long period of time, and the error term are represented with , . It is essential to determine if there is cointegration or the existence of long run relationship among the selected variables before the estimation of the linear autoregressive distributed lag. For this reason, bound testing approach is utilized with the help of F-stats. The criterion is the comparison of F-stats with two bounds (lower and upper bounds) of the test. If the F-stats is larger than the two bounds, it means the existence of cointegration or long run association, while the failure of F-stats to be greater than the two bounds shows that there is no cointegration and lack the ability to establish long run relationship amongst the selected variables. On the other hand, if the F-stats fall in between the two bounds, it means that the result
13
is inconclusive. The test is hypothesized with null and alternative hypothesis. The hypothesis plays a counterfactual role of determining between if there is cointegration or there is no cointegration. The hypothesis is represented as follow: H0 : = = = = = 0 while the
alternative hypothesis is represented as H1 : = = = = 0.
4. Empirical results and discussions
The results derived from the estimations through the adopted methods are presented in this section. The results will be presented in the following order: descriptive statistics, stationarity with structural break estimation, linear autoregressive distributed lag model and the granger causality estimation.
4.1. Descriptive statistics
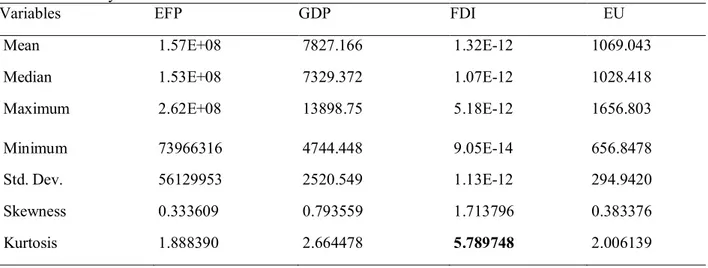
Summary of the descriptive statistics is presented in the Table 3 below with items as they appear in mean, median, maximum, minimum, standard deviation, skewness, kurtosis, Jarque-Bera with its probability. With the help of Kurtosis from the displayed descriptive results the author notes the following; the variable with the lowest volatility is ecological footprint with 1.888, while the variable with the highest volatility is foreign direct investment. The energy consumption is less volatile than economic growth. The outcomes from the result as depicted with skewness and jarque-Bera show normal distribution with a bell like shaped in the distribution of the series. Except for the case foreign direct investment with a figure greater than 3 and highly significant for Jarque Bera, other variables are with figures lesser than 3 and insignificant. This is a pointer for further estimation of linear analysis.
Table 3. Summary of statistics
Variables EFP GDP FDI EU
Mean 1.57E+08 7827.166 1.32E-12 1069.043
Median 1.53E+08 7329.372 1.07E-12 1028.418
Maximum 2.62E+08 13898.75 5.18E-12 1656.803
Minimum 73966316 4744.448 9.05E-14 656.8478
Std. Dev. 56129953 2520.549 1.13E-12 294.9420
Skewness 0.333609 0.793559 1.713796 0.383376
14
Jarque-Bera 2.941498 4.605161 34.17938 2.757419
Probability 0.229753 0.100000 0.000000 0.251903
Sum 6.60E+09 328741.0 5.55E-11 44899.82
Sum Sq. Dev. 1.29E+17 2.60E+08 5.23E-23 3566621.
Observations 42 42 42 42
Source: Author’s Computation
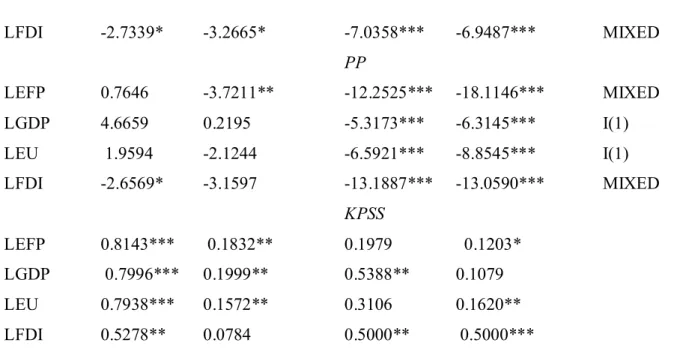
4.2. Stationarity tests
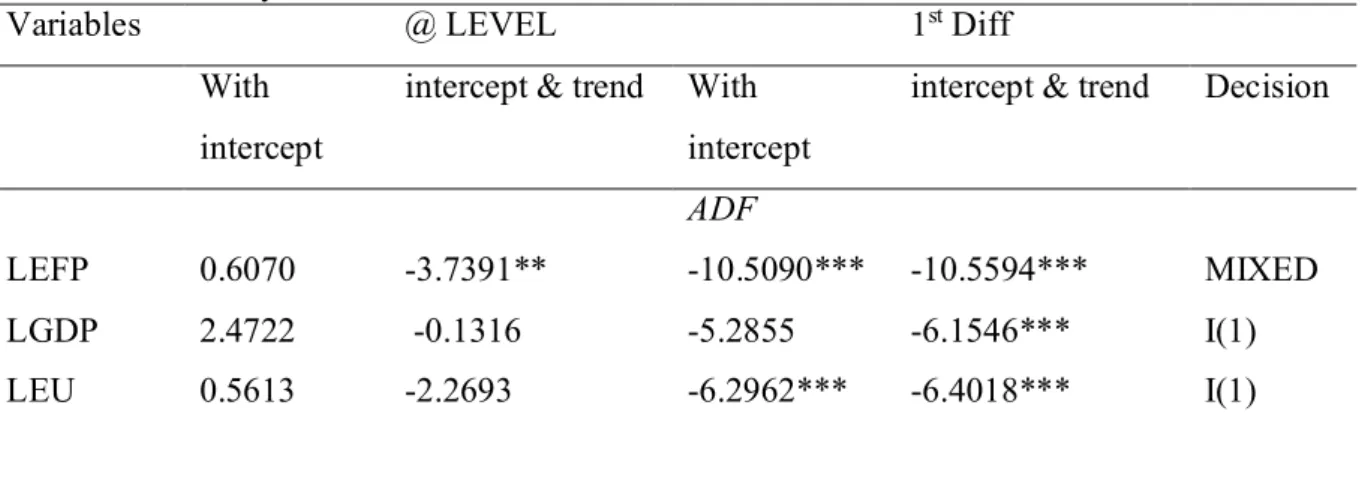
Stationarity estimate is applied in this paper to determine the stationarity of the indexes and the order of integration. Both the traditional stationarity approaches such as augmented dickey-fuller (ADF,1979), Philip –perron (PP, 1990) and Kwiatkowski-Phillips-Schmidt-Shin (1992,), and the Augmented Dickey- Fuller (ADF) structural break test were applied in analyzing the stationarity of the variables. The both tests show mixed order of integration (l (1) &l (0)), and non-stationarity of the variables at level. Going further in the assessment of the stationarity, the author adopted structural break test with ADF structural break test to expose any hidden break that might cause permanent shocks to the economy which are capable of affecting the stationarity of the variables. These shocks if not accounted for might lead to wrong estimation and conclusion in the stationarity analysis. The recorded shocks according to the result took place in the following years: 1979 -2007 for GDP, 1980-2005 for FDI,1979-2007 for EU and EFP. In summary, the shocks took place within the periods of 1979-2007 which are accommodated in the space of our research duration. This means that the shocks must be accounted for effective decision on the stationarity of the selected variables. Among the notable shocks accounted in this study was the monetary policy shocks in both the US and Germany which externally affect the small economies with fixed exchange regime to the big economies that were faced with the monetary policy shock. The monetary policy shock affect both the domestic economies of the big countries and the foreign economies of the small countries because of some degree of international real and financial integration. The expansionary monetary policy shocks of these big economies led to reduction in their domestic and world interest rates, depreciation in their currencies which the small foreign
15
countries peg their currencies making the small countries foreign currencies to appreciate over the domestic big economies currencies. This, increases the level of domestic investment, consumption and output which translate to decrease in the investment, consumption and output in the foreign economies. This will negatively affect the export of the foreign small countries because their exports will be magnified in price as against the domestic price of big economies considering the depreciation of big economies currencies and appreciation of the small economies currencies. Because of the level economic and financial integration amongst the big and small economies, the domestic monetary policies of the small countries who run the fixed exchange rate were made ineffective and dependent on the world monetary policies which is controlled by the big economies. This affect reserves of the small economies because they are already practicing fixed exchange rate with the foreign currencies. In attempt to increase the money supply, the agents in the system can only sell currencies to the government at the fixed rate, and this will definitely reduce the state reserve. Another notable shock was the oil price shock of 1973 and 1979 but this study was able to capture the effect of 1979 on both energy use and ecological footprint because the period of the current study covers from 1974-2017 which excludes the shock of 1973. There has been a consensus on the oil price shock to the economic performance. Findings from Rasche and Tatom, (1981), Hamilton, (1996) and Mork, (1989) shows the inverse relationship between the oil price and economic performance. Oil price shock simultaneously reduce economic performance (GDP) and upsurge general price (inflation). However, recently there has been studies proving a substantial decrease in the scale of inverse relationship because of technological innovation, control energy policy and exploration of other energy sources (Hooker, 1996&2002; Boyd, 2003; Jbir and Zouari-Ghorbel,2009). Both the results of the conventional methods of testing unit root and the structural break test are presented in the tables (4&5) below.
Table 4. Stationarity Test
Variables @ LEVEL 1st Diff
With intercept
intercept & trend With intercept
intercept & trend Decision
ADF
LEFP 0.6070 -3.7391** -10.5090*** -10.5594*** MIXED
LGDP 2.4722 -0.1316 -5.2855 -6.1546*** I(1)
16 LFDI -2.7339* -3.2665* -7.0358*** -6.9487*** MIXED PP LEFP 0.7646 -3.7211** -12.2525*** -18.1146*** MIXED LGDP 4.6659 0.2195 -5.3173*** -6.3145*** I(1) LEU 1.9594 -2.1244 -6.5921*** -8.8545*** I(1) LFDI -2.6569* -3.1597 -13.1887*** -13.0590*** MIXED KPSS LEFP 0.8143*** 0.1832** 0.1979 0.1203* LGDP 0.7996*** 0.1999** 0.5388** 0.1079 LEU 0.7938*** 0.1572** 0.3106 0.1620** LFDI 0.5278** 0.0784 0.5000** 0.5000***
Notes: a: (*) Significant at the 10%; (**) Significant at the 5%; (***) Significant at the 1%( b):
P-value according to (1) Sham et al., (1996) one-sided p-P-values (2) Kwiatkowski-Phillips-Schmidt-Shin (1992,)
Table 5. Structural break test
Variable ADF P-val Lag Break date CV(1%) CV(5%)
Level LGDP -3.727794 0.2879 9 2006 -5.067 -4.524 LEFP -4.232700 0.1061 9 2007 -5.067 -4.524 LEU -4.232700 0.1068 9 2007 -5.067 -4.524 LFDI -6.487893 < 0.01 *** 9 2005 -5.719 -5.176 1st Diff LGDP -6.313291 < 0.01 *** 9 1979 -5.067 -4.524 LEFP -10.55213 < 0.01 *** 9 1979 -5.067 -4.524 LEU -6.500577 < 0.01*** 9 1979 -5.067 -4.524 LFDI -6.887670 < 0.01*** 9 1980 -5.719 -5.176
Notes: a: (*) Significant at the 10%; (**) Significant at the 5%; (***) Significant at the 1% Source: Authors computation
17
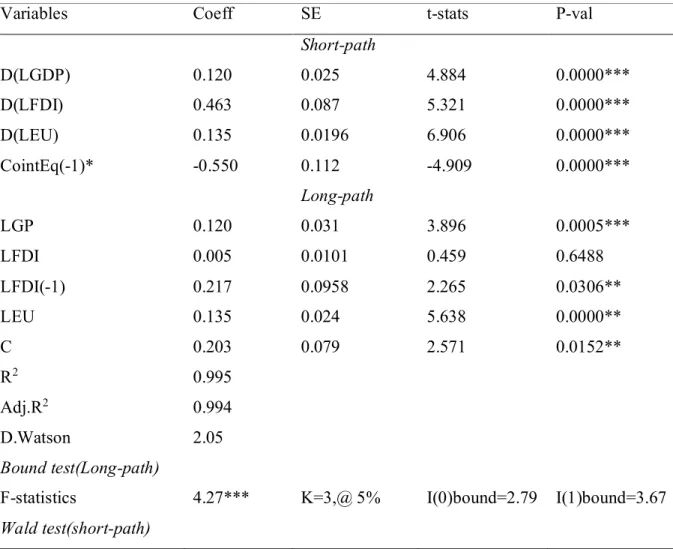
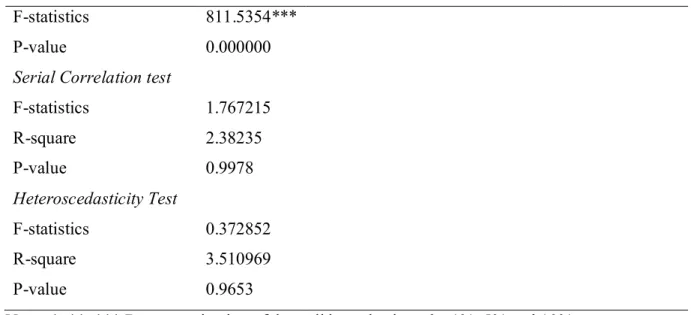
4.3. Linear ARDL-Bounds testing and diagnostic estimates (EFP and MO equations)
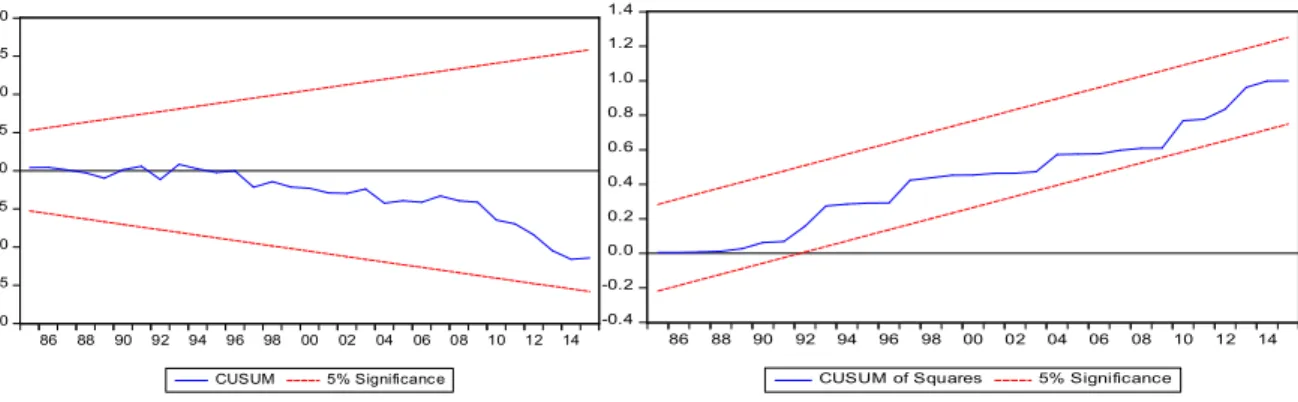
The estimations and findings from the linear autoregressive distributed lag with Bound testing and the diagnostic tests are all presented in Table 6 below. The result shows that regressors (GDP, FDI and EU) explain about 99.5% (0.995) and 99% of the dependent variables (EFP and MO) respectively, while the rest of unaccounted variations in the two models of the author’s interest (i.e. equations 3&7) are accounted by the error term ( ). The test and diagnostic estimation of serial correlation by Durbin Watson (DW) displayed the figure of 2.05 which is well accommodated within the acceptable range of 1.7 and 2.5. This satisfies that the model and analysis of this study is free from autocorrelation problem. In a robust check to this finding of Durbin Watson test, the LM test of serial correlation and heteroscedasticity were estimated and the results show insignificant meaning that the null hypotheses of serial correlation and heteroscedasticity in the model were rejected by accepting the alternative hypothesis. To ensure the stability and reliability structure of the adopted models are in line and free from wrong estimation, the Cumulative Sum (CUSUM) and Cumulative Sum Square (CUSUM square) estimations were carried out and the outcomes shows that both the stability and the reliability of this study are ascertained This is shown in the figures 1&2 with the blue line well bounded inside the two red lines. The outcome of the bound testing of cointegration is equally shown in the table with F-stat of 4. 26 which is greater than both the lower and upper bounds (2.79 and 3.67) at 5% thereby rejecting the null hypothesis of no cointegration. With the application of Akaike Information Criteria (AIC) the optimal lag of 2 was selected for the estimations in this study. From the estimation of error correction which shows a negative outcome of -0.550 at 1% significant, speed of adjustment was established to occur at 55.0% (-0.550). This finding with the help of cointegration established in bound testing shows the presence of long run relationship amongst the selected variables and the possibility of speed of convergence in the long run. Having established, the existence of long run relationship, the author proceeds with the estimation of linear autoregressive distributed lag for the confirmation of interactions and linear relationships that exist among the selected variables (i.e. dependent{EFP}& independent {GDP, FDI and EU} variables). Hence, the findings are as follow: Long run and short run Positive (elasticity) and significant connection is established between economic performance (GDP per capita) and ecological
18
footprint respectively. This finding gives credence to the Kuznet’s hypothesis that is perceived to be evident in the developing and emerging economies like Turkish economies. This is supposed to mean that Turkish economy is operational at the scale stage of the economic growth where the attention given to both economic growth and environmental performance is unequal. On this ground, greater attention is paid to the economic performance than the environmental performance. Quantitatively, a one percent increase in economic performance (GDP per capita) will lead to 12% (0.120) increase in ecological footprint both in the short run and long run which is a pointer to the fact that Turkish economic performance is at the expense of environmental dilapidation at the scale of 12%. This is in consonance with the findings by Ozturk., & Acaravci, (2010) for Turkey;
Udemba EN, (2019) for China and for Indonesia; Fei et al., (2011) and Huanying Cui, (2016) for China. Udemba et al., (2020); Gökmenoğlu, & Taspinar, (2016). A significant positive (elasticity) relationship was found among foreign investment (FDI) and ecological. This is not a good development for the case of Turkey. It shows that pollution haven hypothesis is valid for the case of Turkey. This is a pointer that the offshore economic activities as proxy by FDI is impacting unfavorable to the environmental performance of Turkey. It equally shows that there is a less regulation policy which permit the foreign investors to practice a dirty mode of production and operations which promotes emission and environmental damage. This result support with the works of Seker et al., (2015) for Turkey; Kaya et al., (2017) for Turkey: Destek and Sarkodie, (2019) for newly industrialized nations; Solarin et al., (2018); Gökmenoğlu, & Taspinar, (2016) for Turkey; Udemba EN, (2019) for China; Udemba et al., (2019) for Indonesia; Udemba et al., (2020) for China. This suggests that developed countries are really transferring their emissions to the emerging countries that host their offshore economic activities. Quantitatively, a one percent increase in offshored economic activities (FDI) will lead to both 0.46 and 0.005 increase in ecological footprint in short run and long run respectively for Turkey. Also, among the findings is the positive (elasticity) relationship that exist between the energy use (EU) and ecological footprint. This is a clear indication that Turkey is accelerating in its economic performance with the utilization of fossil fuel based energy mix. This satisfies the claim that oil and gas major in above average of Turkish energy consumption which are mostly imported. This compliment the works of Destek, & Sarkodie, (2019) for newly industrialize countries; Acar, & Aşıcı, (2017) for Turkey;Destek, and Sinha, (2020). Quantitatively, a one percent increase in energy use will lead to 0.13 and 0.13 increase in both short track and long track respectively. From Table 7, the
19
manufacturing equation and the estimation of linear autoregressive distributed lag for the confirmation of interactions and linear relationships that exist between the selected variables (i.e. dependent{FDI}& independent {MO} variables) is shown. The finding established a positive relationship between foreign direct investment (FDI) and the manufacturing output. This suggest that a one percent increase of the offshored economic activities (FDI) will increase the domestic manufacturing output at the rate of 0.962 in both short track and long track respectively. This suggest that offshored economic activities in form of FDI has a positive impact and contribution to the domestic manufacturing output of Turkey. So determining the effect of offshored economic activities of foreign countries to the environmental quality of Turkey is necessary in determining the emission contribution of the country (Turkey). The results of both the ecological footprint and manufacturing output models are displayed in the below Tables 6&7
Table 6. ARDL assessments of EFP model
Variables Coeff SE t-stats P-val
Short-path D(LGDP) 0.120 0.025 4.884 0.0000*** D(LFDI) 0.463 0.087 5.321 0.0000*** D(LEU) 0.135 0.0196 6.906 0.0000*** CointEq(-1)* -0.550 0.112 -4.909 0.0000*** Long-path LGP 0.120 0.031 3.896 0.0005*** LFDI 0.005 0.0101 0.459 0.6488 LFDI(-1) 0.217 0.0958 2.265 0.0306** LEU 0.135 0.024 5.638 0.0000** C 0.203 0.079 2.571 0.0152** R2 0.995 Adj.R2 0.994 D.Watson 2.05 Bound test(Long-path)
F-statistics 4.27*** K=3,@ 5% I(0)bound=2.79 I(1)bound=3.67
20
F-statistics 811.5354***
P-value 0.000000
Serial Correlation test
F-statistics 1.767215 R-square 2.38235 P-value 0.9978 Heteroscedasticity Test F-statistics 0.372852 R-square 3.510969 P-value 0.9653
Note: *, **, *** Denotes rejection of the null hypothesis at the 1%, 5% and 10%
Sources: Authors computation
Table 7. ARDL assessments of Manuacturing model
Variables Coeff SE t-stats P-val
Short-path D(LFDI) 0.962 0.052. 18.61 0.0000*** CointEq(-1)* -0.064 0.010 6.293 0.0000*** Long-path LFDI 0.962 0.097 9.958 0.0000*** C 0.588 0.017 3.522 0.0005*** R2 0.988 Adj.R2 0.97 D.Watson 1.9 Bound test(Long-path)
F-statistics 12.6*** K=1,@ 5% I(0)bound=5.5 I(1)bound=6.3
Note: *, **, *** Denotes rejection of the null hypothesis at the 1%, 5% and 10%
Sources: Authors computation
21 -20 -15 -10 -5 0 5 10 15 20 86 88 90 92 94 96 98 00 02 04 06 08 10 12 14 CUSUM 5% Significanc e -0.4 -0.2 0.0 0.2 0.4 0.6 0.8 1.0 1.2 1.4 86 88 90 92 94 96 98 00 02 04 06 08 10 12 14 CUSUM of Squares 5% Significance
Figure 1: CUSUM residual graphical plot Figure 2: CUSUM square residual graphical plot
4.5. Granger Causality test
The author adopted granger causality as among the methods applied in this study. The current work doesn’t purely base its findings on causality analyses alone. It is considered as part of robust check to linear relationship established already in the work with autoregressive distributed lag method. The linear ARDL only establish the relationship that exist amongst the selected variables without specific exposition of the direction (that is, which among the variables is impacting other variables). The author undertakes different methodologies in driving home the findings of this research and granger causality is part of the methods. We only employ granger causality with an eye on the causal relationship which gives direction of the impact on the already established relationship between the selected variables subject to the rule of null hypothesis. Granger causality examines the null hypothesis that the coefficients of past values in the regression equation is zero. In simpler terms, the past values of time series (x) do not cause the other series (y). In estimating the granger causality, the finding could either support or reject the null hypothesis. The result of the granger causality test is displayed in the table below.
Table 8. Causality test
Null Hypothesis: Causality F-stat Prob Remark Paths Decision
GDP does not Granger cause EFP EFP does not Granger cause GDP
NO 1.62939 0.00518 0.2093 0.9430 Neutral GDPEFP ACCEPT H0
EU does not Granger cause EFP
EFP does not Granger cause EU YES
3.57981 0.49654 0.0661* 0.4853 Uni-direction EUEFP REJECT H0
FDI does not Granger cause EFP
EFP does not Granger cause FDI YES
2.94162 4.08848 0.0943* 0.0501** Bi-direction FDIEFP REJECT H0
22 EU does not Granger cause GDP
GDP does not Granger cause EU NO
0.00644 1.69221 0.9365 0.2011 Neutral EUGDP ACCEPT H0
FDI does not Granger cause GDP GDP does not Granger cause FDI NO
0.15338 1.66675 0.6974 0.2041 Neutral FDIGDP; ACCEPT H0
FDI does not Granger cause EU
EU does not Granger cause FDI YES
1.24113 3.86696 0.2723 0.0566* Uni-direction EUFDI; REJECT H0
Notes: The decision to reject or accept the hypothesis is made at 5%. Remark paths point at the direction of the causal effects. ***p<0.01, **p<0.05, *p<0.10.
The result of the granger causality as displayed in Table 8, have exposed the direct impact and the direction of the relationship that existed amongst the variables. This outcome has thrown more light in the kind of relationship that exist amongst the variables, that is which variable is determining the relationship. From the result, it is established that a one-way causality is passing from energy use to ecological footprint. A one-way causal relationship (FDI transmitting to energy use) also exists between offshore economics activities (FDI) and energy use. More interesting finding is the feedback transmission (bi-direction) that exists between offshored economic activities (FDI) and ecological footprint. This is to say that both variables are impacting each other. This finding gives credence to the pollution haven hypothesis already established in linear autoregressive distributed lag. This finding supports the findings from Alola, et al., (2019); Alola, A. A. (2019); Bekun et al., (2019).
5. Conclusion and policy recommendation
This study researched and discussed the involvement of Turkey in climate change and its contribution towards the global abatement of emission. In order for effective and a detail investigation of this topic, the author adopts ecological footprint as the environmental indication. Also, the author introduced foreign offshore economic activities as among the measures to the environmental performance of Turkey. The conception of this idea is based on the activities of foreign investors in the domestic economic activities of Turkey. Turkey has been identified as among the commercial hubs and host to many other countries who outsource their economic activities to the Turkish economy because of its strategic position in manufacturing world and as a connecting country that lies in the belt of Asian and European countries, and Middle east country.
23
Considering the industrial activities taking place in Turkey and its involvement in oil and gas importation because of high energy utilization in the country’s manufacturing sector, it is required that the economy be researched towards its involvement in both emission inducement and abatement globally. Author, adopt several methods such as structural break analysis, ARDL-Bound testing and granger causality to effectively expose the offshore implication of environmental performance in Turkey. Author finds the following in the current study: A positive relationship between economic performance (GDP per capita) and ecological footprint, hence, giving credence and support the theory background of this study (i.e. EKC theory). Also, a positive relationship is established amongst foreign offshored economic activities (FDI), energy use and ecological footprint which shows that both energy use and foreign offshored economic activities are impacting positively to the ecology as indicator and unfavorable to the environmental performance. This supports the pollution haven hypothesis (PHH) which is among the theoretical backgrounds of this study. Among the findings established in this study is from granger causality method which supports the pollution haven hypothesis. A feedback causal transmission is observed between FDI and the ecological footprint, and a one-way of causal relationship passing from energy use and ecological footprint. With these findings, it can be said that the environmental implication of foreign offshored economic activities in Turkey is unfavorable. The findings of this study give insight on who to account for the unfavorable outcome of foreign offshored economics in Turkey which is considered among the contributions of this study. Considering the fact that the foreign investors’ activities pose detriment to the environmental performance of Turkey, one can easily conclude that Turkey is exempted from the blame, but the question remains “has Turkey done well in effective policy to checkmate the excesses of the foreign investors?”. If the answer to this question is YES, then Turkey could be exempted from the blame, but if the answer NO, then the blame should be apportioned on equal basis between Turkey and the foreign investors.
The policy framing of Turkey should be centered on sustainable development that balances the economic performance and environmental performance. The policy should consider reversing the pollution haven hypothesis to pollution halo hypothesis through regulating the foreign companies in order to perform their productive activities in a cleaner manner with cleaner technologies and with better environmental management techniques This policy should be targeted on the curtailing of the dirty activities of the foreign investors while creating avenue for attracting the foreign investors. The authorities should consider environmental sustainability in policy framing. This is
24
should be done through diversification and supporting measures. The diversification policy should be implemented by moving to low carbon energy mix and efficiency, and technology deployment. Adopting renewable energy sources such as solar, wind, geothermal, hydropower and oceanic power should be given priority in the diversification and decarbonization policy. This will not only limit the excessive emission but will reduce the over dependence of the country’s need for energy to oil and gas thereby reduce the transfer of wealth to the oil rich nations in form of oil and gas imports. The support measures policy should be implemented by adhering to the Kyoto mechanism and Paris agreement of emission reduction to 1.50C. Turkey has potential to develop and balance its economic performance and environmental performance if the highlighted policies in this study is adhered to.
Reference
Acar, S., & Aşıcı, A. A. (2017). Nature and economic growth in Turkey: what does ecological footprint imply?. Middle East Development Journal, 9(1), 101-115.
Acharyya, J. (2009). FDI, growth and the environment: Evidence from India on CO2 emission during the last two decades. Journal of economic development, 34(1), 43.
Ahmad, N., & Du, L. (2017). Effects of energy production and CO2 emissions on economic growth in Iran: ARDL approach. Energy, 123, 521-537.
Alfaro, L., Chanda, A., Kalemli-Ozcan, S., & Sayek, S. (2010). Does foreign direct investment promote growth? Exploring the role of financial markets on linkages. Journal of Development
Economics, 91(2), 242-256.
Al-Mulali, U., & Tang, C. F. (2013). Investigating the validity of pollution haven hypothesis in the gulf cooperation council (GCC) countries. Energy Policy, 60, 813-819.
Alola, A. A. (2019). The trilemma of trade, monetary and immigration policies in the United States: Accounting for environmental sustainability. Science of The Total Environment, 658, 260-267.
Alola, A. A., Bekun, F. V., & Sarkodie, S. A. (2019). Dynamic impact of trade policy, economic growth, fertility rate, renewable and non-renewable energy consumption on ecological footprint in Europe. Science of the Total Environment, 685, 702-709.
Apergis, N., & Payne, J. E. (2012). Renewable and non-renewable energy consumption-growth nexus: Evidence from a panel error correction model. Energy economics, 34(3), 733-738.
Asghari, M. (2013). A Test for the Pollution Haven Effect in the Selected EU-Asian Countries. International Economics Studies, 41(2), 49-66.
25
Bakirtas, I., & Cetin, M. A. (2017). Revisiting the environmental Kuznets curve and pollution haven hypotheses: MIKTA sample. Environmental Science and Pollution Research, 24(22), 18273-18283.
Balsalobre-Lorente, D., Gokmenoglu, K. K., Taspinar, N., & Cantos-Cantos, J. M. (2019). An approach to the pollution haven and pollution halo hypotheses in MINT countries. Environmental
Science and Pollution Research, 26(22), 23010-23026.
Bekun, F. V., Alola, A. A., & Sarkodie, S. A. (2019). Toward a sustainable environment: Nexus between CO2 emissions, resource rent, renewable and nonrenewable energy in 16-EU countries. Science of the Total Environment, 657, 1023-1029.
Bekun, Festus Victor, Fırat Emir, and Samuel Asumadu Sarkodie. "Another look at the relationship between energy consumption, carbon dioxide emissions, and economic growth in South Africa." Science of the Total Environment 655 (2019): 759-765.
Boyd, S. (2003). U.S. Patent No. 6,647,716. Washington, DC: U.S. Patent and Trademark Office. Brown, M. B. (2019). Africa's choices: after thirty years of the World Bank. Routledge.
Bustos, P. (2007). The impact of trade on technology and skill upgrading: Evidence from
Argentina. Universitat Pompeu Fabra.
Clark, D. (2009). China’s increasing carbon emissions blamed on manufacturing for west. The
Guardian, 23(02).
Cole, M. A. (2004). Trade, the pollution haven hypothesis and the environmental Kuznets curve: examining the linkages. Ecological economics, 48(1), 71-81.
Cole, M. A., & Elliott, R. J. (2003). Determining the trade–environment composition effect: the role of capital, labor and environmental regulations. Journal of Environmental Economics and
Management, 46(3), 363-383.
Cole, M. A., & Elliott, R. J. (2005). FDI and the capital intensity of “dirty” sectors: a missing piece of the pollution haven puzzle. Review of Development Economics, 9(4), 530-548.
Copeland, B. R. (2010). How does trade affect the environment?. In Is Economic Growth
Sustainable? (pp. 206-247). Palgrave Macmillan, London.
Cui, H. (2016). China’s economic growth and energy consumption. International Journal of
Energy Economics and Policy, 6(2), 349-355.
Destek, M. A., & Sarkodie, S. A. (2019). Investigation of environmental Kuznets curve for ecological footprint: the role of energy and financial development. Science of the Total
Environment, 650, 2483-2489.
Destek, M. A., & Sinha, A. (2020). Renewable, non-renewable energy consumption, economic growth, trade openness and ecological footprint: Evidence from organisation for economic Co-operation and development countries. Journal of Cleaner Production, 242, 118537.
26
Dickey, D. A., & Fuller, W. A. (1979). Distribution of the estimators for autoregressive time series with a unit root. Journal of the American statistical association, 74(366a), 427-431.
Dickey, D. A., & Fuller, W. A. (1981). Likelihood ratio statistics for autoregressive time series with a unit root. Econometrica: journal of the Econometric Society, 1057-1072.
Dong, F., Bian, Z., Yu, B., Wang, Y., Zhang, S., Li, J., ... & Long, R. (2018). Can land urbanization help to achieve CO2 intensity reduction target or hinder it? Evidence from China. Resources,
Conservation and Recycling, 134, 206-215.
Dunning, J. H. (2000). The eclectic paradigm as an envelope for economic and business theories of MNE activity. International business review, 9(2), 163-190.
Fei-Fei, Li, Leonidas Guibas, Xiaoye Jiang, Aditya Khosla, Andy Lai Lin, and Bangpeng Yao. "Human action recognition by learning bases of action attributes and parts." In 2011 IEEE
International Conference on Computer Vision (ICCV 2011), pp. 1331-1338. 2011.
Gökmenoğlu, K., & Taspinar, N. (2016). The relationship between CO2 emissions, energy consumption, economic growth and FDI: the case of Turkey. The Journal of International Trade
& Economic Development, 25(5), 706-723.
Gorg, H., & Strobl, E. (2001). Multinational companies and productivity spillovers: A meta‐ analysis. The economic journal, 111(475), F723-F739.
Grossman, G. M., & Krueger, A. B. (1991). Environmental impacts of a North American free trade
agreement (No. w3914). National Bureau of Economic Research.
Hamilton, W. D., & Hamilton, W. D. (1996). Narrow roads of gene land: evolution of social
behaviour (Vol. 1). Oxford University Press on Demand.
Harrison, A. E., & Eskeland, G. (1997). Moving to greener pastures? Multinationals and the
pollution-haven hypothesis. The World Bank.
Hooker, M. A. (1996). What happened to the oil price-macroeconomy relationship? Journal of
monetary Economics, 38(2), 195-213.
Hooker, M. A. (2002). Are oil shocks inflationary? Asymmetric and nonlinear specifications versus changes in regime. Journal of Money, Credit and Banking, 540-561.
Huang, J., Chen, X., Huang, B., & Yang, X. (2017). Economic and environmental impacts of foreign direct investment in China: A spatial spillover analysis. China Economic Review, 45, 289-309.
Jbir, R., & Zouari-Ghorbel, S. (2009). Recent oil price shock and Tunisian economy. Energy
Policy, 37(3), 1041-1051.
Jiborn, M., Kander, A., Kulionis, V., Nielsen, H., & Moran, D. D. (2018). Decoupling or delusion? Measuring emissions displacement in foreign trade. Global Environmental Change, 49, 27-34.
27
Kaya, G., Kumaş, M., & Ulengin, B. (2017). The role of foreign direct investment and trade on carbon emissions in Turkey. Environmental Economics, 8(1), 8.
Khan, D., & Ulucak, R. (2020). How do environmental technologies affect green growth? Evidence from BRICS economies. Science of The Total Environment, 136504.
Kuznet, S. (1955). Economic growth and income inequality. American Economic Review.
Kuznets, S., & Murphy, J. T. (1966). Modern economic growth: Rate, structure, and spread (Vol. 2). New Haven: Yale University Press.
Kwiatkowski, D., Phillips, P. C., Schmidt, P., & Shin, Y. (1992). Testing the null hypothesis of stationarity against the alternative of a unit root. Journal of econometrics, 54(1-3), 159-178. Lee, J. H. (2013). An overview of phytoremediation as a potentially promising technology for environmental pollution control. Biotechnology and Bioprocess Engineering, 18(3), 431-439. Mork, K. A. (1989). Oil and the macroeconomy when prices go up and down: an extension of Hamilton's results. Journal of political Economy, 97(3), 740-744.
Ndikumana, L., & Verick, S. (2008). The linkages between FDI and domestic investment: Unravelling the developmental impact of foreign investment in Sub‐Saharan Africa. Development
Policy Review, 26(6), 713-726.
Network, G. F. (2018). Global Footprint Network, Advancing the Science of Sustainability. Ozturk, I., & Acaravci, A. (2010). CO2 emissions, energy consumption and economic growth in Turkey. Renewable and Sustainable Energy Reviews, 14(9), 3220-3225.
Panayotou, T. (1993). Empirical tests and policy analysis of environmental degradation at
different stages of economic development (No. 992927783402676). International Labour
Organization.
Perron, P. (1990). Testing for a unit root in a time series with a changing mean. Journal of Business
& Economic Statistics, 8(2), 153-162.
Pesaran, M. H., & Shin, Y. (1998). An autoregressive distributed-lag modelling approach to cointegration analysis. Econometric Society Monographs, 31, 371-413.
Pesaran, M. H., Shin, Y., & Smith, R. J. (2001). Bounds testing approaches to the analysis of level relationships. Journal of applied econometrics, 16(3), 289-326.
Peters, G. P. (2008). From production-based to consumption-based national emission inventories. Ecological economics, 65(1), 13-23.
Rasche, R. H., & Tatom, J. (1981). Energy Price Shocks. Aggregate Supply and Monetary. Sakamoto, Y., Ishiguro, M., & Kitagawa, G. (1986). Akaike information criterion statistics. Dordrecht, The Netherlands: D. Reidel, 81.
28
Sarkodie, S. A., & Strezov, V. (2019). Effect of foreign direct investments, economic development and energy consumption on greenhouse gas emissions in developing countries. Science of the Total
Environment, 646, 862-871.
Seker, F., Ertugrul, H. M., & Cetin, M. (2015). The impact of foreign direct investment on environmental quality: a bounds testing and causality analysis for Turkey. Renewable and
Sustainable Energy Reviews, 52, 347-356.
Shafik, N., & Bandyopadhyay, S. (1992). Economic growth and environmental quality:
time-series and cross-country evidence (Vol. 904). World Bank Publications.
Shahbaz, M., Dube, S., Ozturk, I., & Jalil, A. (2015). Testing the environmental Kuznets curve hypothesis in Portugal. International Journal of Energy Economics and Policy, 5(2), 475-481. Shahbaz, M., Nasreen, S., Abbas, F., & Anis, O. (2015). Does foreign direct investment impede environmental quality in high-, middle-, and low-income countries?. Energy Economics, 51, 275-287.
Sham, P. C., Curtis, D., & MacLean, C. J. (1996). Likelihood ratio tests for linkage and linkage disequilibrium: asymptotic distribution and power. American journal of human genetics, 58(5), 1093.
Simon, K. U. Z. N. E. T. (1963). Quantitative aspects of the economic growth of nations, VIII: the distribution of income by size. Economic Development and Cultural Change, 11(2 Part II). Solarin, S. A., Al-Mulali, U., Musah, I., & Ozturk, I. (2017). Investigating the pollution haven hypothesis in Ghana: an empirical investigation. Energy, 124, 706-719.
TurkStat. (2019). Vehicle Types and Number of Road Motor Vehicles by Classification of Statistical Region Units Level 1. Turkish Statistical Institute.
Udemba, E. N. (2019). Triangular nexus between foreign direct investment, international tourism, and energy consumption in the Chinese economy: accounting for environmental quality. Environmental Science and Pollution Research, 26(24), 24819-24830.
Udemba, E. N., Güngör, H., & Bekun, F. V. (2019). Environmental implication of offshore economic activities in Indonesia: a dual analyses of cointegration and causality. Environmental
Science and Pollution Research, 26(31), 32460-32475.
Udemba, E. N., Magazzino, C., & Bekun, F. V. (2020). Modeling the nexus between pollutant emission, energy consumption, foreign direct investment, and economic growth: new insights from China. Environmental Science and Pollution Research, 1-12.
Ulucak, R., & Lin, D. (2017). Persistence of policy shocks to ecological footprint of the USA. Ecological Indicators, 80, 337-343.
UNDP, U., & WB, W. (2003). World Resources 2002-2004: Decisions for the Earth: Balance, Voice and Power. World Resources Institute, 315pp.
29
van der Linde, H., Hofstad, C. J., Geurts, A. C., Postema, K., Geertzen, J. H., & van Limbeek, J. (2004). A systematic literature review of the effect of different prosthetic components on human functioning with a lower-limb prosthesis. Journal of rehabilitation research and
development, 41(4), 555-570.
Wackernagel, M. (1996). How BIG is Our Ecological Footprint?: Slide Show Scripts. New Society Publishers.
Yilanci, V., Bozoklu, S., & Gorus, M. S. (2020). Are BRICS countries pollution havens? Evidence from a Bootstrap ARDL Bounds testing approach with a Fourier function. Sustainable Cities and
Society, 102035.
Zarsky, L. (1999). Havens, halos and spaghetti: untangling the evidence about foreign direct investment and the environment. Foreign direct Investment and the Environment, 13(8), 47-74.