www.
utis.tc
10
th
INTERNATIONAL CONGRESS
ON MACHINING
BARUT KEMER - ANTALYA, TURKEY
1
10
th
INTERNATIONAL
CONGRESS ON
MACHINING
CONGRESS PROCEEDINGS
7
– 9 November 2019
2
UTIS ORGANIZING COMMITTEE
Emre Özlü
Muharrem Sedat Erberdi
Dilara Albayrak
UTIS STEERING COMMITTEE
Ali ORAL
Balıkesir UniversityAli ÜNÜVAR
Istanbul Commerce University
Engin KILIÇ Atılım
University
Erhan ALTAN
Yıldız Technical UniversityErhan BUDAK
SabancıUniversity
İ. Etem SAKLAKOĞLU
Ege University
İsmail LAZOĞLU Koç
University
M. Cemal ÇAKIR Uludağ
University
Mustafa BAKKAL
İstanbul Technical UniversityUlvi ŞEKER
Gazi University
Yiğit KARPAT
Bilkent University
Yusuf KAYNAK
Marmara University
UTIS ACADEMICS COMMITTEE
Erhan Budak
Ulvi Şeker
Yusuf Kaynak
3
UTIS SCIENTIFIC COMMITTEE
Yusuf
AltıntaşThe University of British Colombia
Canada
Hamza K.
AkyıldızBozok University
Turkey
Kubilay
AslantaşAfyon Kocatepe University
Turkey
Bekir Bediz
SabancıUniversity
Turkey
K. Dionysios Bouzakis
Turkish German University
Germany
Orhan
Çakır YıldızTechnical University
Turkey
Ulaş Çaydaş Fırat
University
Turkey
Adem
Çiçek YıldırımBeyazit University
Turkey
İbrahim Çiftçi Çankırı
Karatekin University
Turkey
Can
Çoğun ÇankayaUniversity
Turkey
Zoltan Dombovari
Budapest University
Hungary
Sabahudin
EkinovićUniversity of Zenica
Bosnia and Herzegovina
Şerafettin
Engin
Pratt & Whitney Canada Corp.
Canada
Kaan Erkorkmaz
University of Waterloo
USA
Anton Germashev
Zaporozhye Technical University
Russia
Mustafa
Günay KarabükUniversity
Turkey
Krzysztof Jemielniak
Warsaw University of Technology
Poland
Umut
Karagüzel IşıkUniversity
Turkey
Bilgin
Kaftanoğlu AtılımUniversity
Turkey
Murat
Kıyak YıldızTeknik University
Turkey
Turgay
Kıvak DüzceUniversity
Turkey
Uğur Köklü Karamanoğlu
Mehmetbey University
Turkey
Ali Taner Kuzu
Arçelik A.Ş.Turkey
Haydar
Livatyalı YıldızTechnical University
Turkey
Ali Mamedov
American University of the Middle East
Kuwait
Jokin
MuñoaIK4-IDEKO
Spain
Jose C. Outeiro
ARTS & METIERS LaBoMaP Laboratory France
Babür Özçelik
Konya Technical University
Turkey
Orkun
ÖzşahinMiddle East Technical University
Turkey
Miroslav Piska
Brno University of Technogoly
Czech Republic
Gerard Poulachon
Ecole Nationale
Supérieuredes Arts et
MétiersFrance
Hacı Sağlam Selçuk
University
Turkey
Lütfi
Taner
Tunç SabancıUniversity
Turkey
Sharif Ullah
Kitami Institute of Technology
Japan
Alper Uysal
YıldızTechnical University
Turkey
Min Wan
Northwestern Polytechnical University
China
28
CHATTER DETECTION IN MILLING WITH ACOUSTIC
EMISSIONS AND DEEP LEARNING
Gokberk Serına, M. Ugur Gudeleka, Batıhan Senera, A. Murat Ozbayoglua, Hakki Ozgur Unvera
a, TOBB University of Economics and Technology Department of Mechanical Engineering, Ankara/Turkey, [email protected], [email protected], batihansener@ etu.edu.tr, [email protected],
Abstract
One of the main pillars of Industry 4.0 is the use of Machine Learning algorithms to make accurate predictions of the manufacturing environment in order to make informed decisions. Deep Learning algorithm, which is a subfield of machine learning, has been widely used and proven more effective than other classic computational intelligence methods in many fields such as aviation-aerospace, automotive, health, and finance. Deep learning algorithms, which lead to revolutionary new products and applications in these sectors, have also been gaining attention in the field of machining to make machine tools more intelligent to improve manufacturing efficiency. In this study, Convolutional Neural Networks (CNN) which is an architecture of deep learning has been implemented to detect chatter in a slot milling process. Chatter is vibrational phenomena and has severe effects on machining performance. The undesirable vibrations caused by chatter, may cause lower surface qualities and even tool breakages. Since chatter lowers the performance of the machining operations, it is very crucial to detect and take timely action. In this research, an acoustic emission (AE) sensor was mounted to the milling machine and collects acoustic emissions. Captured data was used for training and testing by the estimation model in order to detect chatter.
Keywords:
Chatter detection, Milling, Deep learning, Convolutional Neural Networks1 Introduction
Machining is one of the most preferred subtractive methods to manufacture parts. In this method, high labor cost, machining market demands, complexity, and uncertainty are common issues faced by manufacturers. These encountered problems encourage the studies on automated production. In addition, thanks to automated manufacturing, it is aimed to produce faster with higher yields. Therefore, automated manufacturing techniques have become promising in order to enhance productivity, machining reliability and failure prediction [1]. Efficient unmanned manufacturing techniques can be applied during the production by using automatic and advanced machining state monitoring methods. Also, machining state monitoring methods provide to protect the machine tool, cutting tool breakage, tool wear and detect chatter [2], [3], [4],[5]. Monitoring methods can be divided into two groups; automatically and manually. Manual tool condition monitoring by the operator is both expensive and inefficient. It can result in vital damage to the cutting tool, machine tool, and workpiece. However, with the increase in the usage of sensors, automatic tool condition monitoring methods are recently being studied. With this method, the chatter or tool wear can be detected without encountering a considerable problem [3], [6], [7]. As the market evolves, many sensors become indispensable parts of machine tools [4]. For this reason, monitoring of signals such as vibrations or
29
acoustics emissions (AE) measured in real-time during the milling or turning plays a vital role in the immediate detection of errors that may occur in the cutting tool or machine tool. Moreover, real-time monitoring using sensors prevent from unexpected tool wear, breakage and indefinite chatter since the necessary measures can be taken at the right time [8].
Chatter formation known as self-induced vibration is a complicated phenomenon in metal cutting. It is caused due to strong relative vibration between workpiece and cutting tool at specific combinations of process parameters such as depth of cut (mm) and spindle speed (rev/min) [9]. The first study on Chatter formation was carried out by [10]. So far, chatter related research has been implemented for more than a century. Nevertheless, several studies are still underway to develop a method to detect chatter more efficiently and automatically. It is very important to develop a method that will detect chatter effectively because it adversely affects surface quality, cutting tool life and machine tool life during the machining such as turning, milling, broaching, polishing, etc. [11]. By further developing Taylor's study [10], Altintas and Budak [12] developed chatter stability lobes to show the formation of chatter at different combinations of process parameters such as depth of cut (mm) and spindle speed (rev/min).
Following the studies of Taylor [10] and Altintas and Budak [12], monitoring based studies have been increased in order to detect chatter. In the monitoring techniques applied for chatter detection, data such as acoustic, vibration, temperature, cutting force are collected using various sensors such as AE sensor, accelerometer, thermocouple, dynamometer. There are generally three types of vibration in machining operations such as free vibration, forced vibration, and self-excited vibration. The impact occurred during the machining process causes free vibration. In gears, bearings, spindles, imbalance induces forced vibration. Also, self-excited vibration is caused by alternative force. It arises from the interaction between workpiece and the cutting tool [8]. Various vibration problems in machining are shown in Fig. 1.
Figure 1. Challenging chatter problems in machining processes [8].
In advanced monitoring for chatter detection, the signal outputs are generally generated as an analog signal in the form of a time series. Acoustic emission signals are one of the most preferred method in the monitoring process. These signals are measured as a time series using an acoustic emission sensor or microphone to detect chatter. Acoustic emissions obtained using an AE sensor are utilized by researchers in many studies. Delio [13] used acceleration, displacement, and AE sensor in order to
30
detect chatter. They compared the performance of these sensor types in the monitoring of the chatter formation. The result of their study shows that acoustic emission signals are more efficient to detect chatter. Altintas and Chan [14] have studied on a spectrum analysis of the acoustic signal during the machining process. They used the maximum amplitude in the spectrum for chatter detection. Schmitz et al. [15] have developed an indicator of chatter. Thanks to the developed indicator, they analyzed statistical variance in the acoustic emissions obtained at each rotation of the spindle. Kishawy et al. [16] have studied on detection of chatter vibration, cutting tool wear, tool breakage, and build-up edge. In their study, acoustic emission signals were monitored during the turning operation to detect chatter occurrence.
A non-stationary and nonlinear signal is observed in acoustic, vibration or cutting force data which collected as time-domain information when chatter occurs during milling. Usually, Fast Fourier Transform (FFT) is applied to convert time-domain data to frequency-domain to describe feature for the non-stationary and nonlinear process. Zhang et al. [17] have developed a novel approach based on energy entropy in order to identify chatter phenomena. They observed that in the stable state which consists of stationary signals, the rotation frequency was dominant on frequency-domain data as shown in Fig 2. Nevertheless, the energy of the milling operation is dominated gradually by chatter frequency when a non-stationary condition is observed.
Figure 2. Stationary and non-stationary conditions [17]
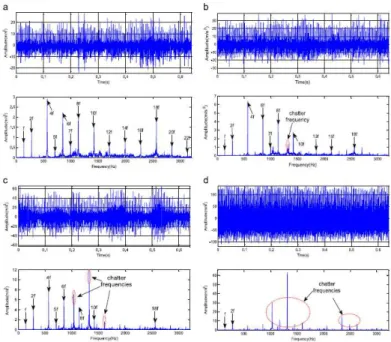
In another study, vibration data were collected using an accelerometer to identify milling chatter [18]. The dominant frequencies observed in the stable cutting state gave place to frequencies resulting from the chatter as shown in Fig. 3. In other words, they analyzed dominant frequencies and then determine chatter formation.
31
Figure 3. Vibration signal in the time domain and frequency domain a) stable cutting case with a depth of cut 1mm, b) unstable cutting case with a depth of cut 2mm c) unstable cutting case with a depth of cut 3mm d) unstable cutting case with a depth of cut 5mm [18]
In this study, in order to label the data as stable (no chatter) and unstable (chatter formation), the collected acoustic data were examined separately as in the studies of Zhang et al. [17] and Cao et al. [18]. It was observed that in stationary signals, the rotational frequency and harmonic frequency dominates. Thus, data encountered in such a case is labeled stable. However, when chatter frequencies instead of rotational frequencies were observed, the data was labeled as unstable. Then, the data tagged were given to the model in order to train the CNN based estimation model. In this study, CNN which has been gaining popularity in the field of autonomous vehicles, computer vision, and image classification, was preferred to identify chatter formation.
2 Methodology
The proposed method of machining state monitoring consists of the following three steps, including signal acquisition, preprocessing of acoustic emission signal, and chatter detection model training.
2.1 Signal acquisition
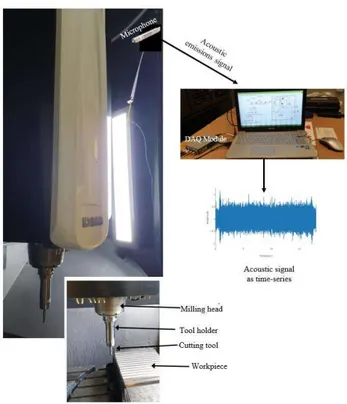
In order to monitor state of machining, accelerometer, AE sensor, dynamometer, amperemeter can be utilized to collect signals such as vibration, acoustic, cutting force and electrical current respectively. In this paper, acoustic emission signals were captured by an AE sensor. The experiments were conducted on a DMG-MORI® 5 axis milling machine which is able to operate up to 12000 rpm in order to machine slots on an aluminum 7075 workpiece as shown in Fig 4. A three-flute tungsten-carbide cutting tool with a diameter of 10 mm and length of 72 mm was used for the slot milling operations and 0.08 mm/tooth were used as feed parameter. During the experiments, the process parameters which were used are shown in Table 1.
32
Figure 4. The machine tool and data acquisition setup
Test No: Depth of cut (mm) Spindle speed (rpm)
1 2 3150 2 2 3430 3 2 3760 4 3 3760 5 8 3760 6 3 4200 7 8 4730 8 3 4730 9 3 5400 10 8 5400 11 3 6300 12 8 6300 13 3 7500 14 8 7500 15 3 9500 16 6 9500 17 8 9500 18 10 11000 19 6 11000 20 1 11000 21 1 9500 22 1 7500 23 1 5400 24 1 4730 25 1 3760 26 1 6300
33
Acoustic data is sampled at 12800 Hz and all samples were used without any down-sampling
operation in order to maintain a high-resolution sampling. No filtering is used during
acquisition to keep the raw data for future processing. Each slot has its own data stored in a
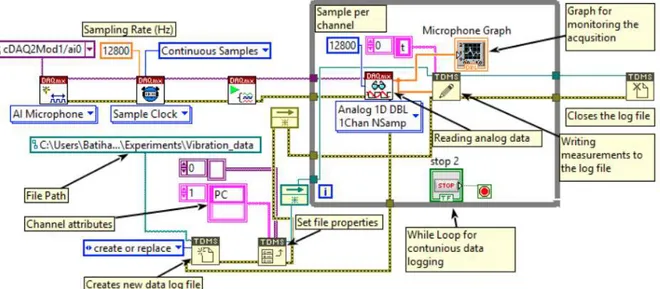
separate log file. The block diagram of the data acquisition algorithm is provided in Fig. 5.
Figure 5: Block diagram of the data acquisition system developed in LabVIEW.
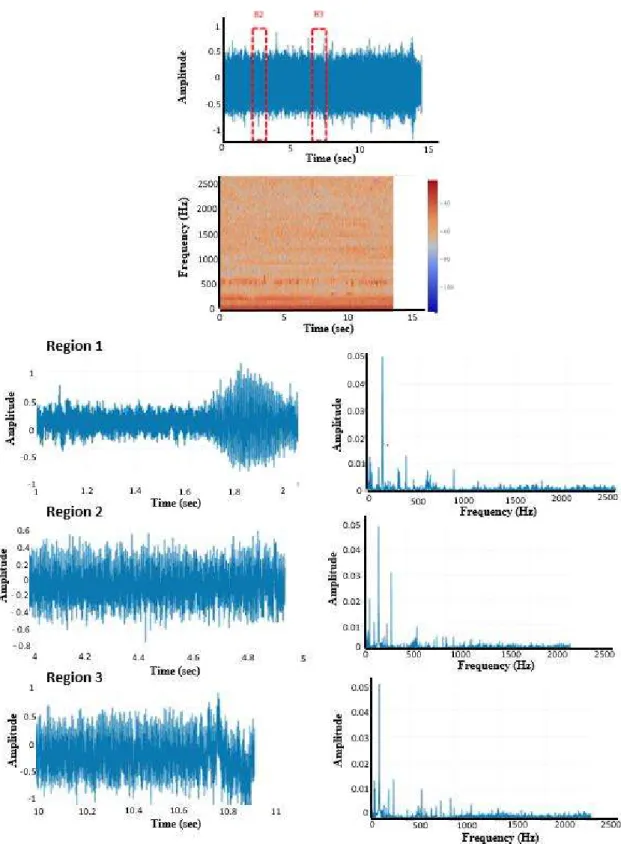
2.2 Preprocessing of AE signal
The collected AE data is the form of time-series. For cleaning and converting to another form
requires preprocessing operations. Therefore, a python script was created to process the raw
data captured via LabVIEW. Via this script, the time before machining starts and the time
after machining ends removed the original data. The remaining part of the data is split into
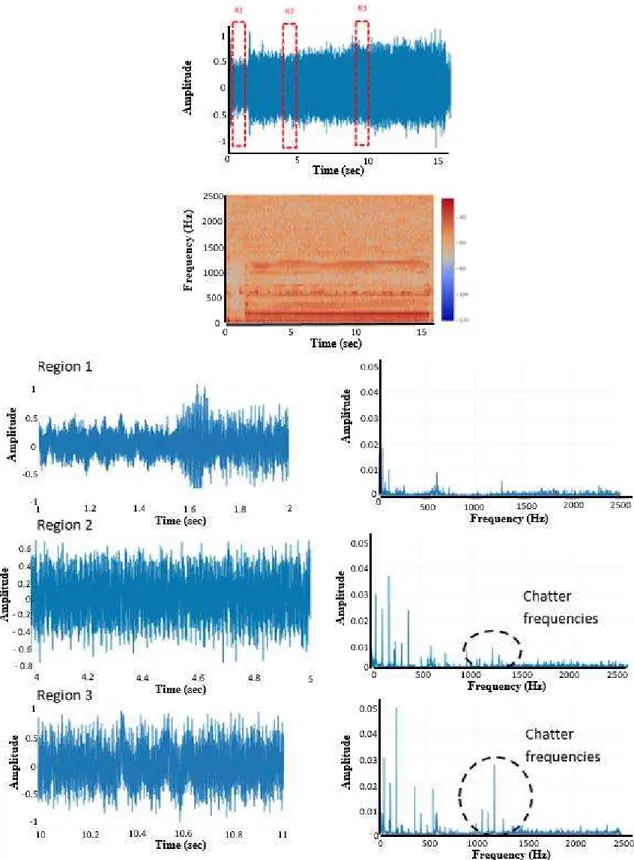
one-second intervals to increase the number of samples and to correctly capture chatter. In
the unstable slot milling process, it is observed that the chatter frequency gradually dominates
over the data in the frequency domain as shown in Fig 6. However, when it is a stable slot
milling process, chatter frequencies are not observed, and the rotation frequency continues to
dominate as shown in Fig 7. These observations were used to assign a label to each sample.
Before introducing the spectrograms to the CNN, by using STFT method, each sample is
converted into spectrogram which is a time versus frequency representation of the time-series
signal. In total, 147 spectrogram data were passed to the CNN model.
34
35
36
2.3. Prediction model for chatter detection
Convolutional neural networks gain popularity when AlexNet cut the error by half in ImageNet competition [19]. This shows that CNNs are good for working with images because of that spatial relationship in images makes convolution operator powerful. In this work, vibration data are converted to spectrogram which is 2D time versus frequency representation of time-series signal. Therefore, it would be beneficial to use CNNs in this work. However, spectrograms are correlated on time axis but not on the frequency axis and 2D convolution operator assumes that data is correlated on both x and y-axis. Therefore, rather than taking 2D convolution or 2D max-pooling, 1D version of each is selected.
The first layer consists of 10 convolutional filters with kernel size 5. These 10 filters have passed through a max-pooling layer with kernel size 4 and Rectified Linear Unit (ReLU). The second layer has the same configuration as the first layer. These two layers are added in successive order to act as a feature extractor. These automated feature extracting properties of deep learning models form the main difference between classical machine learning and deep learning. After that, 3 fully connected layers are connected in successive order to be able to classify the vibration samples as chatter or not. ReLU activation function is chosen to make the model non-linear. In addition, after the first and second fully connected layer, dropout with 0.9 drop rate is applied to avert overfitting.
3 Results
The CNN based prediction model was developed in order to determine stable or unstable
cutting condition during milling operation. Several CNN architectures were investigated to
find the optimal structure. In addition, several hyper parameter settings are applied. Selected
architecture design and hyper parameters setup play crucial role because of the lack of data.
Specifically, dropout rates on fully-connected layers affect the performances. Experiments
shows that lower dropout rates make the model performs unsatisfactorily. Therefore, 0.9
dropout rate is selected. In addition to the dropout rate, experiments were conducted with the
following parameters:
Experiments are conducted with the following setup:
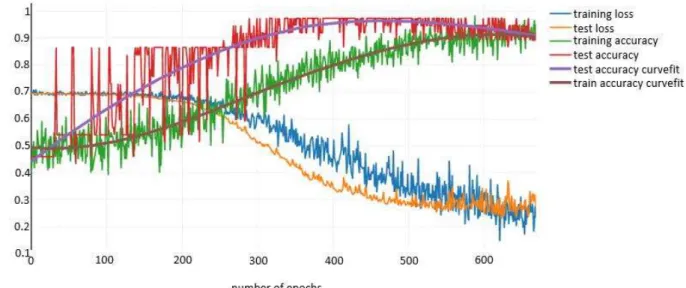
number of epochs: 670
batch size: 20
learning rate: 1e-4
train-test ratio: 0.75 which splits all samples into 110 training, 37 test samples.
The learning curve of the prediction model is shown in Fig. 8. In early epoch (0-120) CNN
predicts all test samples as 0 or 1. Therefore, test accuracy is alternating between the mean of
0-labeled and mean of 1-labeled samples. After that, training loss starts to decrease and
alternation between label mean stops. At the end of the training process (670
thepoch), 0.95
accuracy for training samples and 0.92 accuracy for test samples are obtained.
37
Figure 8. The learning curve of the prediction model
Confusion matrix for the developed chatter detection model is shown in Fig. 9. These
matrices show positives (TP), false-negatives (FN), false-positives (FP) and
true-negatives (TN) separately. In training dataset; 50 samples are predicted as stable out of 51
stable samples and 54 samples are predicted as unstable out of 59 unstable samples. In test
dataset; 14 samples are predicted as stable out of 17 stable samples and all unstable samples
are predicted correctly. These results indicate that chatter detection prediction model
generates satisfactory results.
Figure 9. Confusion matrix a) for training predictions b) for test predictions
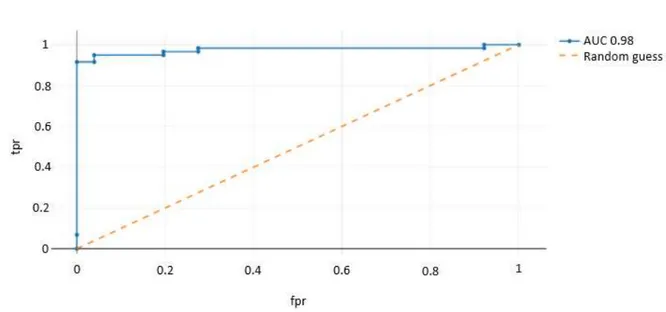
Receiver Operating Characteristic Area Under Curve (ROC-AUC) is shown in Fig. 10. Area under the curve is obtained as 0.98 which has a maximum value of 1.0. Hence, this ROC-AUC indicates that separation of probability distributions of the predictions is nearly ideal which means that predictions are perfectly distinguishable between stable and unstable.
38
Figure 10. Receiver Operating Characteristic Area Under Curve (ROC-AUC)
4 Conclusion
This paper presents a CNN based prediction model for chatter detection in CNC milling machines. STFT method was applied to the AE signals collected using accelerometer. Thereby, the time-series data converted into spectrograms because a CNN based model generally use spectrograms. Then, the spectrograms were labeled as stable and unstable in order to train CNN based prediction model for chatter detection. The CNN based estimation model developed in this study predicts stable and unstable situations with 92% accuracy. In this way, surface roughness and cutting tool breakage caused by chatter in machining processes can be prevented.
Acknowledgements
This study is funded by TUBITAK (The Scientific and Technological Research Council of Turkey) through project grant no. 118M414.
5 References
[1] Altintas Y (2012) Manufacturing automation: metal cutting mechanics, machine tool vibrations, and CNC design. Cambridge University Press
[2] Abellan-Nebot JV, Romero Subirón F (2010) A review of machining monitoring systems based on artificial
intelligence process models. Int J Adv Manuf Technol 47:237–257 . doi: 10.1007/s00170-009-2191-8 [3] Quintana G, Ciurana J (2011) Chatter in machining processes: A review. Int J Mach Tools Manuf 51:363–
376. doi: 10.1016/j.ijmachtools.2011.01.001
[4] Siddhpura M, Paurobally R (2012) A review of chatter vibration research in turning. Int J Mach Tools Manuf 61:27–47 . doi: 10.1016/j.ijmachtools.2012.05.007
[5] Teti R, Jemielniak K, O’Donnell G, Dornfeld D (2010) Advanced monitoring of machining operations.
CIRP Ann - Manuf Technol 59:717–739 . doi: 10.1016/j.cirp.2010.05.010
[6] Bahr B, Motavalli S, Arfi T (1997) Sensor fusion for monitoring machine tool conditions. Int J Comput Integr Manuf 10:314–323 . doi: 10.1080/095119297131066
39
[7] Aydın İ, Karaköse M, Akın E (2015) Combined intelligent methods based on wireless sensor networks for condition monitoring and fault diagnosis. J Intell Manuf 26:717–729 . doi: 10.1007/s10845-013-0829-8 [8] Yue C, Gao H, Liu X, Liang SY, Wang L (2019) A review of chatter vibration research in milling. Chinese J
Aeronaut 32:215–242 . doi: 10.1016/j.cja.2018.11.007
[9] Chen Y, Li H, Jing X, Hou L, Bu X (2019) Intelligent chatter detection using image features and support vector machine. Int J Adv Manuf Technol 102:1433–1442 . doi: 10.1007/s00170-018-3190-4
[10] Taylor FW (1907) On the art of cutting metals. The American Society of Mechanical Engineers, New York, New York, USA
[11] Lamraoui M, Barakat M, Thomas M, Badaoui M El (2015) Chatter detection in milling machines by neural network classification and feature selection. JVC/Journal Vib Control 21:1251–1266 . doi: 10.1177/1077546313493919
[12] Altintas Y, Budak E (1995) Analytical Prediction of Stability Lobes in Milling. CIRP Ann - Manuf Technol 44:357–362 . doi: 10.1016/S0007-8506(07)62342-7
[13] Delio T (1992) Use of Audio Signals for Chatter Detection and Control. J Manuf Sci Eng. doi: 10.1115/1.2899767
[14] Altintas Y, Chan PK (1992) In-process detection and suppression of chatter in milling. Int J Mach Tools Manuf. doi: 10.1016/0890-6955(92)90006-3
[15] Schmitz TL, Medicus K, Dutterer B (2002) Exploring once-per-revolution audio signal variance as a chatter indicator. Mach Sci Technol 6:215–233 . doi: 10.1081/MST-120005957
[16] Kishawy HA, Hegab H, Umer U, Mohany A (2018) Application of acoustic emissions in machining processes: analysis and critical review. Int J Adv Manuf Technol 98:1391–1407 . doi: 10.1007/s00170-018-2341-y
[17] Zhang Z, Li H, Meng G, Tu X, Cheng C (2016) Chatter detection in milling process based on the energy entropy of VMD and WPD. Int J Mach Tools Manuf 108:106–112 . doi: 10.1016/j.ijmachtools.2016.06.002
[18] Cao H, Zhou K, Chen X (2015) Chatter identification in end milling process based on EEMD and nonlinear dimensionless indicators. Int J Mach Tools Manuf 92:52–59 . doi: 10.1016/j.ijmachtools.2015.03.002 [19] Krizhevsky A, Sutskever I, Hinton GE (2012) ImageNet Classification with Deep Convolutional Neural
![Figure 1. Challenging chatter problems in machining processes [8].](https://thumb-eu.123doks.com/thumbv2/9libnet/3748600.27934/7.892.245.652.678.980/figure-challenging-chatter-problems-machining-processes.webp)
![Figure 2. Stationary and non-stationary conditions [17]](https://thumb-eu.123doks.com/thumbv2/9libnet/3748600.27934/8.892.267.631.503.877/figure-stationary-and-non-stationary-conditions.webp)