Turkish Journal of Fisheries and Aquatic Sciences 1 59-65 (2001)
Quality Changes of Whiting (Merlangius merlangus euxinus, N. 1840)
Stored at Ambient and Refrigerated Temperatures
Sevim Köse1,*, Mehmet Emin Erdem2
1
Karadeniz Technical University, Faculty of Marine Sciences, 61530, Trabzon, TURKEY
2
Karadeniz Technical University, College of Fisheries Science, 53100, Rize, TURKEY
* Corresponding Author: Tel.: + 90. 462. 752 28 05; Fax: + 90. 462. 752 21 58; E-mail: [email protected]
Received 13 March 2001 Accepted 22 August 2001 Abstract
In this study, the quality changes of whiting during storage at ambient and refrigerated temperatures were investigated using sensory, physical, bacteriological and chemical analyses. Three different whiting batches that were caught between the beginning of April and the end of May were used and sampling was carried out each day. The results showed that there were no significant differences among whiting batches except for bacteriological counts.
Storage time and temperature had a significant effect (p<0.001, p<0.05) on all the physical, chemical, bacteriological, and sensory values. The bacteriological counts, total volatile base nitrogen (TVB-N), pH, trimethylamine (TMA) and thiobarbituric acid (TBA) values increased significantly (p<0.05) while sensory results decreased (p<0.05). According to sensory results, the samples were acceptable for 1 day for ambient temperatures and for 2 days for refrigerated samples. The results of bacteriological counts and TVB-N agreed with the sensory results within the reported acceptable limits.
Key Words: whiting, quality, storage, ambient temperature, refrigerator temperature
Introduction
Whiting (Merlangius merlangus euxinus, N. 1840) are sufficiently common all year throughout Turkish waters even though there has been a decreasing trend in production since 1996. The production increased from 16,615 tons in 1994 to 21,450 tons in 1996, then gradually decreased to 13,150 tons in 1998 (Anonymous, 1999). However, it still covers an important part of Turkish fishing. Although this species is a perishable fish, it is commonly marketed fresh throughout Turkey without chilling, freezing or without applying any other preserving techniques.
Demand for quality chilled seafood in Turkish and other markets has increased over the past decade. Most of the studies on the shelf life of fish were carried out on the species stored in ice and at ambient temperatures (Smith et al. 1980a; Ryder et al. 1984; Ababouch et al. 1991; Gram, 1992; Magnússon and Martinsdóttir, 1995; Kyrana et al. 1997). The storage life of fish will vary from species to species. Fish that are caught in tropical waters and subsequently iced will last longer than similar species caught in cooler waters (Garthwaite, 1997).
The shelf life of white-fleshed lean fish was reported as 11-14 days in ice (Huss, 1988). The extended shelf life of fish stored in ice is important for both the transportation of fish and for processors who keep fish in ice until processed.
For retail marketing, it is advisable to display fish on a bed of ice on an insulated or refrigerated slab. However, only a few countries apply this method (Wignall, 1982). Several chilling methods have been suggested to increase the shelf life of fish (Clucas and
Sutcliffe, 1981; Graham et al. 1992). However, in Turkey, like many other countries, the retail selling of fish is either carried out in cold stores without ice or even at ambient temperatures.
Despite the commercial importance of the species, very few studies have investigated the
changes occurring in whiting through typical
handling, distribution and storage conditions in Turkey.
The goal of this study is to determine the rate and the type of deterioration processes occurring during the cold and ambient storage of whiting by use of sensory, bacteriological, physical, and chemical assessments. Furthermore, the investigation is to identify those analyses that can be used to monitor changes in whiting during its shelf life stored in the refrigerator or ambient temperature.
Materials and Methods
Whiting used in this study were caught in the Eastern Black Sea between April and May 1999, by commercial vessel using a purse seine net. After fishing, two different transportation methods and storage conditions were applied to the samples. In the first method, the fish were transported and stored in ambient conditions, as is popular among the regional fishermen. In this traditional method, the fish are
transported in wooden boxes (at ambient
temperatures) and sold without any cooling system. In the second method, the fish were kept in crushed ice (0°C± 1) 3:2 ice/fish w/w straight after catching, then packed in polystyrene boxes and transported into the laboratory. After that they were stored in a refrigerator (4°C± 1) without ice on a tray.
This method is commonly used in developed countries at retail marketing level and in some parts of Turkey especially for valuable fish species.
Each method was tested with three different batches. The fish were transported into the laboratory approximately 3 hours after catching them. Samples were taken for analysis at daily intervals and sampling was triplicated for each analysis. Table 1 shows the
sampling dates, the weather, and the water
temperatures at the time of sampling.
Sensory analysis
Eight experienced assessors judged the overall acceptability of the samples using a five-point quality scale according to Pedrosa-Menabrito and Regenstein (1990). The scale points were; very good, 5: good, 4: acceptable, 3: poor, 2: very poor, 1.
Microbiological counts
Counts were made on samples of muscle and
skin. Twenty-five grammes of samples were
aseptically weighed into a sterile blender containing 225 ml of sterile peptone water (PW) (0.1% w/v) and blended for 2 min at low speed. Further decimal dilutions were prepared in PW (Food and Drug Administration, 1978). The counts of total aerobic mesophilic and pyschrophilic microorganisms were determined by using plate count agar (PCA) incubated at 37°C for 72 h for mesophilic microorganisms and at 6°C for 10 days for pyschrophilic microorganisms (Collins et al. 1989).
Physical and chemical analysis
Total volatile bases nitrogen (TVB-N) content was determined by the method of Lücke and Geidel
(ønal, 1992). The rancidity development was
estimated by the Thiobarbutiric acid (TBA) values, which is expressed as mg malonaldehyde/kg. All the values were estimated using the method described by Smith et al. (1990). The method of Boland and Paige (1971) was used for trimethylamine nitrogen (TMA-N) analysis. The pH was detected according to Curran et al. (1980). All the chemical analyses were conducted on samples derived from a pool of three fish for each storage time and carried out in triplicate. Reagents were of analytical grade.
Statistical analysis
The data were evaluated using analysis of variance (Sokal and Rohlf, 1987).
Results
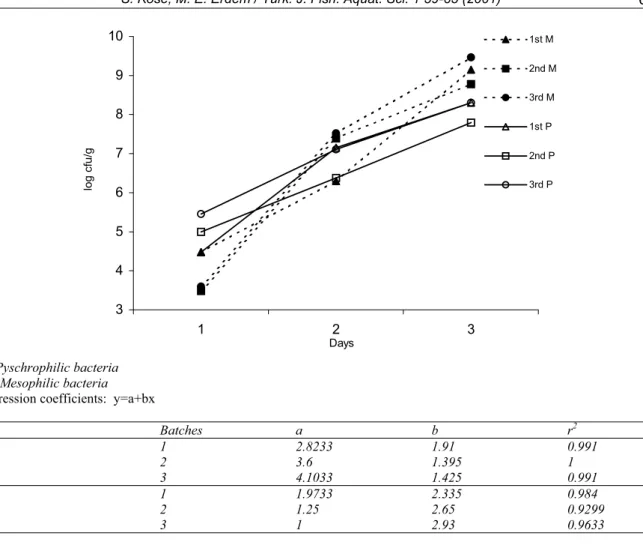
Figure 1 and 2 show mesophilic and
pyschrophilic bacterial counts. The lowest mesophilic
bacterial counts at ambient temperature were
observed on the 1st day of storage between 3.48 to
4.48 log (cfu/g) and the highest counts were found on
the 3rdday of storage between 8.78 to 9.46 log (cfu/g).
The values were increased significantly (p<0.05) depending on the time.
There was a significant variation between
batches for each storage day except between the 1st
and 2nd batches on the first day of storage time
(p<0.001). The lowest pyschrophilic bacterial counts for the samples stored at ambient and refrigerator temperatures were found on the first day of storage between 4.48 and 5.45 log (cfu/g) and 4.30 and 4.43 log (cfu/g), respectively. The values increased significantly for both storage temperatures (p<0.05).
On the third day of storage, the bacterial counts were between 5.30 and 7.79 log (cfu/g) for ambient temperatures, and 5.48 and 7.20 log (cfu/g) for refrigerator temperatures. The highest results were
observed as 8.60 log (cfu/g) for the 3rd refrigerated
batch on the 5th day of storage time. The samples
stored at ambient temperature were not analyzed for
pyschrophilic bacterial counts after the 3rd day of
storage because of a highly sensory spoilage rate observed. Storage temperature had a significant effect on pyschrophilic bacterial counts (p<0.05).
There were also significant differences between
the batches except between the 1st and 3rd batches on
the 2nd and 3rd days of storage for the ambient
temperature samples, and the 1st day of storage for the
refrigerated samples.
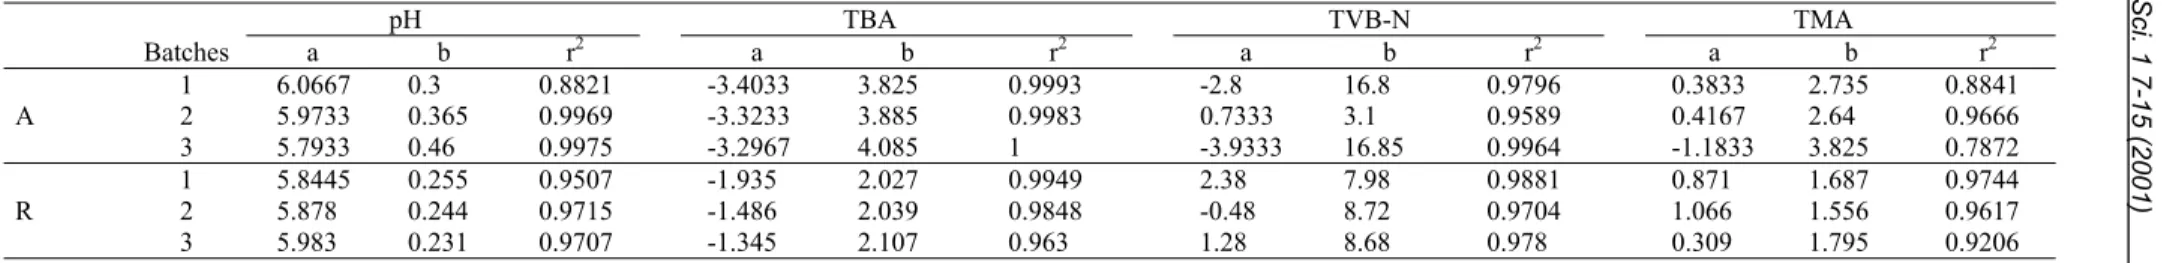
Table 2 shows the results of the sensory, physical and chemical analyses. It is clear from the table that
the physical and chemical values increase
significantly (p< 0.05) relative to time. The storage temperature also had a significant effect on all the physical and chemical values (p<0.001 and 0.05). The lowest values were found on the first day of storage and the highest were found on the last day of storage for both temperatures for all the physical and chemical analysis. The lowest and highest pH values were 6.24 and 7.16 for ambient temperatures and 6.14 and 7.22, respectively for the samples stored in the refrigerator. There were no significant differences between the batches except for the samples stored in
the refrigerator on the 3rd day. Table 3 represents the
regression coefficients of the physical and chemical values relative to time.
Table 1. The sampling dates, and the weather and water temperatures at the time of sampling
Batches 1 2 3 Sampling date 12.04.1999 26.04.1999 30.05.1999 Water temperature (°C) 13.5 12.8 17.8 Weather temperature (°C) 16.3 20.5 22.5
S. Köse, M. E. Erdem / Turk. J. Fish. Aquat. Sci. 1 59-65 (2001) 61 3 4 5 6 7 8 9 10 1 2 3 Days log cfu/g 1st M 2nd M 3rd M 1st P 2nd P 3rd P P= Pyschrophilic bacteria M= Mesophilic bacteria Regression coefficients: y=a+bx
Batches a b r2 1 2.8233 1.91 0.991 P 2 3.6 1.395 1 3 4.1033 1.425 0.991 1 1.9733 2.335 0.984 M 2 1.25 2.65 0.9299 3 1 2.93 0.9633
Figure 1. The results of the mesophilic and pyschrophilic bacterial counts of the samples stored at ambient temperatures.
4 5 6 7 8 9 1 2 3 4 Days log cfu/g 5
1st batch 2nd batch 3rd batch
P= Pyschrophilic bacteria
Regression coefficients: y=a+bx
Batches a b r2
1 3.3398 0.934 0.9918
P 2 3.43 0.888 0.9234
3 3.365 1.081 0.9501
S. Köse, M. E. Erdem
/ Turk. J. Fish. Aquat. Sci. 1 7-15 (2001)
Table 2. The results of physical, sensory and chemical analyses (Each point was derived from 3 replicates. ± represents Standard deviation)
Days pH TBA TVBN TMA Sensory
Batches I II III I II III I II III I II III I II III
1 6.43 ± 0.03 6.35 ± 0.06 6.24 ±0.03 0.48 ± 0.12 0.47 ± 0.06 0.79 ± 0.21 12.6 ± 0.56 15.4 ± 1.19 13.5 ± 0.72 3.69 ± 0.16 3.34 ± 0.26 3.79 ± 0.08 5 5 5 A 2 6.54 ± 0.02 6.68 ± 0.07 6.74 ± 0.05 4.13 ± 0.08 4.63 ± 0.02 4.87 ± 0.25 33.6 ± 2.03 23.8 ± 0.64 28.6 ± 1.02 4.71 ± 0.32 5.13 ± 0.21 4.17 ± 0.12 2 2 2 3 7.03 ± 0.05 7.08 ± 0.02 7.16 ± 0.02 8.13 ± 0.11 8.24 ± 0.07 8.96 ± 0.06 46.2 ± 0.77 41.6 ± 0.91 47.2 ± 1.74 9.16 ± 0.07 8.62 ± 0.15 11.44 ± 0.52 0 0 0 1 6.20 ± 0.05 6.14 ± 0.03 6.26 ± 0.01 0.37 ± 0.03 0.63 ± 0.22 0.26 ± 0.05 9.8 ± 0.69 8.4 ± 0.12 8.2 ± 1.49 3.01 ± 0.13 3.15 ± 0.02 3.00 ± 0.02 5 5 5 2 6.28 ± 0.07 6.32 ± 0.05 6.35 ± 0.05 1.77 ± 0.43 3.34 ± 0.03 3.10 ± 0.16 19.6 ± 0.58 14.2 ± 0.79 19.8 ± 0.83 3.99 ± 0.05 3.79 ± 0.20 3.36 ± 0.20 3 3 3 R 3 6.56 ± 0.02 6.59 ±0.04 6.74 ± 0.04 4.09 ± 0.09 6.42 ± 0.07 5.96 ± 0.48 26.6 ± 1.48 29.4 ± 1.05 30.4 ± 0.47 5.31 ± 0.14 5.10 ± 0.09 4.53 ± 0.09 2 2 2 4 6.79 ± 0.03 6.96 ± 0.02 6.88 ± 0.04 6.22 ± 0.18 7.56 ± 0.18 6.43 ± 0.61 32.2 ± 0.07 33.8 ± 1.24 34.2 ± 0.13 7.82 ± 0.12 7.61 ± 0.04 7.85 ± 0.04 2 2 2 5 7.22 ± 0.01 7.04 ± 0.02 7.15 ± 0.07 8.28 ± 0.07 10.47 ± 0.56 9.13 ± 0.43 43.4 ± 1.03 42.0 ± 0.31 44.6 ± 1.65 9.53 ± 0.16 9.02 ± 0.16 9.73 ± 0.24 0 0 0 A: Ambient Temperature R: Refrigerated Temperature
Table 3. Regression coefficients of the physical and chemical values relative to time, y=a+bx
pH TBA TVB-N TMA Batches a b r2 a b r2 a b r2 a b r2 1 6.0667 0.3 0.8821 -3.4033 3.825 0.9993 -2.8 16.8 0.9796 0.3833 2.735 0.8841 A 2 5.9733 0.365 0.9969 -3.3233 3.885 0.9983 0.7333 3.1 0.9589 0.4167 2.64 0.9666 3 5.7933 0.46 0.9975 -3.2967 4.085 1 -3.9333 16.85 0.9964 -1.1833 3.825 0.7872 1 5.8445 0.255 0.9507 -1.935 2.027 0.9949 2.38 7.98 0.9881 0.871 1.687 0.9744 R 2 5.878 0.244 0.9715 -1.486 2.039 0.9848 -0.48 8.72 0.9704 1.066 1.556 0.9617 3 5.983 0.231 0.9707 -1.345 2.107 0.963 1.28 8.68 0.978 0.309 1.795 0.9206 A: Ambient Temperatures R: Refrigerated Temperatures
S. Köse, M. E. Erdem / Turk. J. Fish. Aquat. Sci. 1 59-65 (2001) 63 The TBA values were found to be higher for the
samples stored at ambient temperatures. The lowest
TBA values were between 0.47 – 0.79 mg
malonaldehyde/kg for the ambient temperature and 0.26 – 0.63 mg malonaldehyde/kg for the refrigerated temperature. On the third day of storage, the values were between 8.13 – 8.96 and 4.09 – 6.42 mg malonaldehyde/kg, respectively. For further storage of the samples in the refrigerator, the highest TBA
values were 10.47 mg malonaldehyde/kg on the 5th
day of storage with the 2nd batch. The variation in the
TBA values were only found significant for the 3rd
batch on the 3rd day of storage for the ambient
temperature and for the 1st and 2nd batches on the 2nd
and 3rddays of storage for the refrigerator temperature
(p<0.05).
The lowest and highest TVB-N values for ambient temperatures were 12.6 and 47.2 mg/100g at
the 1st and 3rddays of storage, respectively. At the end
of the 1st day of storage, the lowest TVB-N value for
the refrigerator was determined as 8.2 mg/100g for
the 3rd batch and the highest value was 44.6 mg/100g
on the 5thday of storage. By comparison with ambient
temperatures, the highest TVB-N value was 30.4 mg/100 g on the 3rd day of storage for the refrigerated samples. The variations between batches were not found to be significant except between some
of the batches on the 2nd day of storage for both
temperatures.
TMA values for the refrigerator were lower than the samples stored at ambient temperatures. The lowest TMA values for ambient and refrigerator
temperatures were 3.34 and 3.00 mg /100g,
respectively on the 1st day of storage. On the 3rd day
of storage, the highest values were 11.44 mg/100g for
ambient temperatures, and 5.31 mg/100g for
refrigerator temperatures. The TMA values increased up to 9.73 mg/100g for refrigerator temperatures for
further storage on the 5th day of spoilage. The
variations between batches were not found to be
significant except on the 3rd day of storage for the 3rd
batch at ambient temperature.
Sensory values decreased significantly with the increasing chemical spoilage (p< 0.05). The same observations were made for each batch for each storage condition. Therefore, the results were represented as the mean of triplicated batches. The overall scores were higher for the samples stored in the refrigerator. Whiting samples were found to be unacceptable at the second day of storage at ambient
temperatures and the 3rd day of storage for refrigerator
temperatures. Discussion
Several factors such as species, size, catching methods, handling of fish temperature, and the physical condition of the fish can affect the shelf life of fish during storage (Huss, 1988). There are several methods to assess fish quality and deterioration.
However, there is a large species to species variation in the chemical, bacteriological, and sensory changes depending on storage temperature and conditions if the product is fresh or processed and the type of processing is carried out. Therefore, the acceptable limits for each quality criteria may vary for each species (Huss, 1988; Botta, 1995). Huss (1988) summarized the studies on the storage life of various fish species stored in ice.
Few studies have been reported on the quality changes of whiting stored at ambient and refrigerator temperatures. Köse et al. (1999) carried out a similar study with anchovy, whiting, horse mackerel and herring. They investigated the quality changes of the samples at cold storage 4±1°C for three days. In their study, the fish samples were brought to the laboratory in February and September without ice and stored in the refrigerator. Smith et al. (1980b) investigated the quality changes of whole and gutted blue whiting (Micromesistius poutassou) stored at ambient and chill storage (in ice and chilled sea water). They found that there was a greater degree of seasonal variability in blue whiting than in other gadoid species and the overall acceptability was dropping dramatically once the fish have spawned. Smith et al. (1980b) pointed out that in order to use any of the chemical indices to assess the storage life of blue whiting it would be necessary to know what the month the fish were caught and the method of storage. It was reported that whiting spawn throughout the year (Bristow, 1992). In this study, although the catching times were close to the study carried out by Smith et al. (1980b), it did not have any significant effect on the shelf-life and quality changes during both storage temperatures except with bacteriological results. However, Köse et al. (1999) found a variation between the batches for all the chemical and sensory values of whiting samples they analyzed although the shelf life were three days for all the samples. Our results showed a lower shelf life compared to Köse et al. (1999), which could be due to seasonal variation or other factors mentioned above.
The initial post-mortem pH varies with species to species, catching ground, and the season. Knowledge about pH of fish meat may give some valuable information about its condition (Huss, 1988). The pH of fish just after catching is reported between 6.0-6.5. The fish is acceptable up to pH 6.8 and the pH of spoiled fish is above 7.0. However, some fish species might have alkaline meat just after catching. Therefore, the pH value should not be used as the only indicator for fish freshness (ønal, 1992). According to pH values, whiting samples stored at ambient temperature show acceptable quality for 2 days, and 3 days for refrigerated samples, even though the sensory values do not support these results. Köse et al. (1999) found a fluctuation in pH values during refrigerated storage. The values were higher for the samples caught in February than for the samples caught in September, these values were also
higher than our results.
An acceptability limit of 106 colonies per gram
(6.0 log cfu/g) based on chemical and organoleptic properties have been proposed for fresh fish products (Huss, 1988; Aguilera et al., 1992). However, it was also reported that this value must be used cautiously because higher counts are quite normal in the tropical
fish (Huss, 1988) and counts of 108 may be tolerated
for bacterial population rendered “less active” by processing (Aguilera et al., 1992).
Even though there were significant variations between the batches, the bacterial results were above
acceptable limits after 1st day for ambient temperature
and 2nd day for refrigerated samples for both
mesophilic and pyschrophilic bacterial counts. These results were well correlated with the sensory values. Ababouch et al. (1991) found that bacterial counts for
sardines reached 5.108 cfu/g after 24 h of storage at
ambient temperature and 6.108cfu/g after 8 days of
storage in ice. In a study carried out by Ryder et al.
(1984), aerobic plate counts never exceeded 106 /g for
flesh of jack mackerel samples stored in ice during 11 days.
TMAO is generally present in seawater fish and it is the most commonly used chemical method for assessing fish quality. This is one of the volatile basic compounds that are found in very low levels in fresh fish, one that accumulates in spoiling marine fish, but
mainly is a result of bacterial reduction of
trimethylamine oxide (TMAO) (Magnússon and Martinsdóttir, 1995). This means that the analysis does not give any information about early autolytic changes or the degree of freshness, giving only indications of bacterial changes or degree of spoilage that occur much later (Huss, 1988; Ruiter, 1971). It has been recommended that quality cold-water fish contain less than 1.5 mg TMA-N/ 100 g fish, and 10-15 mg TMA-N / 100 g are usually regarded as the limit of acceptability for human consumption (Huss, 1988). Magnusson and Martinsdottir (1995) did not find TMA as useful for evaluating spoilage of thawed whole cod, cod fillet, and ocean perch. Smith et al. (1980b) observed that the TMA concentrations of gutted and ungutted blue whiting stored in ice and chilled seawater (csw) remain low over the first five to six days, thereafter the fish in csw showed the higher rates of increase on TMA concentrations.
TMA results analyzed from whiting samples showed higher values (excluding batch 2 for ambient temperature) for good quality fish and lower for unacceptable fish although sensory characteristics for both temperatures showed good quality. Therefore, according to sensory analysis, for whiting, the suitable acceptable limits for TMA can be suggested for whiting as 5 mg/100g.
There is also large species to species variation in
the development of TVB (Huss, 1988). The
concentration of TVB in freshly caught fish is typically between 5 and 20 mg TVBN/ 100 g flesh, whereas levels of 30-35 mg /100 g flesh are generally
regarded as the limit of acceptability for iced stored cold water fish (Kyrana et al., 1997). The TVBN values were agreed upon in both microbiological and sensory results in the acceptability of whiting samples. Therefore, TVBN criteria are suitable for estimating the spoilage degree of whiting samples stored at both temperatures.
TBA values represent the degree of the rancidity in the products, and the values above 3-4 mg malonaldehyde/kg indicate quality loss in the product (Karaçam and Boran, 1996). Scott et al. (1992) observed that the oil content of smooth oreo dory (Pseudocyttus maculatus) was very low and therefore TBA values did not change during 18 days of storage in ice. They also found that rancid odors or flavors were noted by less than 10% of the taste panel after 15 days storage in ice. Therefore, development of rancidity is slow and not a factor that limits the shelf life of smooth oreo dory stored in ice. In our study, although the lipid content was reported as 1.17 % ± 0.24 for whiting (Düzgüneú and Karaçam, 1990), the TBA values increased with spoilage. The levels
reached were above 4 mg after the 1st day of storage
for ambient temperature and after the 2nd day of
storage for refrigerator temperature.
Smith et al. (1980b) found that the post-spawning fish had a shorter chilled and ambient storage life in all media than in those caught in February and March. The April fish stored at ambient temperatures were only acceptable for 8 hours compared with 24 hours for the February and March fish. Gutting had a marked influence on the storage time of the February fish stored in csw (chilled sea water), the gutted fish having twice the chilled storage life of the ungutted fish. On the other hand, gutting the fish stored in csw changed every 24 hours during March had an adverse effect by almost having the storage life from seven days for the whole fish to four days for the gutted fish. The sensory results of the samples taken in February were similar to this study.
Our study showed that the acceptable limits for
physical and chemical parameters could vary
according to the species used. The results of sensory, bacteriological, and TVBN correlated well with each other. It can be concluded that although a lower
storage temperature decreases deterioration of
whiting, storage in a refrigerator without ice does not have a marked effect in extending the shelf life.
Despite the samples being kept in ice until
refrigeration, they were unacceptable on the 3rd day of
storage. The lower shelf life of the samples compared to other studies could be due to the possible effects of the factors mentioned above.
References
Ababouch, L., Afilal, M.E., Benabdeljelil, H. and Busta, F.F. 1991. Quantitative changes in bacteria, amino acids and biogenic amines in sardine (Sardina pilchardus) stored at ambient
S. Köse, M. E. Erdem / Turk. J. Fish. Aquat. Sci. 1 59-65 (2001) 65 temperature (25-28°C) and in ice. International
Journal of Food Science and Technology. 26: 297-306.
Aguilera, J.M., Francke, A. Figueroa, G., Bornhardt, C. and Cifuentes, A. 1992. Preservation of Minced Pelagic Fish by combined methods. International Journal of Food Science and Technology. 27: 171-177.
Anonymous, 1999. Fisheries Statistics. State Fisheries Statistics. Ankara, Turkey.
Boland, F.E., and Paige, D.D. 1971. Collaborative study of a method for the determination of trimethylamine nitrogen in fish. Division of Food Chemistry and Technology, Food and Drug Administration. Journal of the AOAC., 54 (3): 725-727.
Botta, J. R. 1995. Evaluation of Seafood Freshness Quality. VCH Publishers, Inc. UK. 180 pp. Bristow, P. 1992. The Illustrated Encyclopaedia of
Fishes. Chancellor Press. London. UK., 153 pp. Clucas, I.J. and Sutcliffe, P.J. 1981. An Introduction
to Fish Handling and Processing. Tropical Products Institute, London, 85 pp.
Collins, C.H., Lyne, P.M. and Grange, J.M. 1989. Collins and Lyne’s Microbiological Methods. Sixth Edition, Butterworths, London, 129-131. Curran, C.A., Nicoladies, L., Poulter, R.G. and Pors,
J. 1980. Spoilage of fish from Hong Kong at different storage temperatures. Tropical Science, 22: 367-382.
Düzgüneú, E. and Karaçam, H. 1990. Do÷u Karadeniz’deki mezgit (Gadus euxinus, Nord, 1840) balıklarında bazı populasyon parametreleri, et verimi ve biyokimyasal kompozisyon. Turkish Journal of Zoology. Türk Zooloji Dergisi, 14 (3) 345-353.
Food and Drug Administration (1978).
Bacteriological Analytical Manual. Food and
Drug Administration. US Association Official
Analytical Chemistry. Washington, DC.
Garthwaite, G.A. 1997. Chilling and freezing of fish. G.M. Hall (Ed.), Fish Processing Technology, Blackie Academic & Professional. London. 93-118.
Gram, L. 1992. Spoilage of three Senegalese fish species stored in ice and at ambient temperature.
E.C. Bligh (Ed.), Seafood Science and
Technology, Fishing News Books, 225-239. Graham, J., Johnston, W.A. and Nicholson, F.J.
(1992). Ice in Fisheries. FAO Fisheries
Technical Paper, No. 331, FAO, Rome, 75 pp. Huss, H.H. 1988. Fresh Fish, Quality and quality
changes. FAO Fisheries Series, No. 29. FAO. Rome, 132 pp.
ønal, T. 1992. Food Hygiene. Quality Control of Animal Food. Final Ofset A.ù., østanbul, Turkey. (In Turkish). 783 pp.
Karaçam, H. and Boran, M. 1996. Quality changes in frozen whole and gutted anchovies during storage at –18C. International of Journal of Food
Science and Technology, 31: 527-531.
Kyrana, W.R., Laugovois, V.P. and Valsamis, D.S. 1997. Assessment of shelf-life of maricultured gilthead sea bream (Sparus aurata) stored in ice. International Journal of Food Science and Technology, 32: 339-347.
Köse, S., Ay, S. and Kutlu, S. 1999. Hamsi, mezgit,
istavrit ve tirsi balıklarında buzdolabı
kosullarında depolanmaları sonucu meydana gelen kimyasal ve duyusal de÷iúimler üzerine bir araútırma. Veteriner Hekimler Derne÷i Dergisi, 70(3-4): 67-77.
Magnússon, H. and Martinsdóttir, E. 1995. Storage quality of fresh and frozen-thawed fish in ice. Journal of Food Science, 60(2): 273-278. Pedrosa-Menabrito, A.P. and Regenstein, J.M. 1990.
Shelf-extension of fresh fish. A review part III. Fish quality and methods of assessment. Journal of food Quality, 13: 209-223.
Ruiter, A. 1971. Trimethylamine and the quality of fish. Voedingsmiddelentechnologie, 2: (43) 1-10.
Ryder, J.M., Buisson, D.H., Scott, D.N. and Fletcher G.C. 1984. Storage of New Zealand Jack Mackerel (Trachurus novaezelandiae) in ice: Chemical, Microbiological and Sensory Assessment. Journal of Food Science, 49: 1453-1456.
Scott, D. N., Fletcher, G. C., Charles, J. C. and Wong, R.J. 1992. spoilage changes in deep water fish, smooth oreo dory during storage in ice. International Journal of Food Science and Technology, 27(5): 577-588.
Smith J.G.M., Hardy, R. and Young, K.W. 1980a. A seasonal study of the storage characteristics of
mackerel stored at chill and ambient
temperatures. Seasonal changes. Chapter 10. J.J. Connell (Ed.), Advances in Fish Science and Technology, Fishing News Books Ltd., England, 372-378.
Smith, J. G. M., Hardy, R., Thomson, A. B., Young, K.W. and Parsons E. 1980b. Some observations on the ambient and chill storage of blue whiting (Micromesistius poutassou). J.J. Connell (Ed.), Advances in Fish Science and Technology, Fishing News Books Ltd., England, 299-302. Smith, G., Hole M. and Hanson, S.W., 1992.
Assessment of lipid oxidation in Indonesian salted-dried marine catfish (Arius thalassinus). Journal of the Science of Food and Agriculture, 51: 193-205.
Sokal, R.R. and Rohlf, F.J. 1987. Introduction to
Biostatistics. 2nd edition, W.H. Freeman and
Company, New York, 349 pp.
Wignall, J. 1982. Handling wet fish on Shore. Fish. Handling and Processing. A. Aitken, I. M. Mackie, J. H. Merritt and M. L. Windsor (Eds.), Fish Handling and Processing. Second Edition. Ministry of Agriculture and Fisheries Food, Torry Research Station. Edinburgh, 42-55 pp.