• Sonuç bulunamadı

Low-temperature photoluminescence spectra of TlInxGa1-xS2 layer mixed crystals

N/A
N/A
Protected

Academic year: 2021

Share "Low-temperature photoluminescence spectra of TlInxGa1-xS2 layer mixed crystals"

Copied!
6
0
0

Yükleniyor.... (view fulltext now)

Tam metin

(1)

Pergamon &ie.r S&n& Ltd Printed in Great Britain. 0038-1098/95 $9.50 + XXI

0038-1098(!%)00037-2

LOW-TEMPERATURE PHOTOLUMINESCENCE SPECTRA OF TlIn,Gat_& LAYER MIXED CRYSTALS

K.R. Allakhverdiev* and N.M. Gasanlyt

Department of Physics, Middle East Technical University, 06531 Ankara, Turkey and

A. Aydinli

Department of Physics, Bilkent University, 06533 Ankara, Turkey

(Received 21 October 1994; accepted in revised form 22 December 1994 by R. Fieschi)

Low-temperature photoluminescence spectra ofTlIn&, T11n~,g5Gao~05Sz and TlIil,)sGa,-& layer crystals were studied in the temperature range

14-220K. The temperature dependencies of bands 2.374eV (A), 2.570 eV (E) and 2.576 eV (F) for TlIn$ are interpreted by supposing that the crystal undergoes structural phase transitions. Band A is considered to come from a donor-acceptor recombination channel. Keywords: A. semiconductors, A. ferroelectrics, D. optical properties, D. phase transitions, E. luminescence.

1. INTRODUCTION

IN THE LAST few years increasing interest has been shown to the study of the luminescence and non- linear properties of the layered crystal TIInSz [l-4]. A number of luminescence bands have been observed at 1.8 K and they were attributed to the recombination of free and bound excitons [l]. Second harmonic generation at successive phase transitions was reported in [2]. According to [2] a sequence of at least five phase transitions takes place in TlInSz with decreasing temperature: the transition from the paraelectric phase with C2/c symmetry to the incommensurate phase takes place at Tit = 216 K; ferroelectric phase transition with spontaneous polarization in the layer plane along the second order axis takes place at 200K. Besides the above mentioned transitions, TlIn& undergoes additional phase transitions: an incommensurate one at

Ti2 = 206 K, an antipolar one at T,, = 204K and a weak ferroelectric one at TCz = 79 K. The transition at TC2 = 79K was considered as isomorphic [2]. The

* On leave from the Institute of Physics, Azerbaijan Academy of Sciences, Baku, Azerbaijan.

t On leave from Baku State University, Baku, Azerbaijan.

photoluminescence bands were observed for 2.36 eV (A), 2.5 eV (B), 2.545 eV (D), 2.55 eV (E), 2.554eV (F) and 2.559eV (G) at 20K and for 2.54eV (C) at 10K [3]. The temperature dependencies of the intensities of these bands were interpreted by a variation in the crystal structure and the coexistence of several polytypes. The bands D, E, F and G were interpreted as due to excitons and the bands A and B were interpreted as due to non-local lattice defects. Among different thallium chalcogenides the proper- ties of TlIn$ were studied rather extensively [5]. However there are still many controversies regarding the interpretation of its physical properties. The most probable reason for this controversy is that TlIn& crystallizes in different polytypes [ 11.

2. RESULTS AND THEIR INTERPRETATION In the present paper we report the experimental results of the photoluminescence spectra of undoped TlIn!$ crystals excited at different temperatures and excitation intensities. The temperature dependencies of the luminescence spectra of TIIn,Gai_,S2 mixed crystals for compositions x = 0.95 and 0.8 are also reported in the temperature range 14-220K.

Undoped TlIn,Gai_& mixed crystals were grown by the modified Bridgman method [6].

(2)

778

460

I 1 1 I temperature range 220- 14 K are shown in Fig. 1. No

500 520 540 560 bands were observed at temperatures higher than Wavelength (nml z220K. At =220K (according to [2] at Tii = 216K the crystal undergoes a transition from the para- electric phase to the incommensurate one) a weak broad band appears at 2.39eV (band H). The peak intensity of this band increases with decreasing temperature and the band shifts to higher energies

3 1 I I (Fig. 2). No noticeable changes were observed in

spectra down to temperature T = 60 K. At T = 60 K a new broad band appears at 2.31 eV (band A). With decreasing temperature the intensity of this band increases and band shifts to higher energies. Almost

A at the same temperature new structures appear at the

6

&

high energy side of the spectra. These bands are named according to [3] as: 2.374 eV (A); 2.570 eV (E); 2.576eV (F) at 14K. From the temperature depen- dencies described above, one can suppose that the phase transitions occur in TlInS2 at temperatures

7 near 220K and 60K.

. When comparing our results with that published in [3] one can see noticeable differences:

6

. (1) We did not observe bands B (2.5eV) and C (2.54 eV).

\ - 5 (2) The temperature dependence of band A

(2.374eV) was completely different. In our spectra

J I I I

400 500 520 540 560 this band grew in intensity with lowering of the temperature. According to [3] the intensity of this line Wavelength (nm) decreased with decreasing temperature.

Fig. 1. Photoluminescence spectra of TlInS* crystal at (3) All the bands observed in the present work different temperatures: (a) 1, 2, 3, 4 - 220, 180, 150, were slightly shifted to the blue side of the spectra in 120 K; (b) 5, 6, 7, 8 - 60, 45, 20, 14 K. Excitation comparison with that published in [3].

density for (a) and (b) I0 = 9 W cm-*. The intensity of

bands shown in (b) is about ten times stronger than We attribute this controversy mainly to the that shown in (a). different kind of polytypes studied in [3] and in the LOW-TEMPERATURE PHOTOLUMINESCENCE SPECTRA Vol. 94, No. 9 Crystals suitable for measurements were obtained by easy cleavage along the (0 0 1) plane perpendicular to the optical c-axis. In the photoluminescence measure- ments samples of a typical size 6 x 6 x 2mm3 were used. The photoluminescence, excited by the 476.5 nm line of a Spectra-Physics argon ion laser, was investigated from the side of the laser-illuminated surface of the samples in a direction close to the normal to the layers. A “CT1-Cryogenics M-22” closed-cycle helium cryostat was used to cool the crystals. The temperature was controlled within an accuracy of f 1 K. The photoluminescence spectra in the wavelength range 477-560nm were analysed using a U-1000 “Jobin Yvon” double grating spectrometer and a cooled GaAs photomultiplier supplied with the necessary photon counting electronics.

(3)

2.6 1 I I I

Temperature (K)

Fig. 2. Energy positions of the photoluminescence bands of TlIn,Gal_,S2 mixed crystals vs temperature under excitation density 1, = 9 W cm-*. 0, x = 1; 0, x = 0.95; A, x = 0.8. Lines are only a guide for the eye.

present work. In case of GaSe, for example, the difference in the band gap of the P- and e- modifications is about 50meV [7]. According to [3] band A may originate from lattice defects causing a distortion or deformation of the lattice or from uncontrolled impurities. Our results are in accor- dance with such a point of view. The temperature and density behavior of band A are very similar to those of bands ai and $i, which was published for the layered crystal Case [8] and may be due to a donor- acceptor recombination channel favoured by low pumping power and high defect (impurity) content. It seems that the electron-hole recombination in the case of TlInS, can take place via two competing channels, the first one involving the exciton states and the second one the donor and acceptor states. Due to the wide band gap of TlIn$ (x2.58 eV at 14K) a third recombination channel may also exist involving the lowest electron traps and acceptor states. The existence of these three recombination channels is well supported by the results of electrical and photoelectrical measurements in TlIn$ [9- 1 I] and the optical results reported in [12].

With substitution of a part of the In%, complexes in TlIn!$ by Gas4 complexes, i.e. in TlIn,Ga,_& mixed crystals, the phase transition at 220K (for

pure TlIn$) is displaced towards lower temperatures: at 170K (for x = 0.95) and at 90K (for x = 0.8) (Fig. 2). This result is in agreement with that obtained in [13] where the temperature dependence of the IR reflection was measured. No luminescence was observed for crystals with composition TlIno,7Ga,-&. In [14] by studying the Raman spectra of mixed crystals TlIn,Gal_,S2 under pressure it was shown that the crystals with 0 5 x 5 0.6 have the structure of TIGaS2. The absence of luminescence for crystals with x = 0.7 may be due to the fact that for this composition a highly disordered system is formed. The other possibility is the concentration quenching of the luminescence with increasing Ga content in mixed crystals.

An interesting feature was observed when study- ing the intensities of the bands of TlInS* at a tied temperature (T = 14K) vs the excitation density in the high energy side of spectra (Fig. 3). At low excitation density (0.27 W cm-‘) four bands were observed: 2.547eV (D), 2.570eV (E), 2.576eV (F) and 2.581 eV (G) and 2.565 eV (E’) as a weak shoulder. With increasing excitation density the intensities of all bands increased. The intensities of the weak shoulder (E’) and band D were too low to be reliably analyzed with increasing excitation

(4)

780 LOW-TEMPERATURE PHOTOLUMINESCENCE SPECTRA Vol. 94, No. 9

Wavelength (nm)

Fig. 3. Photoluminescence spectra of TlInS2 crystal at

T = 14 K at various excitation densities: 1, 0.027; 2, 0.135; 3, 0.27; 4, 1.17; 5, 2.25; 6, 3.6; 7, 4.5; 8, 6.3; 9, 9 W cmm2. Note that the first three spectra have been multiplied by a factor of 20.

density. That is why we considered only density dependencies for E, F, and G bands. With increasing excitation density the intensities of all three bands

increased u to 1.17 W cmm2. At a density of about 2.25 W cm- P band G appeared as a weak shoulder on the high energy side of the triplet and only the two bands F and E were well resolved, the intensity of band E being higher than that of band F. At about 6.3 W cme2 the intensity of both bands are almost the same. Further increase in the excitation density results in a redistribution of the intensities of these two bands; the intensity of band E becomes also lower than that of band F. These bands can originate from excitons in different TlInS2 polytypes.

Dependencies of the luminescence intensity vs the excitation power for T11nS2 at 14K are shown in Fig. 4. It is worthwhile to note that all the density experiments in the present work were performed for low excitation densities at which the excitonic interaction was not screened and the system did not become metallic. We used the formula given in [15] nM M 3/47&, where Q, is the exciton Bohr radius, and the value of czX = 23A for TlIn$ given in [16], and obtained nM M 2 x 10¹⁹ cmw3. This estimation showed that at the highest density used for exciting T11nS2 in our work (9 Wcme2) the density of excited electron-hole pairs was not more than N M 10” cme3, which is much lower than the Mott limit. It was found that the relative intensities of all photoluminescence lines were not depending on the excitation density at 14 K up to 9 W cme2. This result is in agreement with that published in [3] and also denies the possibility of the appearance of molecular excitons.

3. CONCLUSIONS

In conclusion, the largest change in the photo- luminescence spectra of T11nS2 with the temperature occurs at about 220K at which this crystal has an incommensurate phase with qi = (S; 6; 0.25) [5]. A low-temperature structural transformation at about 60 K induces the appearance of a new broad band at 2.31 eV (A). Substitution of In%, complexes in TlInS2 by GaSa [T11n,Gai_,S2 mixed crystals (x = 0.95, 0.8)] results in a displacement of the phase transition at 220K (x = 1) to lower temperatures: 170 K (x = 0.95) and 90K (X = 0.8). No luminescence was observed for TlIn,Gai_,S2 mixed crystals with x = 0.7.

(5)

Vol. 94, No. 9 LOW-TEMPERATURE PHOTOLUMINESCENCE SPECTRA

r I I 1 I I

lcl-2

10-l I

Excitation Density (W/cm21

IO

Fig. 4. Dependence of the photoluminescence intensity on the excitation density for TIInS, crystal at T = 14 K for different bands: l , A; 0, E; A, F; A, G. Lines are only a guide for the eye.

Acknowledgement - One of the authors (N.M.

Gasanly) acknowledges the financial support of The Scientific and Technical Research Council of Turkey (TUBITAK).

REFERENCES

1. G. Abdullaev, G. Abutalybov, A. Aliev, L. Larionkina, I. Neiman-zade & E. Salaev, JETP

Lett. 38, 632 (1983).

2. F. Salaev, R. Fischer, D. Haarer & K. Allakhverdiev, Ferroelectrics (submitted). 3. T. Arai, J. Aoyagi, Y. Maruyama, S. Onari, K.

Allakhverdiev & E. Bairamova, Japan J. Appl.

Phys. 32, Suppl. 32-3, 754 (1993).

4. M. Hanias, A. Anagnostopoulos, K. Kambas 8z J. Spyridelis, Physica B160, 154 (1989).

5. K. Allakhverdiev, T. Mamedov, B. Akinoglu & S. Ellialtioglu, Turkish J. Phys. 18, 1 (1994). 6. N. Gasanly, A. Goncharov, N. Melnik, A.

Ragimov & V. Tagirov, Phys. Status Solidi (b)

116, 427 (1983).

7. Landolt-Bornstein, Zuhlenwerte und Funk-

tionen UUS Nuturwissenschuften und Technik.

Festkcrperphysik, Band 17, Halbleiter, p. 530.

Springer Verlag, Berlin ( 1983).

8. J. Voitchovsky & A. Mercier, Phys. Status

Solidi (a) 18, 545 (1973).

9. M.P. Hanias, A.N. Anagnostopoulos, K. Kam- bas & J. Spyridelis, Mat. Res. Bull. 27,25 (1992).

(6)

782 LOW-TEMPERATURE PHOTOLUMINESCENCE SPECTRA Vol. 94, No. 9 10. N. Kalkan, M.P. Hanias & A.N. Anagnosto-

poulos, Mat. Res. BUN. 27, 1329 (1992). 11. N. Kalkan, D. Papadopoulos, A.N. Anagnos-

topoulos & J. Spyridelis, Mat. Res. Bull. 28,693

(1993).

12. J.A. Kalomiros & A.N. Anagnostopoulos,

Whys. Rev. B50, 7488 (1994).

13. S. Nurov, V. Burlakov, E. Vinogradov, N.

Gasanly & B. Dzhavadov, Phys. Status Solidi

(b) 137, 21 (1986).

14. E. Bairamova, K. Allakhverdiev, B. Akinoglu, T. Arai & T. Mamedov, Turkish J. Phys. 18,

497 (1994).

15. N. Mott, Phil. Mag. 6, 287 (1961).

16. G. Abutalybov, S. Abdullaeva & N. Zeinalov,

Şekil

Fig.  1. Photoluminescence  spectra  of  TlInS*  crystal  at  (3)  All  the  bands  observed  in  the  present  work  different  temperatures:  (a)  1, 2,  3,  4  -  220,  180,  150,  were  slightly  shifted  to  the  blue  side  of  the  spectra  in  120
Fig.  2. Energy  positions  of  the  photoluminescence  bands  of  TlIn,Gal_,S2  mixed  crystals  vs temperature  under  excitation  density  1,  =  9 W cm-*
Fig.  3. Photoluminescence  spectra  of  TlInS2  crystal  at  T =  14 K  at  various  excitation  densities:  1, 0.027;  2,  0.135;  3,  0.27;  4,  1.17;  5,  2.25;  6,  3.6;  7,  4.5;  8,  6.3;  9,  9 W cmm2
Fig.  4. Dependence  of  the  photoluminescence  intensity  on  the  excitation  density  for  TIInS,  crystal  at  T  =  14 K  for  different  bands:  l  ,  A;  0,  E;  A, F;  A,  G

Referanslar

Benzer Belgeler

This was the main motivation for Carlson to study the productive elements since, when there is a product structure on H ∗ (D ∞ ζ ), it is easier to calculate the differentials in

Çalışmamızda İİAB ve core iğne biyopsi yöntemiyle elde edilen histolojik materyallerin benignite, malignite ve yetersizlik oranlarının, tiroid bezi nodül boyutlarından,

Süeda tanesi 20 kuruş olan kalemlerden 43 tane almıştır. Azra, Alihan' dan 9 yaş küçük olduğuna göre Azra kaç

Burada Yaşar Kemal, yöresel değil de evrensel bir yazar ol­ duğunu kanıtlıyor. Yerleşecek yer arayan Türkmen topluluk­ larının bn dur durak bilmeyen

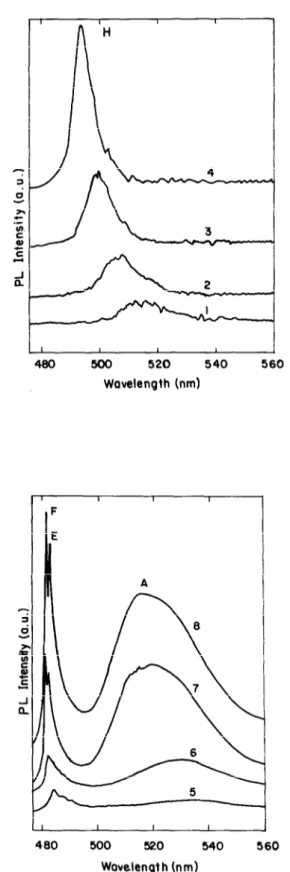
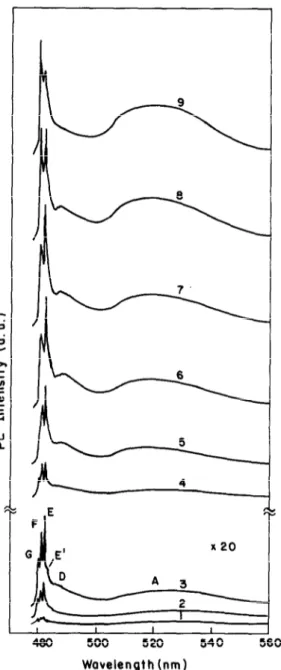
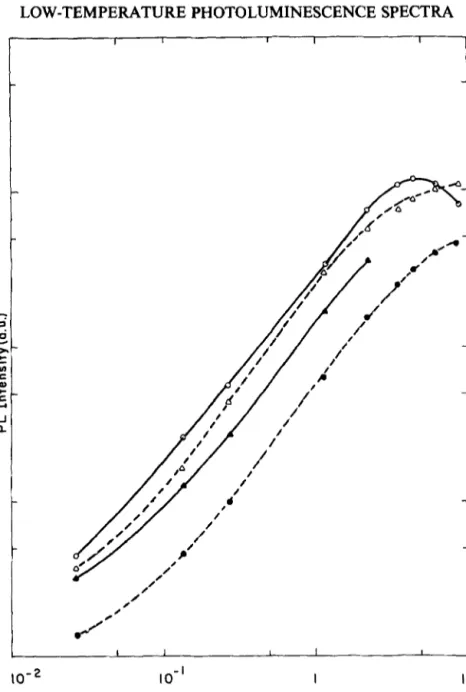
Our analysis shows that the peak energy positions of the observed bands do not shift with increasing laser excitation intensity in line with the fact that the states involved in

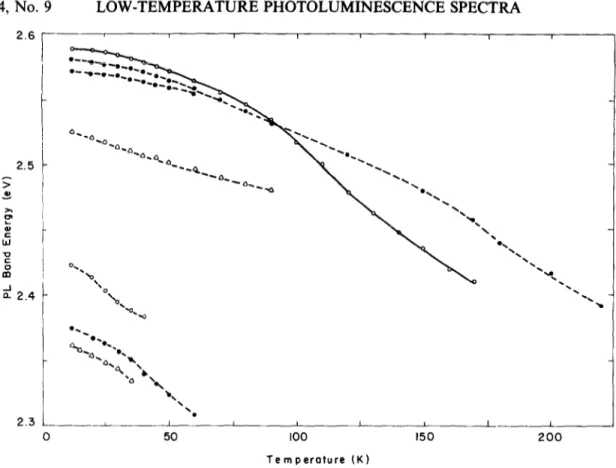
The analysis of the PL spectra as a function of temperature and excitation laser intensity allows one to obtain a possible scheme for the donor} acceptor levels located in the

[r]

However, for improved energy efficiency of VLP systems, the total power consumption of LEDs must also be taken into account in addition to localization performance requirements