THE EXPRESSION OF BCL-2 FAMILY OF GENES
DURING LIVER REGENERATION
A THESIS SUBMITTED TO
THE DEPARTMENT OF MOLECULAR BIOLOGY AND GENETICS AND THE INSTITUTE OF ENGINEERING AND SCIENCE OF
BILKENT UNIVERSITY
IN PARTIAL FULFILLMENT OF THE REQUIREMENTS FOR THE DEGREE OF MASTER OF SCIENCE
BY AHMET UCAR SEPTEMBER 2001
ii
I certify that I read this thesis and that in my opinion it is fully adequate, in scope, and in quality, as thesis for the degree of Master of Science.
Assist. Prof. K.Can Akcali I certify that I read this thesis and that in my opinion it is fully adequate, in scope, and in quality, as thesis for the degree of Master of Science.
Assoc. Prof. Alp Can
I certify that I read this thesis and that in my opinion it is fully adequate, in scope, and in quality, as thesis for the degree of Master of Science.
Assist. Prof. Cengiz Yakicier Approved for Institute of Engineering and Science.
Prof. Dr. Mehmet Baray
iii
ABSTRACT
THE EXPRESSION OF BCL-2 FAMILY OF GENES DURING LIVER
REGENERATION
Ahmet UCAR
M.S. in Molecular Biology and Genetics Supervisor: Assist. Prof. Kamil Can Akcali
September 2001
Hepatic regeneration is a process that includes cellular proliferation and cellular death. Apoptosis is the main tool for the organism to control the death in order to prevent the destruction of the tissues, and maintain the homeostasis. The main regulators of apoptotic machinery are the Bcl-2 family proteins, which act mainly on mitochondrial control of death pathway. We used both 40% and 70% partial hepatectomy groups, and investigated the expression patterns of bcl-2 family members (bcl-2, bcl-xL, bcl-w, bax, bak, bid, and mtd) in transcript levels within a
time spectrum that extends to 14 days, which is required for the completion of the regeneration process. We used semi-quantitative PCR technique, and compared the results with the sham operation groups as a negative control. With this comparison, we were able to understand the regeneration-induced changes in transcript levels of the genes studied. Our results demonstrated that, the regeneration process had a time-dependent and tight regulation in the 70% partial hepatectomy groups, whereas this was not the case for 40%. However, we also found that surgery itself caused changes in the expression of these genes. Therefore, we think that these changes might not only due to regeneration, but also due to surgery.
iv
ÖZET
KARACİĞER REJENERASYONU SIRASINDA BCL-2 GEN AİLESİ ÜYELERİNİN EKSPRESYONLARI
Ahmet UCAR
Moleküler Biyoloji ve Genetik Yüksek Lisans Tez yöneticisi: Yard.Doç.Dr. Kamil Can Akçalı
Eylül 2001
Karaciğerde rejenerasyon mekanizması hücre bölünmelerini ve ölümlerini içerir. Apoptozis, programlı hücre ölümü, organizmanın kendi dengesinin bozulmasını engelemek amacıyla kullandığı en önemli araçtır. Apoptozis mekanizmasının kontrolü, temel olarak mitokondri üzerinden fonksiyon gösteren Bcl-2 protein ailesi üyelerince yapılır. %40’lık ve %70’lik kısmi karaciğer rezeksiyonu gruplarında
bcl-2 gen ailesi üyelerinin (bcl-bcl-2, bcl-xL, bcl-w, bax, bak, bid, ve mtd) mRNA
ekspresyonlarını, rejenerasyonun tamamlanması için gerekli olan ameliyattan sonraki 14 güne kadar uzanan bir zaman dilimi içinde inceledik. Semi-quantitative PCR tekniğini kullanarak elde edilen sonuçları kontrol grubu olarak hazırladığımız sham operasyonu yapılmış grupların sonuçları ile karşılaştırdık. Buna göre %40’lık kısmi karaciğer rezeksiyonu gruplarında rejenerasyon olayının, %70’liklerde olduğu gibi zamana bağlı olarak sıkı kontrol edilmediğini saptadık. Ancak cerrahi operasyonun kendi başına bizim incelediğimiz genlerde önemli seviyelerde ekspresyon değişimlerine sebep olduğundan %70’lik gruplardaki ekspresyon değişimlerinin sadece rejenerasyon olayından dolayı değil, aynı zamanda ameliyatın etkilerinden dolayı da kaynaklandığını düşünmekteyiz.
v
TABLE OF CONTENTS
Page
SIGNATURE PAGE ...ii
ABSTRACT ...iii
ÖZET... iv
TABLE OF CONTENTS ... v
LIST OF TABLES ...viii
LIST OF FIGURES... ix
ABBREVIATIONS... x
1. INTRODUCTION... 1
1.1. Liver as an organ ... 2
1.2. Liver regeneration ... 4
1.2.1. History of studies on liver regeneration ... 4
1.2.2. Kinetics of hepatic regeneration... 6
1.2.3. Extracellular factors in control of hepatic regeneration ... 8
1.2.4. Liver regeneration & apoptosis ... 10
1.3. Cell death: Apoptosis and necrosis... 10
1.3.1. Apoptosis: An evolutionary conserved mechanism ... 12
1.3.2. Apoptotic pathways ... 12
1.3.2.1. Death receptors... 13
1.3.2.2. Mitochondria ... 13
1.3.2.3. Caspase cascade... 15
vi
1.4. Bcl-2 family of regulators of apoptosis ... 17
1.5. Liver regeneration & Bcl-2 family ... 22
1.6. Importance of liver regeneration studies ... 23
1.7. Aim of Study ... 24
2. MATERIALS AND METHODS ... 26
2.1. Animals ... 27
2.2. Standard solutions and buffers ... 27
2.3. Clonings... 27
2.3.1. Primer design... 27
2.3.2. Total RNA isolation from tissue samples... 28
2.3.3. Determination of RNA concentration by spectrophotometry30 2.3.4. Denaturing Agarose Gel Electrophoresis... 30
2.3.4.1. Preparation of the gel (1.2%) ... 30
2.3.4.2. Preparation of the samples for loading ... 31
2.3.5. RT-PCR ………31
2.3.6. Polymerase Chain Reaction (PCR)………. 32
2.3.7. Ligation………32
2.3.8. Cacl2-Transformation of E.Coli………...34
2.3.9. Miniprep (Small-Scale Preparations of Plasmid DNA)…34 2.3.10. Restriction Enzyme Digestion Of DNA………...35
2.3.11. Midiprep (Large-Scale Preparations of Plasmid DNA)…35 2.4. Partial Hepatectomy And Dissection………36
2.4.1. 40 % Partial Hepatectomy………36
vii
2.4.3. Sham Operation………37
2.4.4. Experimental Groups………37
2.4.5. Mass Graphs……….39
2.5. Total RNA Isolation……….39
2.6. RT-PCR………40 2.7. Semi-Quantitative PCR………40 2.7.1. Primer Design………...40 2.7.2. Semi-Quantitative PCR Optimizations……….42 2.7.3. Semi-Quantitative PCRs………...42 2. RESULTS………..………...43 3.1. Introduction………44 3.2. Clonings……….45
3.3. Results Of Partial Hepatectomy………49
3.3.1. Mass Curves……….. 49
3.3.2. RNA Isolation And RT………52
3.3.3. Semi-Quantitative PCR………52 3.3.3.1. Semi-Quantitative PCR Optimizations………52 3.3.3.2. Semi-Quantitative PCR………57 3. DISCUSSION………...66 4.1. Discussion……….67 4.2. Future Perspective………73 4. REFERENCES……….75
viii
LIST OF TABLES
Pages Table 2.1. The oligonucleotide sequences used in clonings……… 29 Table 2.2. Oligonucleotide sequences used in semi-quantitative PCR reactions.. 41 Table 3.1. The optimized conditions for the semi-quantitative PCRs……… 56
ix
LIST OF FIGURES
Page Figure 1.1. The subfamilies of Bcl-2 family and homology domains
(BH domains) within the family……….. 18 Figure 2.1. The maps of the pGEM-T and pGEM-T Easy vectors………… 33 Figure 2.2. The liver resection surgery for partial hepatectomy………. 38 Figure 3.1. Integrity check of RNA samples on denaturing agarose gel……. 46 Figure 3.2. PCR production of the gene fragments………. 47 Figure 3.3. Alignment of the sequencing results with the sequence of the corresponding gene’s mice homologue………... 48 Figure 3.4. Mass graphs for 40% and 70% PH groups……… 51 Figure 3.5. The integrity check of RNA samples on denaturing agarose gel...53 Figure 3.6. Semi-quantitative PCR optimizations………. 54-55 Figure 3.7. The semi-quantitative PCR results for the 70% PH group…….. 58 Figure 3.8. The semi-quantitative PCR results for the Sham group……….. 59 Figure 3.9. Results of semi-quantitative PCR for 40% PH groups………… 60 Figure 3.10. Relative transcript level vs. time graphs(70% PH and Sham)… 61 Figure 3.11. Graphs of time vs. liver regeneration induced changes in
x
ABBREVIATIONS
AIF : Apoptosis Inducing Factor
ANT : Adenine Nucleotide Translocator ATP : Adenosine Triphosphate
BH : Bcl-2 Homology bp : base-pairs
cDNA : complementary DNA
dATP : Deoxyadenosine triphosphate ddH2O : deionized water
DEPC : Diethylpyrocarbonate
DMEM : Dulbecco’s Modified Eagle Medium DNA : Deoxyribonucleic acid
DNases : Deoxyribonucleases GIFs : Growth Inhibiting Factors gr : gram
GSFs : Growth Stimulating Factors HCC : Hepatocellular Carcinoma hr : Hour
IPTG : Isopropylthio-b-D- galactoside kb : kilobase
KDa : KiloDalton lt : liter
xi mg : miligram
ml : mililiter
mRNA : Messenger RNA ng : nanogram
nm : nanometer O.D. : Optical Density
PCR : Polymerase Chain Reaction PH : Partial Hepatectomy
pmole : picamole
PTP : Permeability Transition Pore RNA : Ribonucleic acid
Rnase : Ribonuclease rpm : revolution per minute rRNA :ribosomal RNA RT : Reverse Transcription
TNF-α : Tumor Necrosis Factor-α
TNFR 1 : Tumor Necrosis Factor Receptor 1 TUNEL : Terminal d-UTP Nick End-Labeling U.V. :Ultra-violet
ug : microgram ul : microliter
VDAC : Voltage-Dependent Anion Channel
1.1. Liver as an organ
Liver is the largest organ in the body and has a central role in metabolic functions that are essential for survival.
Liver is developmentally derived from the endoderm. The hepatic diverticulum is the tube of endoderm that extends out from the foregut into the surrounding mesenchyme. And mesenchyme induces this endoderm to proliferate, branch and form the glandular epithelium of the liver during early organogenesis (Gilbert S.F., 2000).
The functional basic unit of the liver is the lobule. The lobule is composed of many hepatic cellular plates that radiate centrifugally from the central vein like spokes in a wheel. Each hepatic plate is usually two cells thick, and between the adjacent cells lie small bile canaliculi that empty into bile ducts in the fibrious septa separating the adjacent liver lobules (Guyton and Hall, 1996).
The major cell type in the liver is hepatocytes that are called as parenchyme cells. The %80 of the liver is composed of hepatocytes and has less differentiated cells compared to the other organs. These features make liver a perfect system to work on organogenesis.
But other than the vascular structures and hepatocytes, there are typical endothelial cells and large Kupffer cells, which lined through the venous sinusoids. They are referred as non-parenchyme cells. Kupffer cells are type of macrophages that are capable of phagocytizing bacteria and other foreign matter in the hepatic sinus blood. Also the lymphatic system is connected to the system through the tissue structures called space of Disse (Guyton and Hall, 1996).
A defect in the liver’s function can not be replaced by any other organ. Although, liver is not a proliferative organ in normal cases, it responds to alterations
in order to correct the defects in its functions. That’s why, during evolution liver gained a high capacity of regeneration.
The basic functions of liver can be categorized such as; (1) endocrine functions; (2) digestive functions; (3) metabolic functions; and (4) excretory and degradetive functions (Guyton and Hall, 1996; Vander et.al., 1994).
Major endocrine functions of the liver are as follows; it secretes insulin-like growth factor-I , which promotes growth by stimulating mitosis in various tissues, including bone; it contributes to the activation of Vitamin D; it secretes angiotensinogen, which is acted upon by renin to form angiotensin; and it metabolizes most of the hormones.
Liver has important functions in digestive physiology. It synthesizes and secretes bile acids, which are necessary for adequate digestion and absorption of fats. In addition, liver secretes a bicarbonate-rich solution of inorganic ions into the bile, which helps neutralize acid in the duodenum (Guyton and Hall, 1996).
Liver has several metabolic functions concerned with the majority of the metabolic systems of the body. It converts the plasma glucose into glycogen and triacylglycerols during absorptive period; converts plasma amino acids to fatty acids, which can be incorporated into triacylglycerols during absorptive period; converts fatty acids into ketones during fasting; synthesizes cholesterol and releases it into the blood; and secretes plasma cholesterol into the bile (Vander et.al., 1994).
Liver secretes bilirubin and other bile pigments into the bile and via the bile, it excretes many endogenous and foreign organic molecules as well as trace metals. It functions also in destroying old erythrocytes.
All the iron in the body is stored in liver in addition to the erythrocytes within the structure of hemoglobin. Also liver filtrates the blood coming from intestines, which is contaminated by many bacteria and other foreign organisms.
1.2. Liver regeneration
1.2.1.History of studies on liver regeneration
The first mention of hepatic regeneration can be traced to the Greek legend of Prometheus. However, it was only toward the end of the 19th century that the first experimental observations were performed on laboratory animals. In these studies, they demonstrated complete restoration of hepatic mass following either a partial hepatectomy (PH) or a sub lethal hepatic injury induced by chloroform (Von Podwyssozki, 1886; Ponfick, 1890).
A landmark event in the field of hepatic regeneration occurred when Higgins and Anderson (1931) standardized the procedure of partial hepatectomy using rat. This model rapidly became the most frequently utilized in vivo system to examine the process of liver regeneration. The second series of landmark observations in this field were done by Christensen and Jacobsen (1949), Bucher et al.(1951), and Fisher et al.(1971) by utilizing parabiotic rats. And also by using autografts, Leong et al.(1964) and Segal et al.(1968) have found out that the factors initiating the process of hepatic regeneration are blood borne. Earlier experimental studies by Teir and Ravanti (1953) and Blomqvist (1957), which suggested that the factors initiating the hepatic regeneration might be synthesized by the liver itself, led to a variety of theories concerning the regulation of hepatic regeneration. The most important of these theories suggested the existence of both growth stimulating factors (GSFs) and
growth inhibiting factors (GIFs). After that, many attempts have been made during 1970’s and 1980’s to isolate both kinds of these factors.
The most popular alternative hypotheses to the concept of GSFs and GIFs concerning the regulation of hepatic regeneration were (1) the metabolic overload theory (Goss, 1964; Alston and Thomson, 1966), in which the liver was believed to increase its mass to satisfy a specific need, and (2) the blood flow theory (Mann, 1944; Child et al., 1953; Weinbrein et al., 1975), in which the amount of blood delivered to the liver, particularly via the portal vein, determined the hepatic mass. Insulin was recognized as an important hepatothrophic substance responsible for liver regeneration in the studies, which are directed at assessing the latter hypothesis (Starzl et.al.1976). And this finding represents the third landmark in the long history of hepatic regeneration and its control. Several hormones other than insulin were also shown to have some affect in stimulating liver regeneration, although not as much as insulin.
In the mid-1970’s, the development of the primary hepatocyte cultures provided an important new in vitro model for the study of hepatic regeneration under highly controlled laboratory conditions (Leffert et al., 1978; Maher, 1988). Using cell culture systems, it was quickly noted that the processes regulating liver cell growth observed in vivo and those noted in vitro were different, presumably because liver cells in culture lack the complex interactions which occur in vivo between hepatocytes and non-parenchymal cells (Fraslin et.al., 1985). Some other studies also demonstrated that the critical interactions also occur between liver cells and the matrix upon which the liver cells were plated, and that these interactions influence the functional and replicative activity of hepatocytes maintained in the culture (Bissell and Choun, 1988).
In the 1980’s, the techniques of molecular biology had allowed the investigators to define more clearly the molecular events occurring in proliferating hepatocytes, like alterations in oncogene expression, the timing of growth factor and hormone expression and both qualitative and quantitative changes in the intracellular content of proteins that are important in the process of cell growth and replication.
In 1990’s, with the accumulation of knowledge about the involvement of rapidly growing spectrum of genes tested in the control of liver regeneration, many hypothesis and theories were generated. With the development of transgenic and knock-out technologies, several of the genes, whose expression was shown to be changing during the regeneration of liver, were tested for the significance of these genes (Fausto et.al.,1999).
1.2.2. Kinetics of hepatic regeneration
Under normal circumstances, the proliferative activity of hepatocytes in adults is very low, and only a few cells can be shown to proliferate. These proliferating cells are typically found near the portal tracts, closer to the incoming portal blood (Grisham, 1962).
For rats, in normal conditions, the labeling index of hepatocytes 2hr after an i.p. administration of [3H]-thymidine is 0.3% (Grisham, 1962; Edwards and Koch, 1964). Under steady-state conditions, non-parenchymal cells have even lower proliferation rates than that observed for hepatocytes. After 60 hr of continuous administration of [3H]-thymidine, Kuppfer cells and endothelial cells have a labeling index of only 3 and 7%, respectively, for rats (Bouwens et.al., 1986).
However, when a surgical resection or hepatic injury, induced either by a viral illness or chemical injury that reduces the functional mass of the liver, these
proliferation rates change very dramatically. During the regenerative response that follows any major hepatic injury, virtually all of the surviving hepatocytes undergo mitosis. In fact, if the residual liver of a partially hepatectomized rat is infused with [3H]-thymidine for the 7 to 8 day required for the hepatic mass to be restored fully, 95% of the liver cells will be found to contain the label (Sell, 1990; Fausto, 1990).
In rats, the hepatic regenerative response following partial hepatectomy starts in an almost synchronous manner in the peripheral part of the lobule, producing a peak of DNA synthesis after about 18hr. Almost all the remaining hepatocytes of the liver progressively proliferate (Rabes et. al., 1975; Bucher and Malt, 1971). And these observations suggest that under physiological conditions resting hepatocytes are arrested in the G0 phase of the cell cycle (Bucher and Malt, 1971). After a partial
hepatectomy in rats, hepatocyte DNA synthesis starts after a lag phase of 12hr and reaches a peak within 6hr. In contrast, the peak mitotic activity of non-parenchymal cells is delayed, and occurs at 48hr and 96hr (Widmann and Fahimi, 1975).
A post-hepatectomy-induced proliferative response leads to full restoration of the hepatic mass in rats in about 10 days. For larger animals and man, full restoration of hepatic mass requires a longer period of time like 2 or 3 weeks (Bucher and Malt, 1971; Fausto et.al., 1986).
The kinetics of hepatic regeneration described above are those observed in young adult animals. In weanling rats, the peak of DNA synthesis is achieved 3hr earlier, while in older rats it is delayed by about 5hr (Bucher et al., 1964). Moreover, a regenerative response occurs, when at least 30% of the liver mass is removed in young adult rats. In very young and in aged rats, a 10% reduction also suffices to trigger a regenerative response probably because the functional reserve of the liver is different for each of these age groups (Bucher et al., 1964). The proliferative
response is influenced also by the feeding or light exposure pattern of the animal as both of these factors modulate the circadian rhythms of the animals (Bucher and Malt, 1971).
1.2.3. Extracellular factors in control of hepatic regeneration.
Many factors have been identified in the control of hepatic regeneration. These are mainly categorized in two groups as hormones and growth factors.
Numerous changes in circulating hormone levels have been reported in rats following PH. Many of these changes have been characterized and appear to correlate with measurable alterations in the hepatocyte expression of receptors for these hormones. However, in vitro only some of them can be shown to amplify the proliferative response when added to a culture system containing medium with these growth factors. The significance of the findings were almost certain since their effects were confirmed either by using the anti-hormone drugs, chemicals or peptides, or by the removal of the organ responsible for the production and excretion of that hormone into the bloodstream.
In very different experimental setups, insulin and glucagon were shown to be very critical for the control of the hepatic regeneration (Thrower and Ord, 1974; Yaunger et.al., 1966). Although insulin does not stimulate hepatocyte proliferation directly in vitro, its effect on hepatocyte proliferation appears to depend upon its metabolic effects. The precise role of the glucagon in the process remains also controversial because of the difficulties encountered in defining its role, either alone or in conjunction with insulin, as a hepato-proliferative factor (Caruana et.al., 1981).
Following a PH, striking alterations in the blood levels of sex hormones occur and accompanying changes in the hepatic content of sex hormone receptors appear
within the liver. Serum estradiol levels increase, while the hepatic content of estrogen receptors also increases. In contrast, serum androgen levels decline in concert with a rapid disappearance of androgen receptors within the liver. These changes in the hormone receptor level in the liver occur only in male rats, and are accompanied by a reduction in the hepatic levels of other testosterone-inducible enzymes that metabolize estrogens. This process of the increase in serum estradiol level, an increase of estrogen receptor and a reduction of estradiol metabolizing enzyme system has been termed hepatic ”feminization” and appears to be a critical step in the overall process of hepatic regeneration for male animals (Eagon et.al.,1985; Francavilla et.al., 1986).
Thyroid hormone, norepinephrine, and vasopressin were also demonstrated to be critical for the control of the hepatic regeneration in rats. Thyroidectomy results in a reduction of regenerative response to a PH, when performed 7 days prior to PH (Canzanelli et.al. 1949). And just 2 hr after a PH, the blood levels of norepinephrine shown to be increased substantially (Cruise et.al., 1987). Both in vitro and in vivo, vasopressin was shown to act synergistically with other hormones to promote hepatocyte DNA synthesis. Furthermore, the regenerative response following PH was shown to be impaired in the Battleboro rat, which is vasopressin-deficient, and exogenous administration of vasopressin to these rats enhances the hepatic regenerative response to PH (Russell and Bucher, 1983).
The hypothesis that hepatic regeneration is under the control of specific growth factors has stimulated considerable effort toward the identification and isolation of such factors. Hepatocyte Growth Factor (HGF), Hepatopoietin B (HPTB), Heparin Binding Growth Factor-1 (HBGF-1), Transforming Growth Factor-α (TGF-α), Epidermal Growth Factor (EGF), Hepatic Stimulating Substance (HSS),
Cyclosporin, and FK 506 were the well-identified growth stimulating factors that are involved in the control of the hepatic regeneration. On the other hand, the growth inhibiting factors, which were identified in the same process, were Transforming Growth Factor-β (TGF-β), Kupffer Cell Hepatocyte Inhibitor (KCHI), Hepatocyte Proliferation Inhibitor, Interleukin-1 (IL-1), Interleukin-6 (IL-6), and Tumor Necrosis Factor (TNF), Nitric Oxide (NO) (reviewed in Francavilla et.al., 1993).
1.2.4. Liver regeneration & apoptosis
Liver regeneration was thought mainly a proliferation process. However, now it is surely known that, apoptosis is also involved in the process of hepatic regeneration for hepatic tissue remodeling and in fine-tuning the regenerative response (Fan G. et.al.,1998; Kren B.T., 1997). The cell division cycles just after the PH are very rapid, and apoptosis has an important role to eliminate the cells that gain a genetic defect during these cellular divisions. TUNEL assay showed that a noticeable wave of apoptosis swept through the livers starting at 60 hours after PH and increased at 72 and 96 hours (Sakamoto T. et.al., 1999).
It is clear that, apoptosis and the cellular proliferation are the two opposing mechanisms for the fine-tuning of the liver size.
1.3. Cell death: Apoptosis and necrosis
There are two main types of cell death in living multicellular organisms, including mammalians. The first one is the apoptosis, as a programmed cell death. And the second one is the necrosis, which is an un-programmed (accidental) cell death.
Apoptosis is a process that is used by the cells in a multicellular organism in order to keep the homeostasis of the whole organism. All types of cells can undergo apoptosis as a response to some external or internal death-stimuli. During the embryologic development, apoptosis is one of the major processes in determining the tissue morphology and in creating the neural and vascular network of the body. This process of cellular suicide is also very important in eliminating the cells that have some genetic mistakes or that are infected by viruses or parasites.
The mechanism and the reasons of apoptosis and necrosis are very different as well as their consequences. They differ in the extent to which death occurs as a gradual or ordered process that is minimally disruptive to the tissue (apoptosis), or as a more abrupt and overwhelming event that is more likely to elicit a substantial inflammatory response (necrosis) (Kockner, 2001).
During necrosis, the cell swells, its mitochondria dilate, other organelles dissolve and the plasma membrane ruptures, releasing the cytoplasmic content; this is what elicits an inflammatory response (Desagher and Martinou, 2000).
Apoptosis induces a characteristic morphology that includes cell shrinkage, membrane blebbing and chromatin condensation. These microscopic features are associated with the changes in mitochondrial function and phosphatidyl-serine display on the outer leaflet of the cytoplasmic membrane. Fragmentation of the DNA and increased plasma membrane permeability follows in the process. Apoptotic bodies are formed in the end of this process. They contain the remains of the dead cells within an altered but the intact plasma membrane and undergo phosphatidyl-serine-induced phagocytosis by neighboring cells (Desagher and Martinou, 2000).
Since apoptosis has the logic of “to be or not to be”, its cellular and intracellular regulation is very strict and complicated. The disruption in this
regulation system results in many pathological conditions. These diseases can be categorized in two groups based on the direction of dysfunction. If the cells undergo apoptosis unnecessarily, many degenerative diseases and autoimmune diseases can occur. Most seen degenerative diseases are the neurodegenerative diseases, since the lost cells can not be compensated by the remaining neural cells. In the second group of diseases, the cells do not undergo apoptosis by losing responsiveness to the apoptotic stimuli. The most common example is the cancer.
1.3.1. Apoptosis: An evolutionary conserved mechanism.
Apoptosis as a cellular death program has been conserved through evolution, at least since the appearance of the nematodes. The striking homology between the cellular participants in apoptosis seen in the nematode Caenorhabditis elegans, in the fly Drosophilae melanogaster and in the mammalians demonstrate this evolutionary conservation. The three most important proteins for the apoptosis in C. elegans are Ced 9, Ced 4, and Ced3. Bcl-2 protein is the mammalian homologue of the Ced 9, and Apaf-1 and Caspase 9 are homologues of Ced 4 and Ced 3, respectively (Hengartner, 1998; Newton and Strasser, 1998).
1.3.2. Apoptotic pathways
Apoptosis involves the participation of several cell constituents. These include members of the Tumor Necrosis Factor (TNF) plasma membrane ‘death receptor’ family, especially Fas and TNF receptor 1 (TNFR1); mitochondria, where Cytochrome c is released and shown to be very important in many systems; pro- and anti-apoptotic members of the Bcl-2 protein family; and a group of the cysteine
proteases (Caspases) that cleave specific protein substrates at selected aspartate residues.
1.3.2.1. Death receptors
The death receptor Fas (CD 95) is expressed on the surface of hepatocyes and many other cell types. And the Fas ligand (FasL, or CD95L) is usually expressed on the cellular surface of the immunocytes such as cytotoxic lymphocytes. This FasL enables these cells interact with and kill the target cells by activating their Fas signal cascade. Fas-FasL interaction causes the trimerization of the Fas in the target cell, which means the aggregation of the death domains in their cytoplasmic tails and the formation of a death-inducing signaling complex (DISC). Then the Pro-caspase 8 is recruited and activated by this complex. The activated Caspase 8 then activates the caspase cascade (Ashkenazi and Dixit, 1998; Kanzler and Galle, 2000).
TNFR 1 resembles Fas structurally, but the signaling pathways it initiates is more complex when compared with Fas. Interaction of the TNF-α with the TNFR 1 may activate a similar sequence of events leading to cell death, but the interaction also has the ability to generate a survival signal via a TNFR 1-initiated kinase cascade that contains Nuclear Factor-κB (NF-κB), Phophatidyl Inositol-3-Kinase (PI3K) and Akt/protein Kinase B (PKB). The mechanism by which TNFR 1 chooses between survival and death signaling is not fully understood, yet (Ashkenazi and Dixit, 1998; Kanzler and Galle, 2000).
1.3.2.2. Mitochondria.
Several changes may occur in the mitochondria with the apoptosis. As an early event, the voltage-dependent anion channel (VDAC) complex may be disrupted and
converted to the permeability transition pore (PTP). This critical transition is influenced by the pro- and anti-apoptotic members of the Bcl-2 family. The opening of the PTP leads to collapse of inner mitochondrial membrane potential (∆ψm),
compromising or arresting ATP generation. This, in turn, is associated with decreased intra-mitochondrial thiols and increased oxidative stress (Gross et.al., 1999).
In addition to these changes in the mitochondrial energetic, Cytochrome c, the Apoptosis-Inducing Factor (AIF), and Procaspases 2, 3, and 9 are translocated from the mitochondrial intermembrane space to cytosol. These proteins are too large to pass through the PTP, which is limited to molecules not larger than 1.5 kDa. Translocation could reflect the outer membrane rupture during mitochondrial swelling, but this does not always occur. Recent evidences suggest hetero-oligomerization, which would form a sufficiently large pore, between Bid and Bak (Wei M.C. et.al. 2000) or between VDAC and Bax (Shimizu S. et.al. 2000). Whatever the mechanism, translocation of the Cytochrome c has two critically important effects; its loss disrupts the electron transport chain beyond complex III, and its entry into the cytosol activates the caspase cascade via the formation of the apoptosome complex. This cytosolic complex consists of Cytochrome c, APAF-1, Procaspase-9, and either ATP or dATP. The apoptosome cleaves and activates the Procaspase-9, which then activates Caspase-3 and thus downstream effector caspases. In addition the Caspase-3 may be activated directly by AIF, which is released from the mitochondria (Tsujimoto and Shimizu, 2000; Green and Reed, 1998; Adrain and Martin, 2001).
1.3.2.3. Caspase cascade.
Caspases (cysteine aspartic-acid specific proteases) are typically found in cells as inactive precursors (zymogens). These procaspases can be activated by caspase mediated cleavage. Proteolysis releases two fragments of ~20 kDa and ~10kDa that are assembled into the active tetrameric enzyme (Thornberry and Lazebnik, 1998; Goyal, 2001).
Caspases implicated in apoptosis can be broadly grouped into initiator or effector caspases, depending on the role they play within the cell-death machinery. Initiator caspases are the first to be activated in response to an apoptotic stimulus and are responsible for activating the effector caspases. The effector caspases, primarily Caspases-3, -6, and –7, are thought to be responsible for the majority of substrate proteolysis observed during apoptosis (Thornberry and Lazebnik, 1998).
After the activation of the Caspase 9 via the apoptosome complex, Caspase 9 activates the Caspase 7 and Caspase 3. The active Caspase 3 then activates the Caspases 6 and 2, finally the active Caspase 6 activates the Caspases 8 and 10 (Goyal, 2001).
Caspases cause the cell death by degrading critical structural elements, such as lamins and gelsolin, and by activating latent enzymes, such as DNases, through proteolysis of their inhibitors ( Goyal, 2001).
1.3.3. Apoptosis in liver pathology
It is estimated that in liver only 1-5 per 10 000 cells will be detected as apoptotic under physiological conditions. Adaptive and hyperplastic liver growth is usually accompanied by a relatively low rate of apoptosis. Removing the hyperplastic stimulus results in a dramatic increase in apoptosis in all zones of the
liver acinus, preferentially in resting or G0 hepatocytes, leading to removal of
excessive hepatocytes. The size of the liver and the degree of the apoptotic cell death are also determined by the composition and the quantity of the food consumed. Food restriction cause to the reduction of liver cell mass and cell loss by apoptosis. Additionally, it has been reported that the rate of the apoptosis is higher at the end of the daily light (fasting) period than at the end of the night (feeding) period ( Kanzler and Galle, 2000).
A variety of drugs and toxins can cause hepatocellular damage by apoptosis. For example, acute ethanol intoxication increases the number of the apoptotic hepatocytes probably by the elevated production of active oxidants (Kockner, 2001; Kanzler and Galle, 2000).
During hepatitis B and C, hepatocytic up regulation of Fas has been observed. This may be the basis for fulminant hepatic failure occasionally seen in these patients. A further example of Fas-mediated liver-cell damage, potentially leading to acute liver failure is Wilson’s disease (Kockner, 2001).
As for viral hepatitis B, autoimmune hepatitis is marked by lymphocytic infiltrates and apoptotic cell death with the pattern of ‘piecemeal necrosis’. Loss of cholangiocytes with subsequent ductopenia is characteristic for the cholestasis observed in the presumably autoimmune chronic cholestatic liver diseases, such as primary biliary cirrhosis, primary sclerosing cholangitis and biliary atresia (Kockner, 2001; Kanzler and Galle, 2000).
As in most types of cancer, in hepatocellular carcinoma (HCC), there is a decreased level of apoptosis seen in addition to the increased level of proliferation. It is known that escape from the apoptosis is present in all stages of HCC development (Kockner et.al., 2001).
Other than the involvement of apoptosis in the liver diseases, it has also been postulated that apoptosis of hepatocellular and biliary epithelial cells contribute to cell death during allograft rejection (Kockner, 2001).
1.4. Bcl-2 family of regulators of apoptosis.
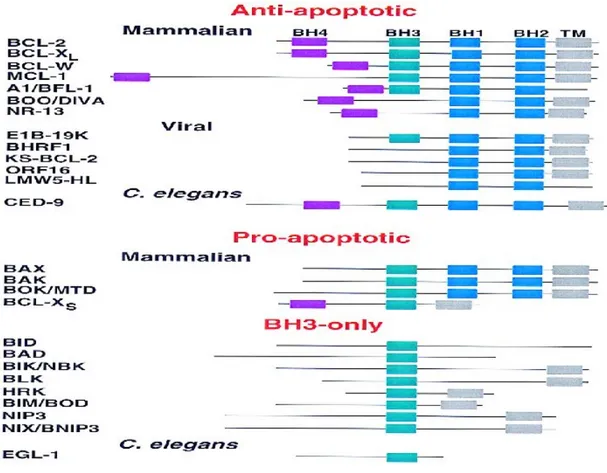
The Bcl-2 protein family consists of both pro- and anti-apoptotic members from both mammalians and nematode. Also there are many homologues of the family members that are present in different types of viruses. The founder of the family, Bcl-2, was first identified in 1985 as the part of the most common translocation in human B-cell lymphoma (Bakhshi et.al., 1985). In that time, this was the first oncogene, which does not stimulate cell proliferation but yet extends the survival of the cell. After the identification of Bcl-2 as a survival factor, many different homologues were identified and characterized. The main homology domains between the different members of the family are characterized as Bcl-2 Homology domains (BH), which are BH1, BH2, BH3, and BH4 domains. This family of proteins is highly conserved throughout the evolution, since any member of the family have more than %90 homology within different species. Almost all members of the family have a carboxy-terminal transmembrane domain in addition to their BH domains. The family members can be divided into 3 main sub-families (Figure 1.1): (1) Anti-apoptotic members (Bcl-2, Bcl-xL, Bcl-w, Mcl-1, A1/Bfl-1,
and Diva), which have all four BH domains and C-terminal transmembrane domains (as an exception Diva does not have BH3 domain); (2) pro-apoptotic members (Bax, Bak, and Mtd/Bok) which have all BH domains except BH4 domain, and the transmembrane domains; (3) ‘BH3-only’ pro-apoptotic members (Bad, Bid, Bik/Biklk, Bim, Hrk, and Bnip3), which have only the BH3 domain with an
Figure 1.1. The subfamilies of Bcl-2 family and homology domains (BH domains) within the family (adapted from Gross et.al., 1999).
additional transmembrane domain (Adams and Cory, 1998; Tsujimoto and Shimizu, 1999).
Generally, the Bcl-2 family of proteins determines the life-or-death of a cell by controlling the releases of mitochondrial apoptogenic factors, Cytochrome c and AIF, that activate the downstream executional phases, including the activation of the caspases. Bcl-xL, but not Bcl-2, was also known to prevent caspase activation by
sequestering Apaf-1 (Tsujimoto and Shimizu, 1999).
Homodimerization is an important pre-requisite for some members, like Bax, in order to function. A unique feature of this family of proteins is the hetero-dimerization between anti-apoptotic and pro-apoptotic proteins, which is considered to inhibit the biological activity of their partners. This heterodimerization is mediated by the insertion of a BH3 region of a pro-apoptotic protein into a hydrophobic cleft composed of BH1, BH2, and BH3 from an anti-apoptotic protein. Also the BH4 domain is essential for the anti-apoptotic activity, in addition to the BH1 and BH2 domains. But only the BH3 domain is sufficient for the pro-apoptotic activity (Gross et.al., 1999).
It has been shown that Bcl-2, Bcl-xL, and Bax form ion channels in synthetic
lipid membranes. Bid, which is a ‘BH3-only’ subfamily member, was also shown to have a channel-forming ability on synthetic lipid membranes. In addition, Bcl-2 has an ability to prevent the channel formation function of Bax in liposomes. However, it is still unknown whether the Bcl-2 family proteins actually form ion channels in vivo (Tsujimoto and Shimizu, 1999).
Bax has been shown to interact with VDAC and ANT. Furthermore it was shown that Bcl-xL closes the VDAC channel on liposomes, whereas Bax/Bak appears
Bax/Bak, BH3-only proteins such as Bid and Bik do not directly affect VDAC activity on liposomes, suggesting that they function through pro-apoptotic family members such as Bax and Bak or through a totally different mechanism. As evidence, Bid was shown to induce a conformational change of Bax and Bak, as assessed by an increased accessibility of some antibodies to Bax and Bak, which would otherwise be non-reactive. However, it was known that Bax/Bak-induced cytochrome c release is totally different from Bid/Bik-mediated cytochrome c release (Tsujimoto and Shimizu, 1999).
Both of the pro- and anti-apoptotic members of the family were shown to be transcriptionally responsive to induction via very different sets of transcription factors (Gross et.al., 1999; Tsujimoto and Shimizu, 1999; Adams and Cory, 1998). Pro-apoptotic members of the family are activated via a conformational change, possibly leading to the exposure of their BH3 domains via different mechanisms. These mechanisms include dephosphorylation (Bad), proteolytic cleavage by caspases (Bid), oligomerization and translocation (Bax). One model on Bax and Bak suggests that their amino terminus are concealed to keep the molecules in a closed configuration until an activation stimulus results in a conformational change that manifests in its release. As evidence, it was shown that the removal of the amino-terminal 20 amino acids of Bax enabled its targeting to mitochondria in the absence of any apoptotic stimuli. Also the amino terminal of Bid is cleaved by Caspase 8 in Fas-mediated apoptosis in order to activate it. Bim is normally localized to the microtubule-associated dynein motor complex via its amino-terminus and the removal of its amino terminus makes it constitutively active. Different pro-apoptotic members are activated as a response to different apoptotic stimuli: Bid is implicated
in Fas-mediated apoptosis, Bax in DNA damage-induced apoptosis, and Bad in lymphokine deprivation-induced cell death in certain cells (Gross et.al., 1999).
Bax, Bak, and Bid can integrate into the mitochondrial outer membranes, although the other pro-apoptotic members of the family can not. For the latter ones, their pro-apoptotic functions are restricted to their interactions with the anti-apoptotic Bcl-2 and Bcl-xL. The evidence for this came from the studies that showed, if their
interaction with Bcl-2 or Bcl-xL is disrupted with any mutations, their pro-apoptotic
functions could no longer be seen. But the case for Bax, Bak and Bid is somewhat different, since the mutants that can not interact with the anti-apoptotic partners can also show their pro-apoptotic activities. Also for Bcl-2 and Bcl-xL, they exert their
anti-apoptotic activities via the interaction with the pro-apoptotic members as well as via some other routes, since the mutations disrupt these interactions did not completely disrupts their antiapoptotic activities (Adams and Cory, 1998).
Other than their actions on the mitochondrial membrane, Bcl-xL and Diva have
been reported to bind APAF-1 and some pro-apoptotic members (e.g. Bik) have been shown to dissociate this complex (Tsujimoto and Shimizu, 1999).
There is increasing experimental evidence that apoptosis and the cell proliferation are closely linked. Many proteins that can induce cell death are, in fact, components of the cell-division cycle. Growth factors, besides triggering cell-cycle progression, can act as survival factors. On the other hand, either cell-cycle block or inappropriate mitogenic signals may result in apoptosis (Kanzler and Galle, 2000). In the same manner, it is thought that the anti-apoptotic members of the Bcl-2 family have some additional roles in the cell cycle or in resting cells.
1.5. Liver regeneration & Bcl-2 family.
The roles of the Bcl-2 family members were not so much well defined in the regeneration process of the liver. In an early study at 1996, Kren et.al. showed in rats after PH that the transcript levels of the bcl-2 and bcl-X changed with a peak at 6hr post-hepatectomy, whereas bax had a peak at 18hr, and 72 hr post-PH. Interestingly, they showed that other than the transcriptional activation, the mRNA stability of these genes were increased at different levels and time points after the hepatectomy. More surprisingly, the protein levels of Bcl-2 and Bcl-X showed no significant changes through 96 hours, although their transcript levels were changed. But the changes in protein level of Bax seemed to be parallel with its changes in transcript level.
Tzung S-P et.al. (1997) showed in mice, that after 60% PH, the steady state levels of bcl-X mRNA exhibited a cyclical pattern, with peaks at 4 hours (early G1) and 48 to 72 hours (G1 phase of the second hepatocyte cell cycle). a1 and bcl-2 mRNA were not detected, and the levels of two mcl-1 mRNA species remained low without significant changes. bak, bad, and bax, all showed an early decline in mRNA levels when bcl-x transcripts increased, followed by later peaks at 12, 24, 48 to 72 hours, respectively. bcl-xL protein reached highest levels at 12 hours, consistent with
the expression of a delayed early gene.
In a recent study, Masson et.al. (2000) showed that in normal rats, just after the 2/3 PH, the transcript level of antiapoptotic bcl-2 and bcl-xL had an early increase,
whereas, the pro-apoptotic bad, bak, and bax had a delayed increase.
Kamimukai et.al.(2001) showed recently that the rats were died due to hepatic failure after 95% PH, although they survived after 90% PH. Interestingly, they showed increased levels of bcl-xL expression in these surviving rats that undergo
90% PH with decreased levels of apoptosis compared to 95% PH group. The transfection of bcl-2 to the 95% group decreased the level of apoptosis in the livers of this group of rats, although they still died due to the lack of insufficient proliferation.
1.6. Importance of liver regeneration studies.
The studies on liver regeneration can be simply divided into two groups: (i) on basic research in order to understand the cell-cycle, and proliferation control; (ii) on basic and applied research in order to understand the response of the liver to the decrease of the hepatic mass.
For the first group of studies, liver regeneration after a PH is a unique real in
vivo system. Since near all hepatocytes are in G0 phase (quiescent) in normal liver,
almost all of them enter into the cell cycle, simultaneously. So any contradiction due to the presence of cells in different stages of the cell cycle does not occur (Gang M.H., 2001).
For the second and the largest group of studies, the important thing is to understand the reason and the mechanism of the hepatic response to a decrease in hepatic mass via PH or to either chemical- or a viral disease-induced hepatic failure. These studies are important in order to understand the mechanism of molecular physiology, and pathology of the liver, as well as to create new therapeutic approaches to liver diseases, like cirrhosis, hepatitis, and hepatocellular carcinoma. Recently, Yokoyama H. et.al. (2000) showed in rats that 60% PH cause a regression of tumor although 30% cause an accelerated progression. Their results suggest that the regression is due to the apoptosis induced during regeneration after resection.
Liver regeneration studies also have a high degree of importance for the liver transplantation studies. With every liver transplant, some hepatic injury is experienced by the donor organ. For successful engraftment to occur, the hepatic injury must be balanced by an equal amount of hepatic regeneration. This regeneration is required to replace liver cells lost in the graft as a consequence of any one or more of the following hepatic injuries: hypoxia, reperfusion, ischemia, or rejection.
Moreover, because of a variety of surgical considerations, the donor organ is often smaller than the diseased resected native liver. As a result, the liver graft is often too small for the recipient’s long-term metabolic needs and compensatory hyperplasia occurs with the liver graft growing at a rate of 100 to 140 gram per day (Kam et.al., 1987). Grafts that are adversely affected by rejection show even greater degrees of hepatic regeneration with nodule formation, bile ductular proliferation, and bridging scars that can stimulate cirrhotic nodules (Van Thiel et.al., 1987). Thus, some degree of hepatic regeneration occurs with every liver transplant. The degree to which this regeneration process is manifest, however, is often inversely related to the degree of adversity experienced by the graft.
1.7. Aim of Study.
During the regeneration of liver as a response to partial hepatectomy, apoptosis occurs, as shown previously for some time points, in order to eliminate the defective cells appeared after cellular divisions, and to make a fine-tuning of the liver size and for tissue remodeling. Bcl-2 family of proteins, which are the most important and critical regulators of apoptosis, should be tightly regulated during regeneration in a time-dependent manner throughout the process. Therefore, in this study, our aim was
to show the expressional changes of some members of Bcl-2 family (bcl-2, bcl-xL, bcl-w, bax, bak, bid, and mtd) in transcript levels in different time groups after partial
hepatectomy in rats.
In order to test our hypothesis, we determined the relative transcript levels in the livers of rats, which were subjected to either 40% PH, or 70% PH, or Sham operation, by using the semi-quantitative PCR technique.
2.1. ANIMALS
Male, 9-weeks old and 200-300 grams Sprague-Dawley rats were used. They were housed under controlled environmental conditions (22ºC) with a 12-hour light and 12 hour dark cycle in the animal holding facility of the Department of Molecular Biology and Genetics at the Bilkent University, Turkey. The animals were permitted unlimited access to food and water at all times.
2.2. STANDARD SOLUTIONS AND BUFFERS 10x MOPS: (for 1lt) 41,8 gr MOPS 16,6 ml 3 M NaAc 20 ml 0,5 M EDTA (pH=8.0) LB MEDIUM: (for 1lt) 10 gr bacto-tryptone 5 gr yeast extract 10 gr NaCl
50 X TAE BUFFER: (for 1lt)
2 M Tris Base (242 g) 57.1 ml Glacial Acetic Acid 50 mM EDTA.
2.3. CLONINGS
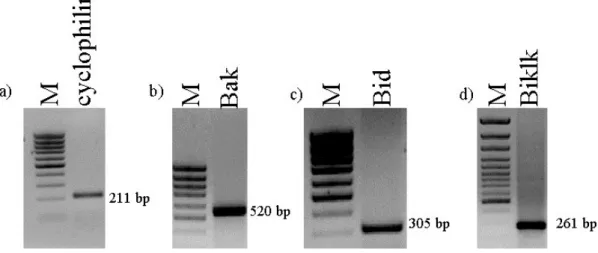
Rat homologues of the three Bcl-2 family genes (bak, bid, and biklk) were cloned. A housekeeping gene, cyclophilin, was also cloned from rat.
2.3.1. PRIMER DESIGN
As a housekeeping gene, we used cyclophilin, for which the primers were designed by using the rat cDNA sequence with the GenBank Accession Number of M19533.
In the case of bid, bak, and biklk, the cDNA sequences of mouse and human homologues were aligned by Blast (NCBI), and primers were chosen from the largest conserved regions by preferring the mouse sequence in the points of mismatches. The mice homologue of bid (NM_007544), bak (Y13231), and biklk (NM_007546); and the human homologue of bid (AF042083), bak (U23765), and bik (NM_001197) were used as sequences.
Primers were synthesized in the Beckman Oligo 1000M DNA Synthesizer (Beckman Instruments Inc. CA, USA) at Bilkent University, Department of Molecular Biology and Genetics (Ankara, Turkey).
The primer sequences used in clonings were listed in table 2.1.
2.3.2. TOTAL RNA ISOLATION FROM TISSUE SAMPLES
During RNA isolations, all the solutions and materials were treated with DEPC in order to avoid RNase contamination.
The total RNAs were isolated from brain, liver, and testis with Tripure solution (Roche-Boehringer Mannheim) by using the manufacturer’s protocol.
100 ug of tissue samples were homogenized in 1 ml of Tripure solution by using the homogenizer. The homogenates were incubated for 5 minutes at room temperature for complete dissociation of the nucleoprotein complexes. Then 0.2 ml of chloroform added and shaked vigorously for 15 seconds. After incubating them at room temperature for 15 minutes, they were centrifuged at 12 000 xg for 15 minutes at 4ºC. Three phase were occurred after centrifugation. The colorless upper aqueous phases were transferred to new eppendorf tubes and 1ml of isopropanol was added on each sample. After mixing it by inverting the tubes several times, they were incubated at room temperature for 10 minutes. Then they were centrifuged at 12 000
bak (536 bp) Forward Reverse :5’-CCGGAATTCCAGGACACAGAGGA-3’ :5’-CCAAGCTTGCCCAACAGAACCAC-3’ bid (316 bp) Forward Reverse :5’-GGTTCGGAAGAATAGAGCCAGAT-3’ :5’-CCACTTAAGACATCACGGAGCAG-3’ biklk (273 bp) Forward Reverse :5’-GCAAGCTTCGGCGATGAGATG-3’ :5’-GAACGGATCCCCACCCAGCAG-3’ cyclophilin (211 bp) Forward Reverse :5’-GGGAAGGTGAAAGAAGGCAT-3’ :5’-GAGAGCAGAGATTACAGGGT-3’
xg for 10 minutes at 4ºC and the supernatant were discarded. The pellets were washed with 1 ml of 75% ethanol by vortexing, and then centrifuged at 7 500 xg for 5 minutes at 4ºC. The supernatants were discarded and the pellets were air-dried on bench for about 10 minutes. The RNA pellets were resuspended in appropriate volume of the DEPC-treated water.
2.3.3. DETERMINATION OF RNA CONCENTRATION BY SPECTROPHOTOMETRY
1 ul of each samples were diluted 1:1000 with DEPC-treated ddH2O. Then the
O.D. measurements were done for 260 and 280 nm wavelengths with the spectrophotometer (Beckman). The concentration of the RNA samples were calculated with the formula:
[RNA] = O.D.260 X dilution factor (1000) X 40
And the O.D.260/ O.D.280 ratios were calculated in order to understand if there is a
phenol, protein or DNA contamination in our RNA samples. The ratio values between 1.6-2.0 were the expected results.
2.3.4. DENATURING AGAROSE GEL ELECTROPHORESIS 2.3.4.1. Preparation of the gel (1.2%)
1.2 gr of agarose was dissolved in 87 ml of DEPC-treated ddH2O in a
microwave. When it is cooled to ~50ºC, 10 ml of 10X MOPS and 3 ml of 40% formaldehyde were added dropwise, while stirring with a magnetic stirrer. Just before pouring the gel, 5 ul of ethidium bromide(10mg/ml) was added.
2.3.4.2. Preparation of the samples for loading
For 5.5 ul (5 ug to 10 ug) of RNA sample, they were mixed with 1 ul of 10X MOPS, 3.5 ul of 40% formaldehyde and 10 ul of deionized formamide. Then the samples were denatured by incubating for 15 minutes at 65ºC. Samples were then spinned down briefly and kept on ice until loading. They were loaded on the polymerized casted gel, which was previously placed into the electrophoresis-tank filled with 1X MOPS. Then the samples were run with 60 V for 4 hours. After the completion of the electrophoretic separation of the samples, the gels were visualized under the U.V. and the images were captured by the transilluminator apparatus with the Multi-Analyst software.
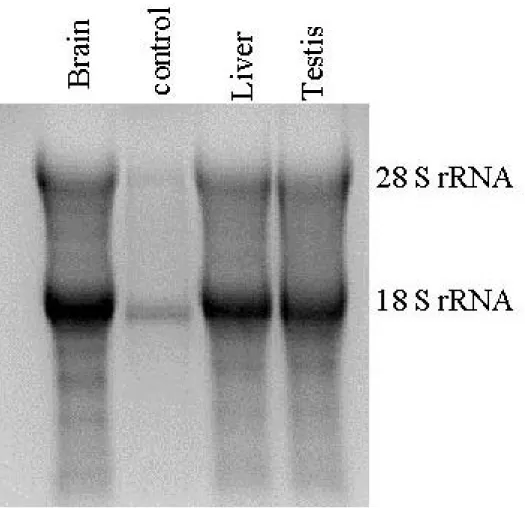
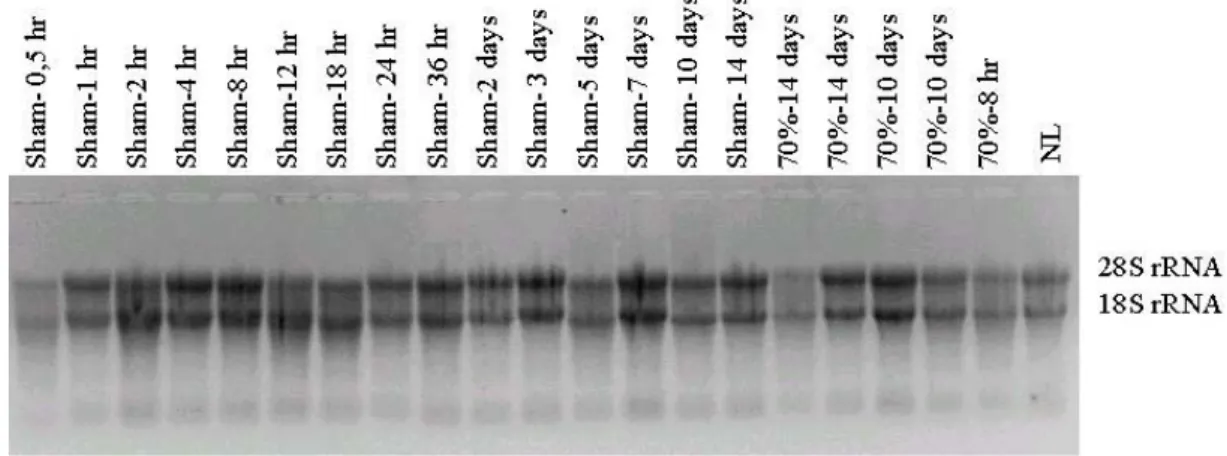
The integrities of the RNA samples were determined by the integrity of the ribosomal RNA bands (18S and 28S rRNA).
2.3.5. RT-PCR
The cDNA samples were synthesized from the total RNA samples with the RevertAid First Strand cDNA Synthesis Kit (MBI Fermentas) by using the manufacturer’s protocol.
5 ug of RNA samples were mixed with 1 ul of oligo (dT)18 primer and ddH2O
in a total volume of 12 ul. They were incubated at 70ºC for 5 minutes and then chilled on ice. Then 4 ul of 5x reaction buffer, 1 ul of Ribonuclease inhibitor and 2 ul of 10 mM dNTP mix were added and incubated at 37ºC for 5 minutes. Finally, 1 ul of RevertAid M-MuLV reverse transcriptase were added and incubated at 42 ºC for 60 minutes. The reactions were stopped by heating at 70ºC for 10 minutes and put into the ice.
2.3.6. Polymerase Chain Reaction (PCR)
Polymerase chain reaction (PCR), a rapid procedure for in vitro enzymatic amplification of a specific segment of DNA (Mullis and Faloona 1987), was performed to amplify the partial coding sequences of bak, bid, biklk, and cyclophilin. PCR reactions were performed in 0.2 ml ThermowellTM tubes (Corning Costar Corp.)
using the GeneAmp PCR system 9600 (Perkin Elmer).
PCR reactions were carried out in a reaction volume of 25 ul containing 1 ul of cDNA template , 2.5 ul 10x PCR buffer (MBI Fermentas), 1.5 mM MgCl2 (MBI
Fermentas), 0.2 mM of each dNTP (MBI Fermentas), 50 pmole of each primer and 1 unit Taq DNA polymerase (MBI Fermentas).
The reaction was preheated to 94oC for 5 minutes and then subjected to 35 cycles of denaturation (30 seconds at 95oC), annealing (30 seconds at 52oC for bid, or 55 oC for bak, or 58 oC for biklk), and elongation (30 seconds at 72oC). At the end of the 35 cycles a final extension at 72oC for 10 minutes was also applied. 15 ul of the PCR products were assessed by agarose gel electrophoresis and Ethidium Bromide staining.
2.3.7. LIGATION
For the cloning purposes, the pGEM-T and pGEM-T Easy vector systems (Promega) was used (Figure 2.1.).
Approximately 200 ng of the PCR product is mixed with 5 ul of 2x rapid ligation buffer, 1 ul (50 ng) of pGEM-T or PGEM-T Easy vector and 1 ul of T4 DNA Ligase in a total volume of 10 ul. Then they were incubated at 16ºC for 20 hours.
2.3.8. CaCl2-TRANSFORMATION of E.Coli
DH5-α strain of E.Coli was used in clonings.
1 ml of DH5-α culture (108 cells/ml) were taken into an eppendorf tube and spinned down at 13 000x rpm for 1 minutes. After discarding the supernatant, the pellets were resuspended in 0.5 ml ice-cold CaCl2. Following the incubation on ice
for 30 minutes, they were centrifuged at 13 000x rpm for 45 seconds. After discarding the supernatant, the pellets were gently resuspended in 100 ul of ice-cold CaCl2. All the ligation products at section 2.7 were added and then the mixtures were
incubated on ice for 30 minutes. Then the heat-shock was done by incubating them at 42ºC for 90 seconds, and then immediately chilled and incubated on ice for 2 minutes. After this heat shock, 1 ml of LB medium was added and incubated at 37ºC for 1 hour. Then they were inoculated and spreaded on solid LB-agar plates that contained ampicillin, IPTG and X-Gal. After incubating the plates at 37ºC for 16-18 hours the colonies appeared as either blue or white in color.
2.3.9. MINIPREP (Small-Scale Preparations of Plasmid DNA)
The bacteria from the white colonies were inoculated on LB medium and grown at 37ºC for 18 hours. Then 1.5 ml of culture were taken to eppendorf tubes and spinned down at 13 000x rpm for 1 minutes. After discarding the supernatants, the pellets were dissolved by vortexing in 0.1 ml of solution 1 (50 mM Glucose; 25 mM Tris.Cl –pH=8.0-; and 10 mM EDTA-pH=8.0). After incubating at room temperature for 5 minutes, 0.2 ml of freshly prepared solution 2 (0.2 N NaOH; 1% SDS) was added and mixed by inversion. After the tubes were incubated on ice for 5 minutes, 0.15 ml of solution 3 (for 100 ml: 60 ml 5M potassium acetate, 11.5 ml glacial acetic acid, 28.5 ml H2O) was added and vortexed. Then they were put into
ice for further 5 minutes, and centrifuged at 13 000x rpm for 15 minutes at 4ºC. The supernatants were transferred to new eppendorf tubes carefully. Onto the supernatants, 1 ml of absolute ethanol was added and mixed. They were incubated at -70ºC for 30 minutes and then spinned down at 13 000x rpm for 15 minutes at 4ºC. After discarding the supernatants, the pellets were air-dried, and then dissolved in appropriate amount of ddH2O.
2.3.10. RESTRICTION ENZYME DIGESTION OF DNA
Depending on the amount of DNA (1-5 ug), restriction enzyme digests of DNA was carried out in a total volume of 20-50 ul with 10-50 units of restriction enzyme, Appropriate buffers and incubation conditions were used for each digest as recommended by the manufacturer. In order to check the presence of the inserts, they were excised out from the vector by EcoRI digestion.
2.3.11. MIDIPREP (Large-Scale Preparations of Plasmid DNA)
For the midiprep, the Nucleobond AX-100 kit (Macherey-Nagel) was used. For this purpose, transformed bacteria were inoculated into 30 ml of LB culture with 50 ug/ml ampicillin and were incubated at 37ºC for overnight.
Then the bacterial cultures were spinned down by centrifugation at 5 000x g for 10 minutes at 4ºC. After discarding the supernatant, the pellets were carefully resuspended in 4 ml of buffer S1. 4 ml of buffer S2 were put and mixed by inversion. The suspensions were incubated at room temperature for 5 minutes. Then 4 ml of buffer S3 was added, and immediately mixed by inversion. After incubating on ice for 5 minutes, they were centrifuged at 12 000x g for 30 minutes at 4ºC. After the equilibration of the cartridges with 2.5 ml of buffer N2, the supernatants from the previous step were loaded on cartridges. The cartridges were washed twice with 5 ml
of buffer N3. Then the plasmid DNAs were eluted from the cartridges with 5 ml of buffer N5. Purified plasmid DNA samples were then precipitated with 4 ml of isopropanol and were centrifugated at 15 000x g for 30 minutes at 4ºC. After discarding the supernatant, the pellets were washed with 70% ethanol and spinned down at 15 000x g for 10 minutes at 4ºC. Finally, the supernatant is discarded and the pellets were air-dried and dissolved in appropriate volume of ddH2O. Then their
concentrations were measured by using spectrophotometer, and checked with agarose gel electrophoresis.
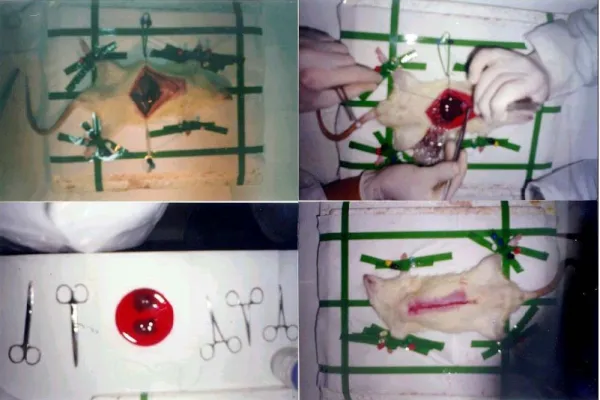
2.4. PARTIAL HEPATECTOMY AND DISSECTION
In this study, the 9-week old male Sprague-Dawley rats were used.
2.4.1. 40 % PARTIAL HEPATECTOMY
The rats were anesthetized with Ketalar (Parke-Davis) and immobilized on the bench. After the sterilization with 70% ethanol, the skins were cut with a scissor. After removing the subcutaneous structures, the peritoneal membranes were cut carefully throughout the midline resulting in the opening of the abdomen. The intestines were carefully taken out into a saran-wrap and by using serum physiologic (0.9% NaCl) drying of the intestines was avoided.
Then the ligaments of the liver that connect the organ to the diaphragm, and the lobes to each other were cut. The middle lobe, which accounts for the 40% of the total liver mass, was cut after the tying of the branch of vena cava inferior that enters to this lobe with silk. The color of this lobe immediately became dark after tying, which was due to the cutting of blood supply to this lobe. Then the lobe was washed in DMEM medium and then quickly frozen in liquid nitrogen.
After removing the lobe, the abdominal cavity of the animal was cleaned carefully. The intestines were placed to their original locations. Then the peritonea and the skin were closed separately by using propilen. After the completion of the surgery, the animals were placed under a lamp to increase its body temperature and then put into cages (one animal per cage) with continuous supply of food and water.
The resected and frozen lobes were weighted and the mass values were recorded.
2.4.2. 70 % PARTIAL HEPATECTOMY
In 70% PH, in addition to middle lobe, the front lobe, which accounts for the 30% of the total liver mass, was also removed after tying the branch of the vena cava inferior that enters into the front lobe with silk. The same procedures were used as in 40% PH, after the removal of the frontal lobe(Figure 2.2.).
2.4.3. SHAM OPERATION
For the Sham group of animals, all the surgical operations done were same as PH, but the livers were not tied up and resected.
2.4.4. EXPERIMENTAL GROUPS
Animals were sacrificed by the dislocation of the neck according to their time groups. After the neck dislocation, the skin and peritoneum of the animals were quickly opened, and the liver tissue was cut from the vena cava inferior, carefully, washed in DMEM medium, and immediately frozen in liquid nitrogen. The dissected and frozen liver tissues were weighted and recorded for further calculations.
Figure 2.2. The liver resection surgery for partial hepatectomy. 70%
For the 40% and 70% PH groups, the time of the resection of the middle lobe is considered as 0 hr. For each time group, 2 animals were used for the 40% and 70% PH groups. For the Sham group, the time when the intestines were put into the saran-wrap was considered as 0 hr, and one animal was used for each time group. The time groups used in this study were 0,5 hr, 1 hr, 2 hr, 4 hr, 8 hr, 12 hr, 18 hr, 24 hr, 36 hr, 2 days, 3 days, 5 days, 7 days, 10 days, and 14 days.
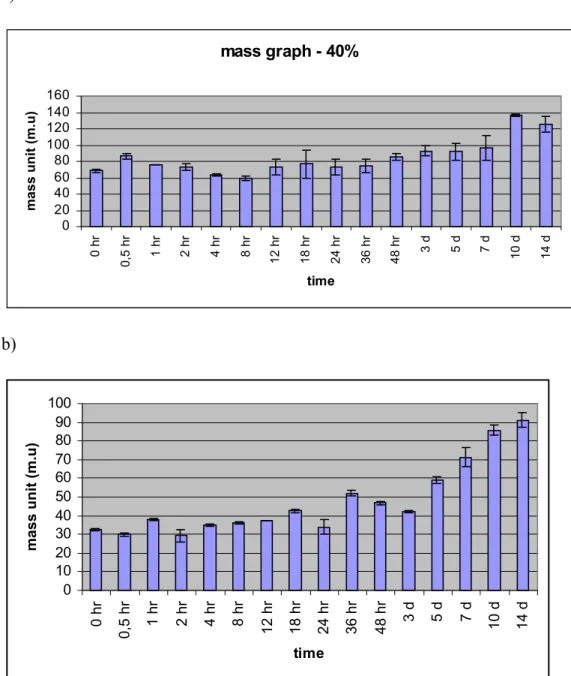
2.4.5. MASS GRAPHS
Normally, the total weights of livers were not same between different animals. So that, in order to normalize the values, we defined a term, ‘mass unit’. For each animal 1 mass unit was calculated by dividing the weight of its resected liver tissue by 40 or 70 for 40% and 70% PH groups, respectively. After obtaining the mass unit conversion values, the weight of the regenerated liver tissues were converted to mass units by dividing their actual weights by the obtained conversion values for each animal.
2.5. TOTAL RNA ISOLATION
The RNA were isolated from all the liver samples with the Tripure solution (Roche-Boehringer Mannheim) by using the manufacturer’s protocol as explained in detail at section 2.3.2. The integrity of the isolated RNA samples was determined by denaturing- (formaldheyde-) agarose gel electrophoresis as explained in section 2.3.4. Then the concentrations of the RNA samples were determined by spectrophotometric measurements, as in section 2.3.3.
2.6. RT-PCR
The cDNA samples were synthesized from the total RNA samples with the RevertAid First Strand cDNA Synthesis Kit (MBI Fermentas) by using the manufacturer’s protocol as explained in Material and Methods 2.3.5.
2.7. SEMI-QUANTITATIVE PCR
Semi-quantitative PCR is a suitable method for comparing the relative amount of the used templates between different samples. Normally, the PCR reaction does not have a linear graph for product amount versus cycle number. In algebraic terms, it is the graph of the combination of two functions. This is due to the saturation of the polymerase chain reaction (PCR). In order to have a dependable comparison, the cycle number, in which the PCR reaction is not saturated, should be determined for each of the genes. This was done by performing the PCR reaction for different cycles for each gene and drawing a graph from the intensity of the DNA bands assessed by agarose gel electrophoresis.
2.7.1. PRIMER DESIGN
We have designed primers for bcl-2, bcl-xL , bax, mtd, and bcl-w by using the
cDNA sequences of rat homologues of these genes, which are available at the GenBank database. The GenBank Accession numbers of rat homologues of bcl-2 is NM_016993; of bcl-xL is U34963, of bax is S76511, of mtd is NM_017312, and of bcl-w is AF096291.
For cyclophilin, bak, and bid the primer pairs in Table 2.1. were also used in semi-quantitative PCRs. All the oligonucleotide sequences used in semi-quantitative PCR reactions were listed in Table 2.2.
cyclophilin (211 bp) Forward Reverse :5’-GGGAAGGTGAAAGAAGGCAT-3’ :5’-GAGAGCAGAGATTACAGGGT-3’ bcl-2 (584 bp) Forward Reverse : 5’-CCTGGCATCTTCTCCTTC-3’ :5’-TGCTGACCTCACTTGTGG-3’ bcl-xL (346 bp) Forward Reverse :5’-TCAATGGCAACCCTTCCTGG-3’ :5’-ATCCGACTCACCAATACCTG-3’ bax (272 bp) Forward Reverse :5’-ACGCATCCACCAAGAAGC-3’ :5’-GAAGTCCAGAGTCCAGCC-3’ bak (536 bp) Forward Reverse :5’-CCGGAATTCCAGGACACAGAGGA-3’ :5’-CCAAGCTTGCCCAACAGAACCAC-3’ bid (316 bp) Forward Reverse :5’-GGTTCGGAAGAATAGAGCCAGAT-3’ :5’-CCACTTAAGACATCACGGAGCAG-3’ mtd (400 bp) Forward Reverse :5’-GTGGATCCGCGGCGCTCTTCTGTCTTC-3’ :5’-CAAGCTTCAGCCACCGAGTACAGGGA-3’ bcl-w (326 bp) Forward Reverse :5’-GCGGATCCATAAGCTGAGGCAGAA-3’ :5’-GGAAGCTTTGCACTTGTCCCACCA-3’
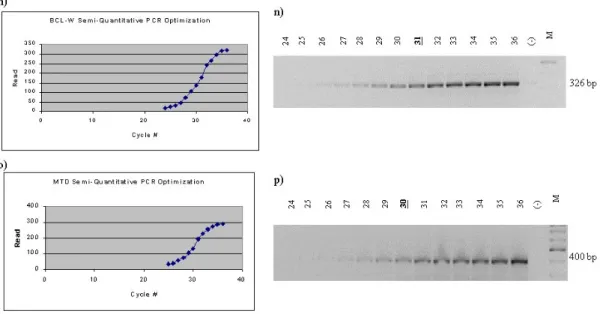
2.7.2. SEMI-QUANTITATIVE PCR OPTIMIZATION
Semi-quantitative PCR optimizations were done by preparing a large volume of the reaction for each gene and then by dividing this to several individual PCR tubes, in order to prevent the errors that may have arise from pipetting. At the end of the each cycle, one tube was taken and the final extension of this reaction were performed by incubating at 72ºC for 10 minutes. Then the reaction was stopped by putting the tube on ice.
After the completion of all cycles in the same manner, 20 ul of the 25 ul of PCR products were assessed by agarose gel electrophoresis and ethidium bromide staining. The results were analyzed by the Multi-Analyst software and the graphs were drawn. The optimum cycle numbers for semi-quantitative PCR reactions were determined from the graphs. All the optimizations were done by using the cDNA template of normal rat liver.
2.7.3. SEMI-QUANTITATIVE PCR
For all the experimental samples, the semi-quantitative PCR reactions were done from the same master mix, simultaneously. The PCR was done first by using the robotics (Beckman Biomek 2000 Laboratory Automation Workstation) and then repeated once more by hand. In all reactions the negative control group was done by using ddH2O instead of cDNA.
The quantitated values for the Bcl-2 family members were normalized with the quantitated values for the cyclophilin for each sample, separately. And the resulting graphs were drawn by these normalized values.
3.1. INTRODUCTION
Liver regenerates itself by increasing its mass to compensate the loss of its functional capacity. This decrease in its capacity can occur after hepatic failure by chemicals, viral infection, or by PH. However, uncontrolled proliferation can also cause some problems that may result in the loss of homeostasis. So that the fine-tuning of the liver mass is quite important during regeneration in order to maintain the homeostasis. Apoptosis is the main tool for any organism for such a fine-tuning, since it causes elimination of the cells in an organism without disrupting the integrity of the tissue.
Due to the accumulation of knowledge on apoptosis, the involvement of this cellular death mechanism in the process of liver regeneration has become a promising research area. It has been shown that, mitochondria have a central role in the regulation of apoptosis by controlling the release of apoptotic factors. Among these factors, Cytochrome c, which causes the activation of caspases cascade, is one of the most important one. In this regulation, Bcl-2 family of proteins has been shown to have many critical roles. The anti-apoptotic subfamily members are thought to prevent the apoptosis by at least blocking the release of these factors from mitochondria. In contrast, pro-apoptotic subfamily members cause directly or indirectly the activation of the apoptotic machinery.
In the regulation of these bcl-2 family member genes, the transcriptional control has been shown to be important as well as the post-translational control. Therefore, in this study, our aim was to show the expressional changes of some members of the bcl-2 family (bcl-2, bcl-xL, bcl-w, bax, bak, bid, biklk, and mtd) at the
mRNA levels up to 14 days after partial hepatectomy in rats. For this purpose, we used the semi-quantitative PCR technique to determine the relative transcript levels