The article was published by ACG Publications
www.acgpubs.org/jcm © Published online 07/13/2017 EISSN:1307-6183
DOI: http://doi.org/10.25135/jcm.6.17.04.037
J. Chem. Metrol. 11:2 (2017) 46-54
Determination and validation method of molybdenum by
adsorptive catalytic stripping voltammetry at lead film electrode
Nail Deniz
1, Lokman Liv
2and Nuri Nakiboğlu
1 *1
Department of Chemistry, Faculty of Arts and Sciences, Balıkesir University, Balıkesir,
Türkiye
2
Electrochemistry Laboratory, TÜBİTAK UME (National Metrology Institute),
P.Box: 41470 Gebze-Kocaeli, Türkiye
(Received April 04, 2017; Revised June 23, 2017; Accepted July 2, 2017)
Abstract: A new, selective, sensitive and accurate method for determination of molybdenum by adsorptive catalytic stripping voltammetry was described. The method is based on catalytic reduction of adsorbed Mo(VI)-ARS complex onto the lead film electrode in the presence of chlorate used as oxidizing agent. The instrumental and solution parameters affecting the peak current were optimized. The calibration graph is linear between 2.65-20.00 µg/L Mo(VI) and limit of detection is estimated as 0.79 µg/L. The proposed method was applied to drinking water samples with satisfactorily recovery results and the uncertainty calculation of the method was performed.
Keywords: Molybdenum; Alizarin Red S; adsorptive catalytic stripping voltammetry; lead film electrode.
© 2017 ACG Publications. All rights reserved.
1. Introduction
Molybdenum is used the most in metallurgy area such as alloys, superalloys, stainless steel, structural steel, tool and high speed steels [1]. Besides molybdenum is essential element that acts as catalytically active along enzyme catalysis reactions. There are five Mo-dependent enzymes, four of them are for humans, one of them is for plants [2]. Molybdenum deficiency causes to functioning disorder of sulfite oxidase, affecting easily toxic reactions of sulfite in foods and tooth decay [1]. World Health Organization prefers to 2 µg/kg molybdenum intake daily for humans [3]. The molybdenum limits in drinking water released by The U.S. Environmental Protection Agency are 10 µg/L for children and 50 µg/L for adults and for irrigation water released by The United Nations Food and Agriculture Organization is 10 µg/L [4].
Due to simple, rapid, cheap and sensitive features of voltammetric techniques, the researchers have tended to voltammetric methods. The complexing agents are generally used for voltammetric determination of molybdenum to form stable Mo(VI)-organic ligand complexes and all methods are based on adsorption controlled electrode reaction. These ligands are oxine [5-7], methyl thymol blue [8,9], chloranilic acid [10-14], ɑ-benzoin oxime [15-18], cupferron [19,20], dihydroxynaphtalene [21],
*
Corresponding author: Phone: (+90) 266 612 1000-1113, Fax: : (+ 90) 266 612 1515 E-Mail: [email protected]
p-cresol derivative [22], 1,10-phenanthroline [23], methyl orange [24], 8-hydroxyquinoline [25], pyrogallol red [26,27], mandelic acid [28], cetyltrimethylammonium bromide (CTAB) [29], tiron [30], morin [31], alizarin violet [32], alizarin red s [4,33,34] and azo compounds [35]. These methods were summarized in Table 1.
Mercury based methods have a great drawback owing to toxicity effect for environment and humans. Therefore there has been a tendency to the using of solid electrodes. The dependence on our best knowledge, there is no comprehensive study for voltammetric determination of molybdenum in terms of validation and using Mo-ARS-chlorate catalytic system. It is aimed to develop new, simple, sensitive and selective voltammetric determination method of molybdenum and also to calculate several validation parameters and uncertainty of the method.
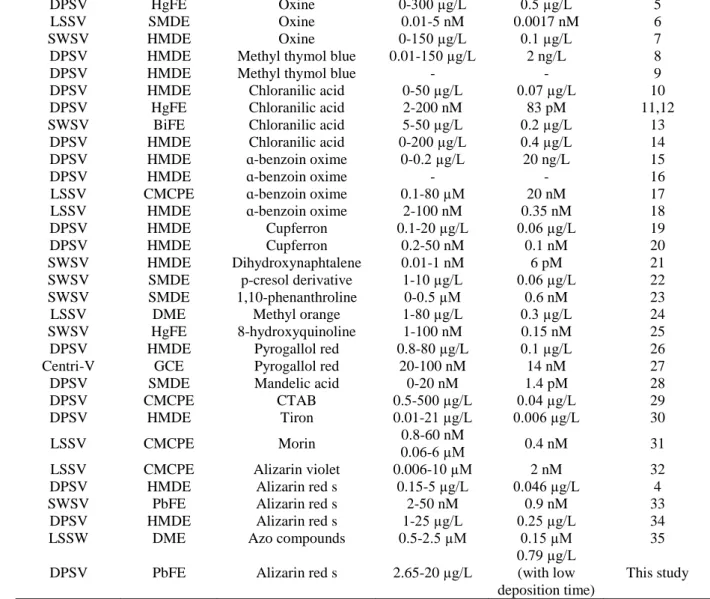
Table 1. Summary of the voltammetric methods for determination of molybdenum
Method Electrode Ligand Analytical
Range Limit of Detection Reference DPSV HgFE Oxine 0-300 µg/L 0.5 µg/L 5 LSSV SMDE Oxine 0.01-5 nM 0.0017 nM 6 SWSV HMDE Oxine 0-150 µg/L 0.1 µg/L 7
DPSV HMDE Methyl thymol blue 0.01-150 µg/L 2 ng/L 8
DPSV HMDE Methyl thymol blue - - 9
DPSV HMDE Chloranilic acid 0-50 µg/L 0.07 µg/L 10
DPSV HgFE Chloranilic acid 2-200 nM 83 pM 11,12
SWSV BiFE Chloranilic acid 5-50 µg/L 0.2 µg/L 13
DPSV HMDE Chloranilic acid 0-200 µg/L 0.4 µg/L 14
DPSV HMDE ɑ-benzoin oxime 0-0.2 µg/L 20 ng/L 15
DPSV HMDE ɑ-benzoin oxime - - 16
LSSV CMCPE ɑ-benzoin oxime 0.1-80 µM 20 nM 17
LSSV HMDE ɑ-benzoin oxime 2-100 nM 0.35 nM 18
DPSV HMDE Cupferron 0.1-20 µg/L 0.06 µg/L 19
DPSV HMDE Cupferron 0.2-50 nM 0.1 nM 20
SWSV HMDE Dihydroxynaphtalene 0.01-1 nM 6 pM 21
SWSV SMDE p-cresol derivative 1-10 µg/L 0.06 µg/L 22
SWSV SMDE 1,10-phenanthroline 0-0.5 µM 0.6 nM 23
LSSV DME Methyl orange 1-80 µg/L 0.3 µg/L 24
SWSV HgFE 8-hydroxyquinoline 1-100 nM 0.15 nM 25
DPSV HMDE Pyrogallol red 0.8-80 µg/L 0.1 µg/L 26
Centri-V GCE Pyrogallol red 20-100 nM 14 nM 27
DPSV SMDE Mandelic acid 0-20 nM 1.4 pM 28
DPSV CMCPE CTAB 0.5-500 µg/L 0.04 µg/L 29
DPSV HMDE Tiron 0.01-21 µg/L 0.006 µg/L 30
LSSV CMCPE Morin 0.8-60 nM
0.06-6 µM 0.4 nM 31
LSSV CMCPE Alizarin violet 0.006-10 µM 2 nM 32
DPSV HMDE Alizarin red s 0.15-5 µg/L 0.046 µg/L 4
SWSV PbFE Alizarin red s 2-50 nM 0.9 nM 33
DPSV HMDE Alizarin red s 1-25 µg/L 0.25 µg/L 34
LSSW DME Azo compounds 0.5-2.5 µM 0.15 µM 35
DPSV PbFE Alizarin red s 2.65-20 µg/L
0.79 µg/L (with low deposition time)
This study LSSV: Linear sweep stripping voltammetry DPSV: Differential pulse stripping voltammetry
SWSV: Square wave stripping voltammetry Centri-V: Centri-voltammetry DME: Dropping mercury electrode SMDE: Static mercury drop electrode HMDE: Hanging mercury drop electrode HgFE: Mercury film electrode BiFE: Bismuth film electrode PbFE: Lead film electrode
2. Experimental
2.1. Chemicals and Apparatus
Molybdenum ICP standard (Merck, 1000 mg/L Mo(VI) from (NH4)6Mo7O24 in H2O) was used
for complexation and determination of molybdenum. The other chemicals were analytical reagent grade. Deionized water (18.2 MΩ) obtained from ELGA PureLab Flex 2 ultra pure water system was used for preparation of all solutions.
Voltammetric measurements were performed using Ivium Compactstat potentiostat/galvanostat connected to a BASi C3 cell stand. A three-electrode system was used, which are lead film electrode (PbFE) supported with glassy carbon electrode (GCE) as working electrode, Ag/AgCl/3 M NaCl as reference electrode and platinum wire electrode as auxiliary electrode.
An Isolab ultrasonic bath was used for the cleaning of GCE.
pH measurements were made using Hanna HI-121 model pH meter with combined pH electrode. pH calibration was performed using standard buffer solutions prior to the measurements.
2.2. Preparation of Lead Film Electrode (PbFE) and Measurement Procedure
Afterwards the cleaning of GCE with alumina slurry on the felt plate, the GCE was ultrasonicated in 1:1 ethanol:ultra pure water and ultra pure water for 3 minutes, respectively. The GCE was activated in 0.1 M pH 5 acetic acid/acetate buffer solution with waiting at +1.2 V for 120 s and cyclic scanning between -1 V and +1 V until obtaining a stable baseline.
Lead film formation was performed in 0.4 mM Pb2+ and 0.1 M pH 5 acetic acid/acetate buffer solution with waiting at -1.45 V for 30 s. Mo(VI)-ARS complex adsorption was made with electrodeposition at -0.56 V for 60 s and the adsorbed complex was stripped of from -0.56 V to -1 V.
2.2. Sample Preparation Procedure
Drinking water samples collected from Balıkesir and spiked with 1 and 3 µg/L molybdenum. All samples were diluted as 1:1 ratio and standard addition method was used for determination of molybdenum.
3. Results and discussion
3.1. Voltammetric Behaviour of Mo(VI)-ARS Complex
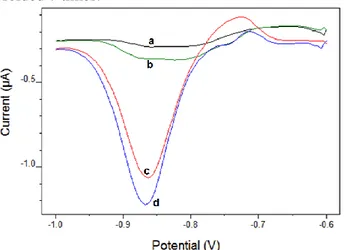
Differential pulse stripping voltammograms were recorded the absence and the presence of potassium chlorate to prove the catalytic effect. It can be seen from Figure 1, the peak current of Mo(VI)-ARS complex is folded 7 times.
Figure 1. Stripping voltammograms of 7x10⁻⁷ M ARS (a), a + 10 µg/L Mo(VI) (b), b + 0.08 M KClO3
(c) and c + 15 µg/L Mo(VI) (d) in the presence of 0.1 M acetic acid/acetate buffer solution (pH=5) and 4x10⁻⁴ M Pb2+.
Moreover the cyclic voltammograms for various scan rates were recorded of the complex to prove the catalytic effect. The current function was plotted against to scan rates (Figure 2), the exponential decreasing depicts the catalytic system.
Figure 2. The current function (I/√ʋ)-scan rate (ʋ) graph (4x10⁻⁴
M Pb2+, 8x10⁻² M KClO3, 7x10⁻⁷ M
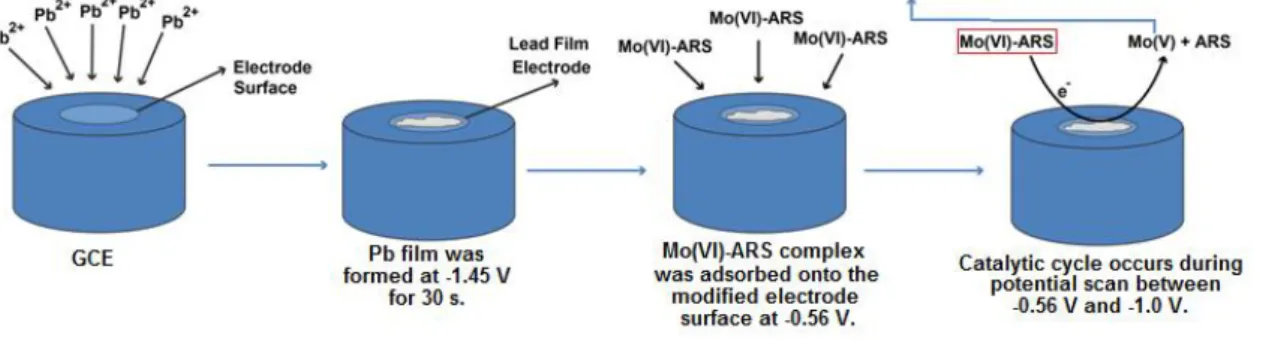
ARS and 5 µg/L Mo(VI) in 0.1 M pH 5 acetic acid/acetate buffer solution. Scan rates: 50-400 mV/s) As can be seen in Figure 3, Mo(VI) in the adsorbed Mo(VI)-ARS complex onto the electrode surface is reduced to Mo(V) by the driving force of potential. Afterwards Mo(V) oxidizes to Mo(VI) by chlorate then, Mo(VI)-ARS complex occurs again on the electrode surface. Therefore, the reduction process of Mo (VI) to Mo (V) called adsorptive catalytic procedure recreates.
Figure 3. Schematic representation of the procedure and the electrode reactions
3.2. Optimization studies for molybdenum determination
Solution parameters which are pH, concentration of ARS, potassium chlorate and lead and instrumental parameters which are deposition potential and time were optimized.
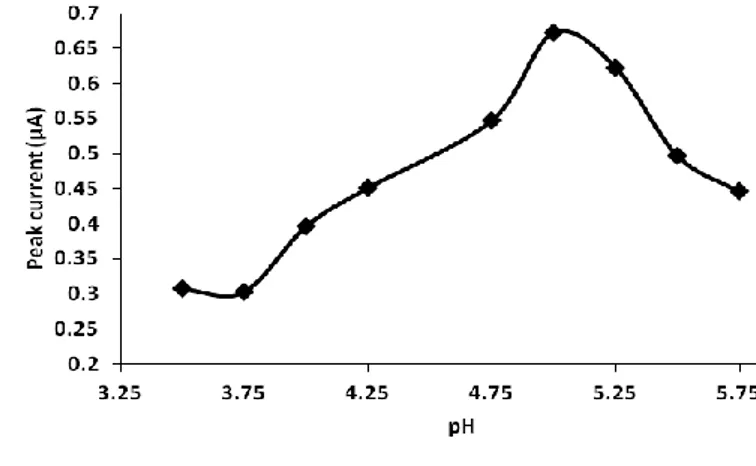
pH effect on peak current was investigated in the range of 3.50 - 5.75 in acidic acid/acetate solutions. pH-peak current curve can be seen in Figure 4. The peak current has a maximum level at pH 5, then decreased. Therefore pH 5 was selected as optimum pH. Also the peak potential (mV)-pH graph (not shown) was plotted and the slope of the graph is 57.6 mV that is close to 59 mV. This situation shows the Mo(VI)-ARS electrode reaction realizes with equal proton and electron.
Figure 4. Peak current (µA)-pH curve (4x10⁻⁴ M Pb2+, 8x10⁻² M KClO3, 7x10⁻⁷ M ARS and 2x10⁻⁸ M
Mo(VI) in 0.1 M pH 3.50-5.75 acetic acid/acetate solutions)
The concentration of ARS is important for both formation of stable complex and the situation of competitive adsorption between free ARS and the ARS side of Mo(VI)-ARS complex. As can be seen the peak current (µA)-concentration of ARS (µM) curve (Figure 5), the peak current was increased up to 0.7 µM, then decreased dramatically. It is supposed that the decreasing of peak current resulted from competitive adsorption between free ARS and the ARS side of Mo(VI)-ARS complex. Consequently, 0.7 µM ARS was chosen as an optimal concentration.
Figure 5. Peak current (µA)-ARS concentration (µM) curve (4x10⁻⁴ M Pb2+, 8x10⁻² M KClO3 and
2x10⁻⁸ M Mo(VI) in 0.1 M pH 5 acetic acid/acetate buffer solution. ARS concentrations: 10-9-10-6 M) Additionally, potassium chlorate concentration for catalytic effect and lead concentration for electrode modification were optimized. The effect of potassium chlorate concentration was investigated between 0.008-0.300 M, the peak current was increased up to 0.250 M (not shown). However, the reason of sufficiency for determination of molybdenum in drinking water samples, 0.08 M potassium chlorate was randomly chosen as an optimal value. The lead concentration was evaluated between 1x10⁻⁶-8x10⁻⁴ M, the peak current reached the maximum value with 4x10⁻⁴ M, then decreased (not shown). Optimum lead concentration was selected as 4x10⁻⁴ M.
The effect of deposition potential was examined between -525 mV and -750 mV. The peak current was almost same to -575 mV, then diminished (not shown). The optimum deposition potential was chosen as -560 mV. The effect of deposition time was examined between 0-400 s. It was monitored that the peak current increased up to 400 s (not shown). Similarly to potassium chlorate optimization study because of the sufficiency of the method to applicable to drinking water samples, 60 s was chosen as optimum deposition time.
3.3. Validation and application of the method
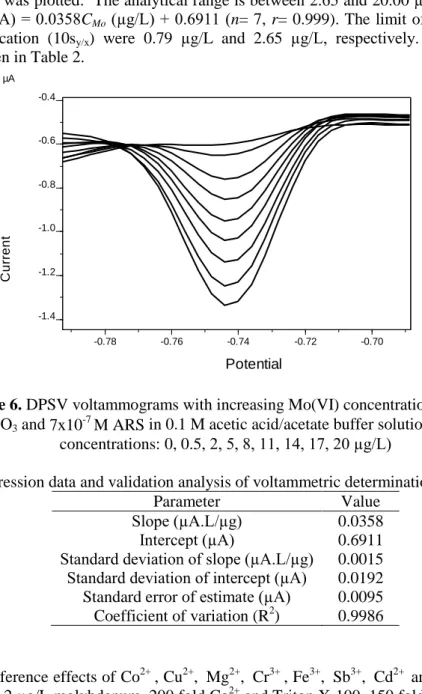
Differential stripping voltammograms were taken under optimum conditions (Figure 6) and calibration graph was plotted. The analytical range is between 2.65 and 20.00 µg/L with a regression equation of Ipa(µA) = 0.0358CMo (µg/L) + 0.6911 (n= 7, r= 0.999). The limit of detection (3sy/x) and
limit of quantification (10sy/x) were 0.79 µg/L and 2.65 µg/L, respectively. The regression data
analysis was given in Table 2.
Potential C u rr e n t -0.78 -0.76 -0.74 -0.72 -0.70 V -1.4 -1.2 -1.0 -0.8 -0.6 -0.4 µA
Figure 6. DPSV voltammograms with increasing Mo(VI) concentrations (4x10⁻⁴
M Pb2+, 8x10⁻² M KClO3 and 7x10⁻⁷ M ARS in 0.1 M acetic acid/acetate buffer solution at pH 5. Mo(VI)
concentrations: 0, 0.5, 2, 5, 8, 11, 14, 17, 20 µg/L)
Table 2. The regression data and validation analysis of voltammetric determination of molybdenum
Parameter Value
Slope (µA.L/µg) 0.0358 Intercept (µA) 0.6911 Standard deviation of slope (µA.L/µg) 0.0015 Standard deviation of intercept (µA) 0.0192 Standard error of estimate (µA) 0.0095 Coefficient of variation (R2) 0.9986
The interference effects of Co2+ , Cu2+, Mg2+, Cr3+ , Fe3+, Sb3+, Cd2+ and Triton X-100 were investigated with 2 µg/L molybdenum. 200 fold Co2+ and Triton X-100, 150 fold Cr3+, 100 fold Cu2+ and Fe3+ have no effect on the peak current according to ±%5 change. On the other hand, Mg2+, Sb3+ and Cd2+ are seriously interfere, but the interference effect of Mg2+ and Cu2+ were eliminated with addition of the EDTA into the solution.
The real sample applications were given in Table 3. The recovery values of drinking water samples change between 98.3% and 110.7% and RSD values of these samples are between 3.86 and 14.86. Since the content of molybdenum in drinking water is very close to LOD, obtaining the high RSD value around the LOD is ordinary.
Table 3. Real sample applications in drinking water Spiked Mo(VI) (µg/L) Found Mo(VI) (µg/L) Recovery (%) RSD (%) - 0.74 ± 0.11a - 14.86 1 1.71 ± 0.14a 98.3 8.19 3 4.14 ± 0.16b 110.7 3.86
a : the mean of six measurements, b : the mean of three measurements
Since variations of influence quantities may affect a measurement result in both random and systematic ways, the qualitative performance characteristics of the measurements includes both trueness and precision,
Measurement uncertainty of a result is formed from a combination of systematic error and random error [36]. From this point of view the following equation for calculation of expanded uncertainty can be written;
100
%
2
%
%
T
xRSD
U
(1)
w
here, U is expanded uncertainty of the result obtained in the method, T is the trueness and RSD is the relative standard deviation. In this equation, the term100 T
%
represents the total systematic error of the method while the term 2xRSD% represents the total random error. Six independent drinking water samples spiked with 12 µg/L Mo(VI) were analysed by the proposed method. The mean of six measurements, T% and RSD were calculated as 11.915 µg/L, 99.289% and 2.172%, respectively. From the equation (1), U% was calculated as 2.248 and it was transformed to U which was 0.268. The result can be expressed as (11.915 ± 0.268) µg/L (ρ = 0.025).4. Conclusions
A new, selective, sensitive and accurate method for voltammetric determination of molybdenum was described. As far as we know there is no study that consisting of comprehensive validation and uncertainty examinations. Accuracy of the method has been successfully proved in drinking water samples for 95% confidence level.
The sensitivity of the method can be terrifically improved with increasing of potassium chlorate concentration or deposition time. As the limit values of molybdenum in drinking waters (the least: 10 µg/L) are examined, the proposed method has good LOD value (0.79 µg/L). Because of this reason the higher concentrations of potassium chlorate or the higher deposition time were not used.
The proposed method is comparable to all voltammetric molybdenum determination methods used solid electrodes.
ORCID
Nail Deniz: 0000-0002-8883-5138
Lokman Liv: 0000-0001-8008-1012
Nuri Nakiboğlu: 0000-0002-5527-6472
References
[1] Wikipedia (2017). Molybdenum. https://en.wikipedia.org/wiki/Molybdenum. (accessed 22 March 2017). [2] R. R. Mendel (2009). Cell biology of molybdenum, Biofactors 35, 429-434.
[3] D. G. Barceloux and D. Barceloux (1999). Molybdenum, J. Toxicol.: Clin. Toxicol. 37:2, 231-237. [4] N. Nakiboglu, Z. Tünay and İ.Şahin (2011). Determination of molybdenum by adsorptive catalytic
stripping voltammetry in the presence of alizarin red s and persulphate, Fresen. Environ. Bull. 20, 939-944.
[5] S. B. Adeloju and P. Fleurdelis (1995). Adsorptive stripping voltammetric determination of ultratrace concentrations of molybdenum in biological and environmental materials on a glassy carbon mercury film electrode, Electroanalysis 7, 476-482.
[6] Z. Gao and K. S. Siow (1996). Catalytic-adsorptive stripping voltammetric determination of molybdenum in plant foodstuffs, Talanta 43, 719-726.
[7] Y. C. Sun, J. Mierzwa and C. R. Lan (2000). Direct determination of molybdenum in seawater by adsorption cathodic stripping square-wave voltammetry, Talanta 52, 417-424.
[8] A. Safavi and E. Shams (1999). Selective determination of ultra trace concentrations of molybdenum by catalytic adsorptive stripping voltammetry, Anal. Chim. Acta. 396, 215-220.
[9] A. Safavi and E. Shams (2001). Electrochemical investigation of Mo(VI)-MTB-ClO3
system in phosphate buffer, Iran. J. Chem. Chem. Eng. 20, 96-101.
[10] S. Sander (1999). Simultaneous adsorptive stripping voltammetric determination of molybdenum(VI), uranium(VI), vanadium(V), and antimony(III), Anal. Chim. Acta. 394, 81-89.
[11] R. Piech, E. Niewiara, P. Paczosa-Bator and M. Szlósarczyk (2011). The determination of molybdenum in selected mushrooms by stripping voltammetry, Cent. Eur. J. Chem. 9, 352-356.
[12] R. Piech, B. Baś and W. W. Kubiak (2008). The cyclic renewable mercury film silver based electrode for determination of molybdenum(VI) traces using adsorptive stripping voltammetry, Talanta 76, 295-300. [13] J. Wang, S. Thongngamdee and D. Lu (2006). Adsorptive stripping soltammetric measurements of trace
molybdenum at the bismuth film electrode, Electroanalysis 18, 59-63.
[14] N. V. V. Jyothi, B. N. Kumar, S. Venkateswarlu and T. Balaji (2012). Adsorptive stripping voltammetric determination of molybdenum in medicinal leaves and soil samples, Int. J. Chem. Anal. Sci. 3, 1587-1589.
[15] J. C. de Andrade, A. M. de Almeida, A. R. Coscione and L. M. Alexio (2001). Determination of molybdenum in steel by adsorptive stripping voltammetry in a homogeneous ternary solvent system, Analyst 126, 892-896.
[16] J. C. de Andrade, A. M. de Almeida, L. M. Alexio, A. R. Coscione and M. F. de Abreu (2003). Direct voltammetric determination of Mo(VI) in plants: the need for a multivariate study of interferences, Anal. Chim. Acta. 487, 243-248.
[17] Z. Gao, K. S. Siow and A. Ng (1996). Catalytic voltammetric determination of molybdenum at a chemically modified carbon paste electrode, Electroanalysis 8, 1183-1187.
[18] Z. Q. Gao and K. S. Siow (1996). Adsorptive stripping voltammetric determination of traces of molybdenum in natural-water in the presence of alpha-benzoinoxime, Microchim. Acta. 124, 211-218. [19] A. A. Ensafi, T. Khayamian and M. Atabati (2002). Simultaneous voltammetric determination of
molybdenum and copper by adsorption cathodic differential pulse stripping method using a principal component artificial neural network, Talanta 57, 785-793.
[20] K. Jiao, W. Jin and H. Metzner (1992). Determination of molybdenum in soils and plants using the polarographic adsorptive complex catalytic wave of Mo(VI)-cupferron, Anal. Chim. Acta. 260, 35-43. [21] H. Li and R. B. Smart (1997). Square wave catalytic stripping voltammetry of molybdenum complexed
with dihydroxynaphtalene, J. Electroanal. Chem. 429, 169-174.
[22] I. C. S. Fraga, P. M. E. Farias and A. K. Ohara (2000). Determination of molybdenum in the presence of 2-(2-benzothiazolylazo)-p-cresol by catalytic-adsorptive stripping voltammetry, Fresen. J. Anal. Chem. 366, 307-309.
[23] F. Quentel (1999). Voltammetric study of molybdenum in the presence of phenanthroline, Electroanalysis 11, 1355-1360.
[24] Z. L. Jiang, Q. Gong and M. D. Liu (1994). A new catalytic method for the determination of trace amounts of molybdenum with linear scan voltammetry at a DME, Anal. Lett. 27, 1945-1954.
[25] M. M. P. M. Neto, M. M. G. S. Rocha and C. M. A. Brett (1994). Square wave adsorptive stripping voltammetry of molybdenum(VI) in continious flow at a wall-jet mercury film electrode sensor, Talanta 41, 1597-1601.
[26] A. A. Ensafi, T. Khayamian and S. S. Khaloo (2004). Application of adsorptive cathodic differential pulse stripping method for simultaneous determination of copper and molybdenum using pyrogallol red, Anal. Chim. Acta. 505, 201-207.
[27] S. Koçak and F. N. Ertaş (2013). Centri-voltammetric determination of molybdenum, Anal. Method. 5, 741-747.
[28] K. Yokoi and C. M. G. Van den Berg (1992). Simultaneous determination of titanium and molybdenum in natural waters by catalytic cathodic stripping voltammetry, Anal. Chim. Acta. 257, 293-299.
[29] M. Stadlober, K. Kalcher and G. Raber (1997). A new method for the voltammetric determination of molybdenum(VI) using carbon paste electrodes modified in situ with cetyltrimethylammonium bromide, Anal. Chim. Acta. 350, 319-328.
[30] A. A. Ensafi and S. S. Khaloo (2004). Determination of traces molybdenum by catalytic adsorptive stripping voltammetry, Talanta 65, 781-788.
[31] P. H. Deng, Y. I. Feng and J. J. Fei (2011). A new electrochemical method for the determination of trace molybdenum(VI) using carbon paste electrode modified with sodium dodecyl sulfate, J. Electroanal. Chem. 661, 367-373.
[32] P. Deng, J. Fei, J. Zhang and Y. Feng (2011). Determination of molybdenum by adsorptive anodic stripping voltammetry of molybdenum–alizarin violet complex at an acetylene black paste electrode, Food Chem. 124, 1231-1237.
[33] K. Tyszczuk and M. Korolczuk (2008). Adsorptive stripping voltammetric determination of trace concentrations of molybdenum at an in situ plated lead film electrode, Anal. Chim. Acta. 624, 232-237. [34] R. Jugade and A. P. Joshi (2005). Trace determination of Mo(VI) by adsorptive cathodic stripping
voltammetry, Acta Chim. Slov. 52, 145-148.
[35] G. V. Prokhorova, V. M. Ivanov and G. A. Kochelaeva (2000). Azo compounds as reagents for the voltammetric determination of molybdenum(VI), J. Anal. Chem. 55, 669-672.
[36] A. Menditto, M. Patriarca and B. Magnusson (2007). Understanding the meaning of accuracy, trueness and precision, Accredit. Qual. Assur. 12, 45–47.